0373
3D UTE-T2* analysis of diseased Achilles tendons and the correlation with clinical score1Department of Radiology, Fudan University Affiliated Huashan Hospital, Shanghai, People's Republic of China, 2MR Research China, GE Healthcare, Shanghai, People's Republic of China, 3Department of Sports Medicine, Fudan University Affiliated Huashan Hospital, Shanghai, People's Republic of China
Synopsis
This study used 3D UTE-T2*, a novel quantitative technique with potential short-T2* relaxations to investigate T2* value in diseased Achilles tendon(AT) and correlation between T2* value and AOFAS, ATRS scores. Fifteen patients with AT disease and ten healthy controls matched sex, age, BMI were included. The results showed T2* values of insertion(INS), middle(MID), muscle-tendon junction(MTJ) and bulk region of AT in patients were statistically higher than healthy controls and negatively correlated with AOFAS, ATRS scores, which suggests UTE-T2* may be a promising marker for the detection of matrix changes in AT and give a precise guidance to clinical outcome.
Purpose
Achilles tendinopathy, a syndrome with Achilles tendon(AT) pain, tenderness and swelling that limited the tendon function is one of the most common injures and the prevalence increased in the last decades.[1] The conventional clinical MRI sequences are useful for visualizing the tissues with relatively long transversal T2 relaxation times.[2] However, AT mainly consists of collagen fibers (mostly type I collagen) which results in extremely short relaxation parameters, a short echo time (TE) must be used to acquire signal from the AT. Three-dimensional ultrashort echo-time (3D-UTE) imaging, with the echo time as short as 0.05–0.5ms, provided direct visualization and quantitative T2*-mapping of short T2* components such as AT.[3] Biochemical changes of AT can be caught and quantified with UTE sequences as well.[4] By now, several studies on T2* quantification in patients with Achilles tendinopathy were published. Therefore, the aim of this study was to investigate the capability of quantitative 3D-UTE T2* in evaluating diseased AT and analyze the correlation between T2* value of the pathologic AT and American Orthopaedic Foot and Ankle Society (AOFAS) score or Achilles tendon Total Rupture Score (ATRS).Methods
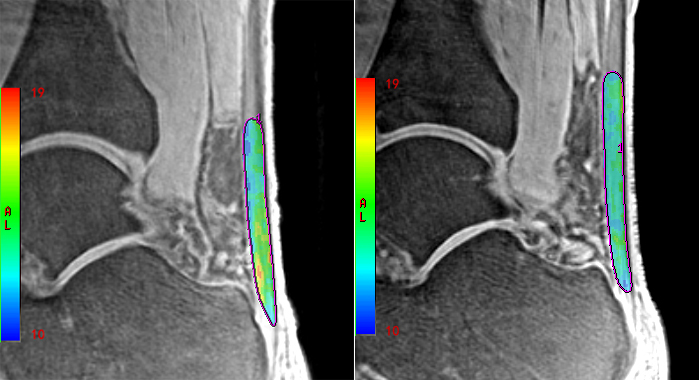
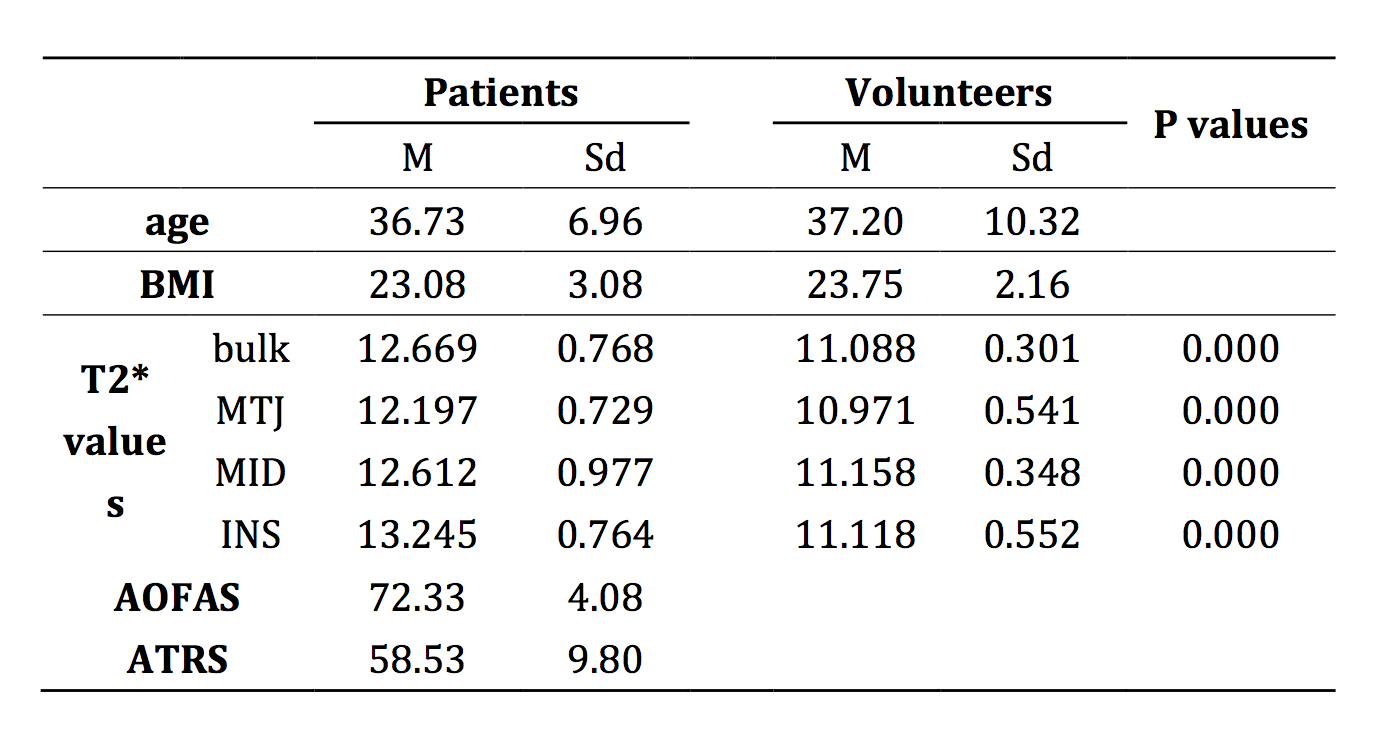
The study was approved by the institutional review board of our hospital and all participants’ informed consent were obtained. Fifteen patients (14 male/1 female, mean age 36.73±6.96 years, BMI 23.08±3.08kg/m2) with pain or abnormalities in the AT and ten healthy volunteers matched for sex, age and BMI (9 male/1 female, mean age 37.20±10.32 years, BMI 23.75±2.16kg/m2) participated in the study. All the participants underwent 3T MR scan with four echo times (TE = 0.032, 3.4, 6.8 and 10.2ms) quantitative 3D-UTE sequence and get mono-exponential calculation of T2* in AT in vivo. The AT was segmented and divided into three parts equally according to length: insertion (INS), middle (MID) and muscle-tendon junction (MTJ). (Fig. 1) These three ROIs as well as all bulk of AT regions on each echo of UTE-T2* images were drawn to get the mean MR signal and then the mean T2* values of each region were calculated. (Fig. 2) For clinical evaluation, AOFAS scoring system and ATRS were used to evaluate the patients’ clinical outcome (0–100 points, worst to best). An independent sample t-test was used to compare the differences of T2* values between two groups. Pearson's correlation coefficient was used to analyze correlations between clinical scores and T2* values of patients. The difference would be statistically significant if P value <0.05.Results
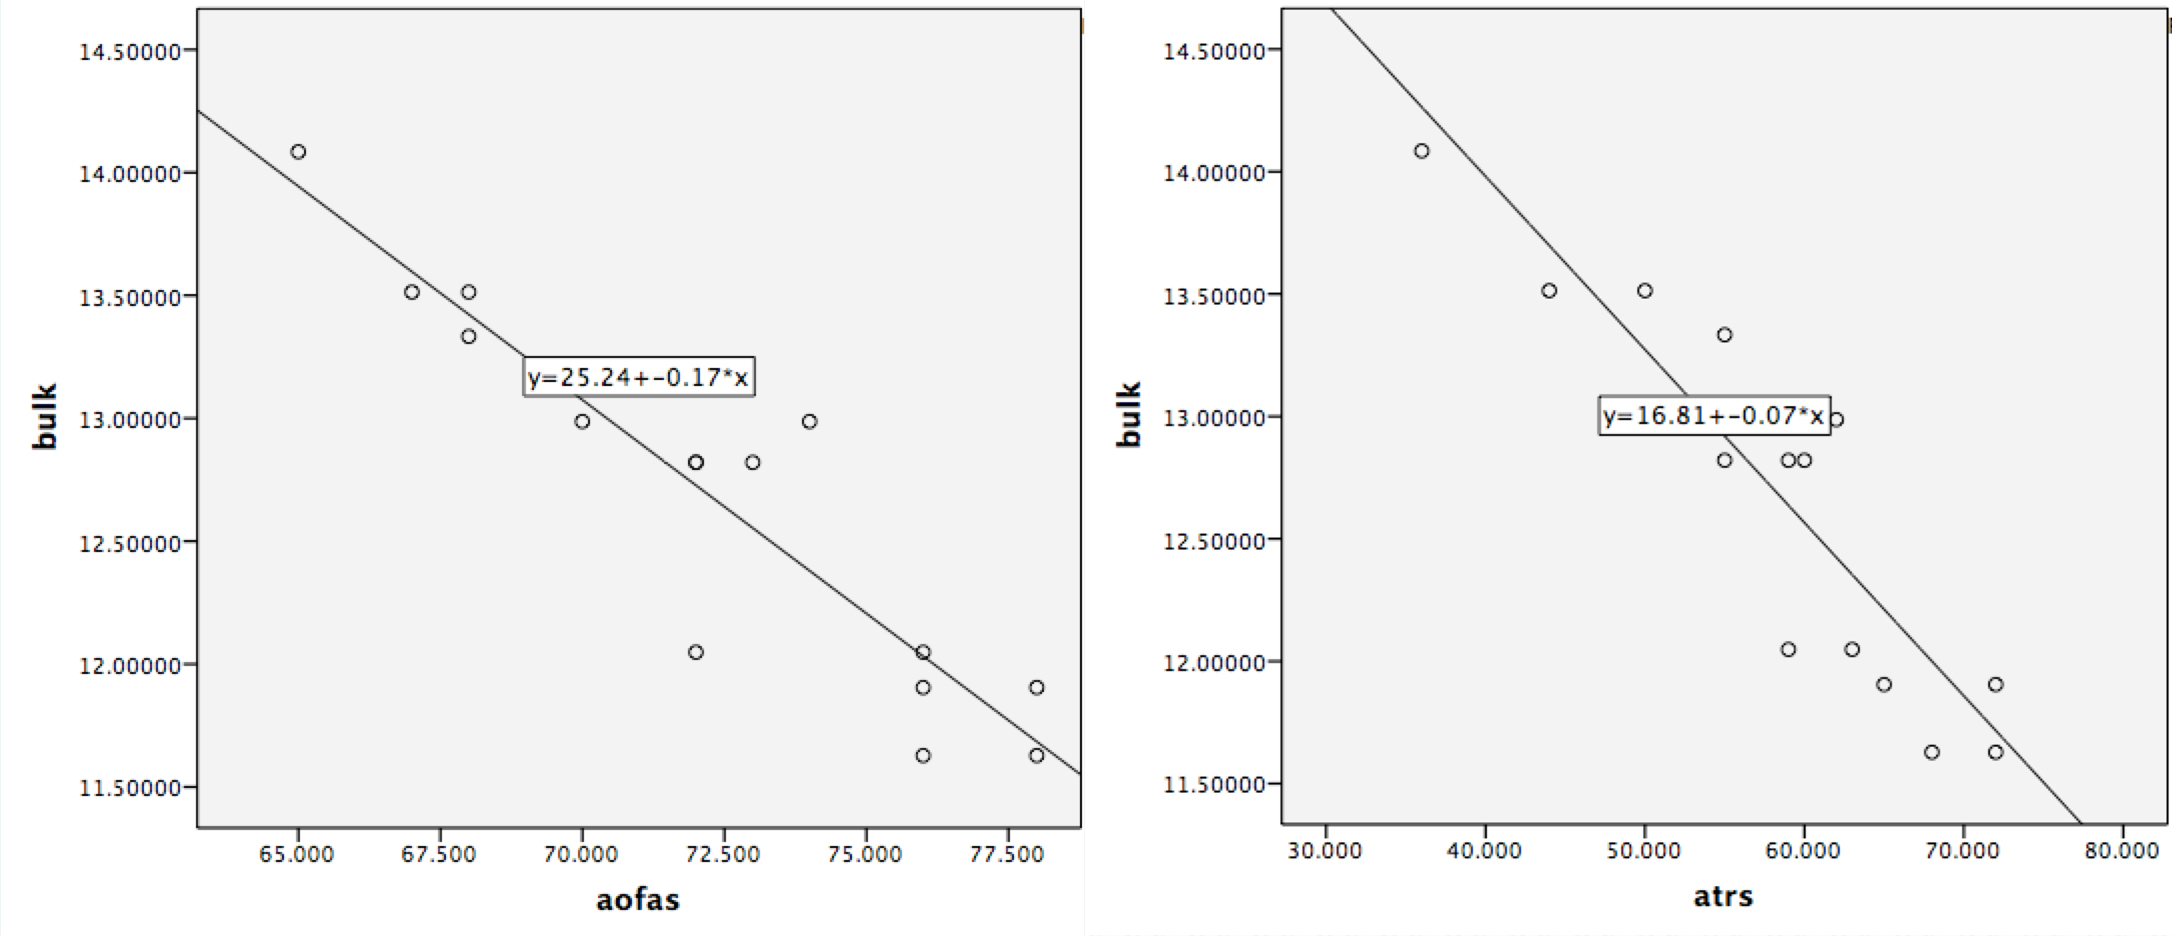
There were no obvious tendon tears on MRI for all patients. The mean T2* value for bulk ROIs was significantly higher in patients than that in volunteers(12.669±0.768 & 11.088±0.301, P=0.000). Separately, MTJ, MID and INS regions of patients had statistically higher T2* value compared with the matched regions of volunteers(MTJ: 12.197±0.729 & 10.971±0.541, P=0.000, MID: 12.612±0.977 & 11.158±0.348, P=0.000, INS: 13.245±0.764 & 11.118±0.552, P=0.000). (Table 1) The difference in INS region is greater than that in MTJ (P<0.05). In patients, the mean AOFAS and ATRS were 72.33±4.08 & 58.53±9.80, respectively. The T2* value for bulk region was negatively correlated with AOFAS and ATRS score (R = -0.924, P = 0.000 & R =-0.904, P = 0.000). (Fig. 3)Discussion and Conclusion
UTE-T2* mapping, a novel quantitative technique, could catch the short-T2* relaxations from AT that are not well captured by standard T2 mapping [4]. In the early stages of Achilles tendinopathy, it is usually biochemical but not morphological changes that are found [4], including destruction of collagen structure, increase of proteoglycan and water content [5]. In this study, a significant higher T2* value was observed in all four regions of diseased AT. It suggests that the variability of Achilles tendinopathy can be quantified by UTE-T2*. UTE-T2* is a sensitive and promising marker to detect AT tendinopathy. And the causes of the greater difference in INS might be the enthesis is mostly involved in overuse injuries of AT [6]. AOFAS and ATRS score are both widely used in clinical practice and validated in many studies [7]. They had general assessment of the AT situation. T2* value of the bulk region in patients was correlated with AOFAS and ATRS score, which suggests the T2* could give a precise guidance to clinical outcome of patients with Achilles tendinopathy. Further investigation in larger cohort of patients, different terms follow-up after different treatments are required to define the exact role of UTE-T2* on monitoring the changing process of diseased AT.Acknowledgements
No acknowledgement found.References
[1] Rees SG, Dent CM, Caterson B. Metabolism of proteoglycans in tendon. Scand J Med Sci Sports 2009;19(4):470–8.
[2] Juras V, Zbyn S, Pressl C, et al. Regional variations of T(2)* in healthy and pathologic achilles tendon in vivo at 7 Tesla: preliminary results. Magn Reson Med 2012;68(5):1607-13.
[3] Juras V, Apprich S, Szomolanyi P, et al. Bi-exponential T2 analysis of healthy and diseased Achilles tendons: an in vivo preliminary magnetic resonance study and correlation with clinical score. Eur Radiol 2013;23(10):2814-22.
[4] Chang EY, Du J, Chung CB. UTE imaging in the musculoskeletal system. J Magn Reson Imaging 2015;41(4):870-83.
[5] Filho GH, Du J, Pak BC, et al. Quantitative characterization of the Achilles tendon in cadaveric specimens: T1 and T2* measurements using ultrashort-TE MRI at 3 T. AJR Am J Roentgenol 2009;192(3):W117-24.
[6] Benjamin M, Toumi H, Ralphs JR, et al. Where tendons and ligaments meet bone: attachment sites (‘entheses’) in relation to exercise and/or mechanical load. J Anat. 2006; 208:471–490.
[7] Lapidus LJ, Ray BA, Hamberg P. Medial Achilles tendon island flap-a novel technique to treat reruptures and neglected ruptures of the Achilles tendon. Int Orthop 2012;36:1629–1634
Figures