0371
Accuracy and Reproducibility of Iron Quantification using Ultra-Short TE Imaging at 1.5T and 3.0T1Radiology, University of Wisconsin, Madison, WI, United States, 2Biomedical Engineering, University of Wisconsin, Madison, WI, United States, 3Medical Physics, University of Wisconsin, Madison, WI, United States, 4Medicine, University of Wisconsin, Madison, WI, United States, 5Emergency Medicine, University of Wisconsin, Madison, WI, United States
Synopsis
This work examined the accuracy and reproducibility of ultra-short TE (UTE) R2* mapping in patients with liver iron overload. Fifteen subjects with known or suspected liver iron overload were scanned at 1.5T and 3.0T using a radial UTE, two Cartesian multi-echo, gradient-echo acquisitions, and an R2-based (FerriScan) reference acquisition. UTE R2* measurements demonstrated excellent reproducibility across field strengths (with expected linear increase with field strength) and high correlation with liver iron concentration. Cartesian approaches offered excellent reproducibility for R2*<1000s-1. However R2*>1000s-1, neither Cartesian approach were reproducible across field strength, suggesting that the range of R2* had been surpassed.
Introduction
Clinical management of iron overload including detection, staging, and treatment monitoring require accurate assessment of liver iron content (LIC). MRI methods based on R2* mapping, typically performed using a Cartesian multi-echo gradient-echo acquisition, are commonly used to measure LIC1. However, R2* mapping with Cartesian acquisitions fail in severely iron loaded patients, particularly at higher field strengths (i.e. 3.0T), due to the limited minimum echo time. In recent years, ultra-short TE (UTE) R2* mapping has been proposed to extend the dynamic range of R2*-based LIC quantification2,3. The purpose of this work was to examine the reproducibility of UTE-R2* mapping across field strengths. A secondary aim was to compare the dynamic range of UTE-R2* mapping to Cartesian-R2* mapping methods.Methods
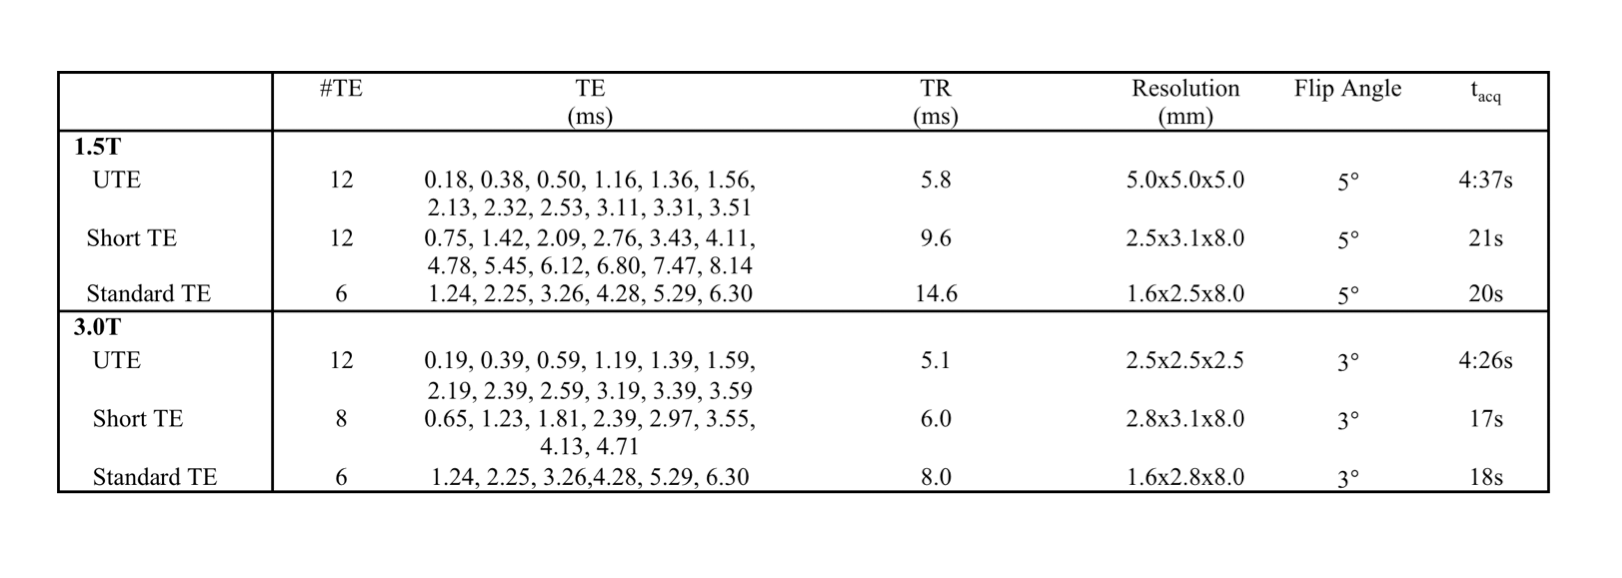
After receiving local Institutional Review Board (IRB) approval, fifteen subjects with known or suspected liver iron overload (female=5, male=10, age=43.2±18.9 years) were scanned at both 1.5T (HDxt, GE Healthcare, Waukesha, WI) and 3.0T (MR750, GE Healthcare, Waukesha, WI). At both field strengths, R2-based iron quantification (FerriScan, an independent, FDA approved, R2-based measurement of LIC), two breath-held Cartesian R2* quantification (with short TE and standard TE protocols), and free-breathing UTE R2* quantification were performed. Imaging parameters are summarized in Table 1. R2* maps were reconstructed offline using a complex-based chemical shift encoded signal model4, resulting in estimates of the water, fat, R2* and the field map. In cases where LIC>35mg Fe/g dry tissue (as measured by FerriScan), fat was removed from the R2* signal model for improved stability of the reconstruction. FerriScan acquisitions were uploaded to Resonance Health (Claremont, Australia), for LIC measurement based on a previously developed R2-LIC calibration curve. For each R2* measurement, a single region-of-interest (ROI) was drawn in the right lobe of the liver while avoiding large vessels and bile ducts on the reconstructed R2* maps.Results
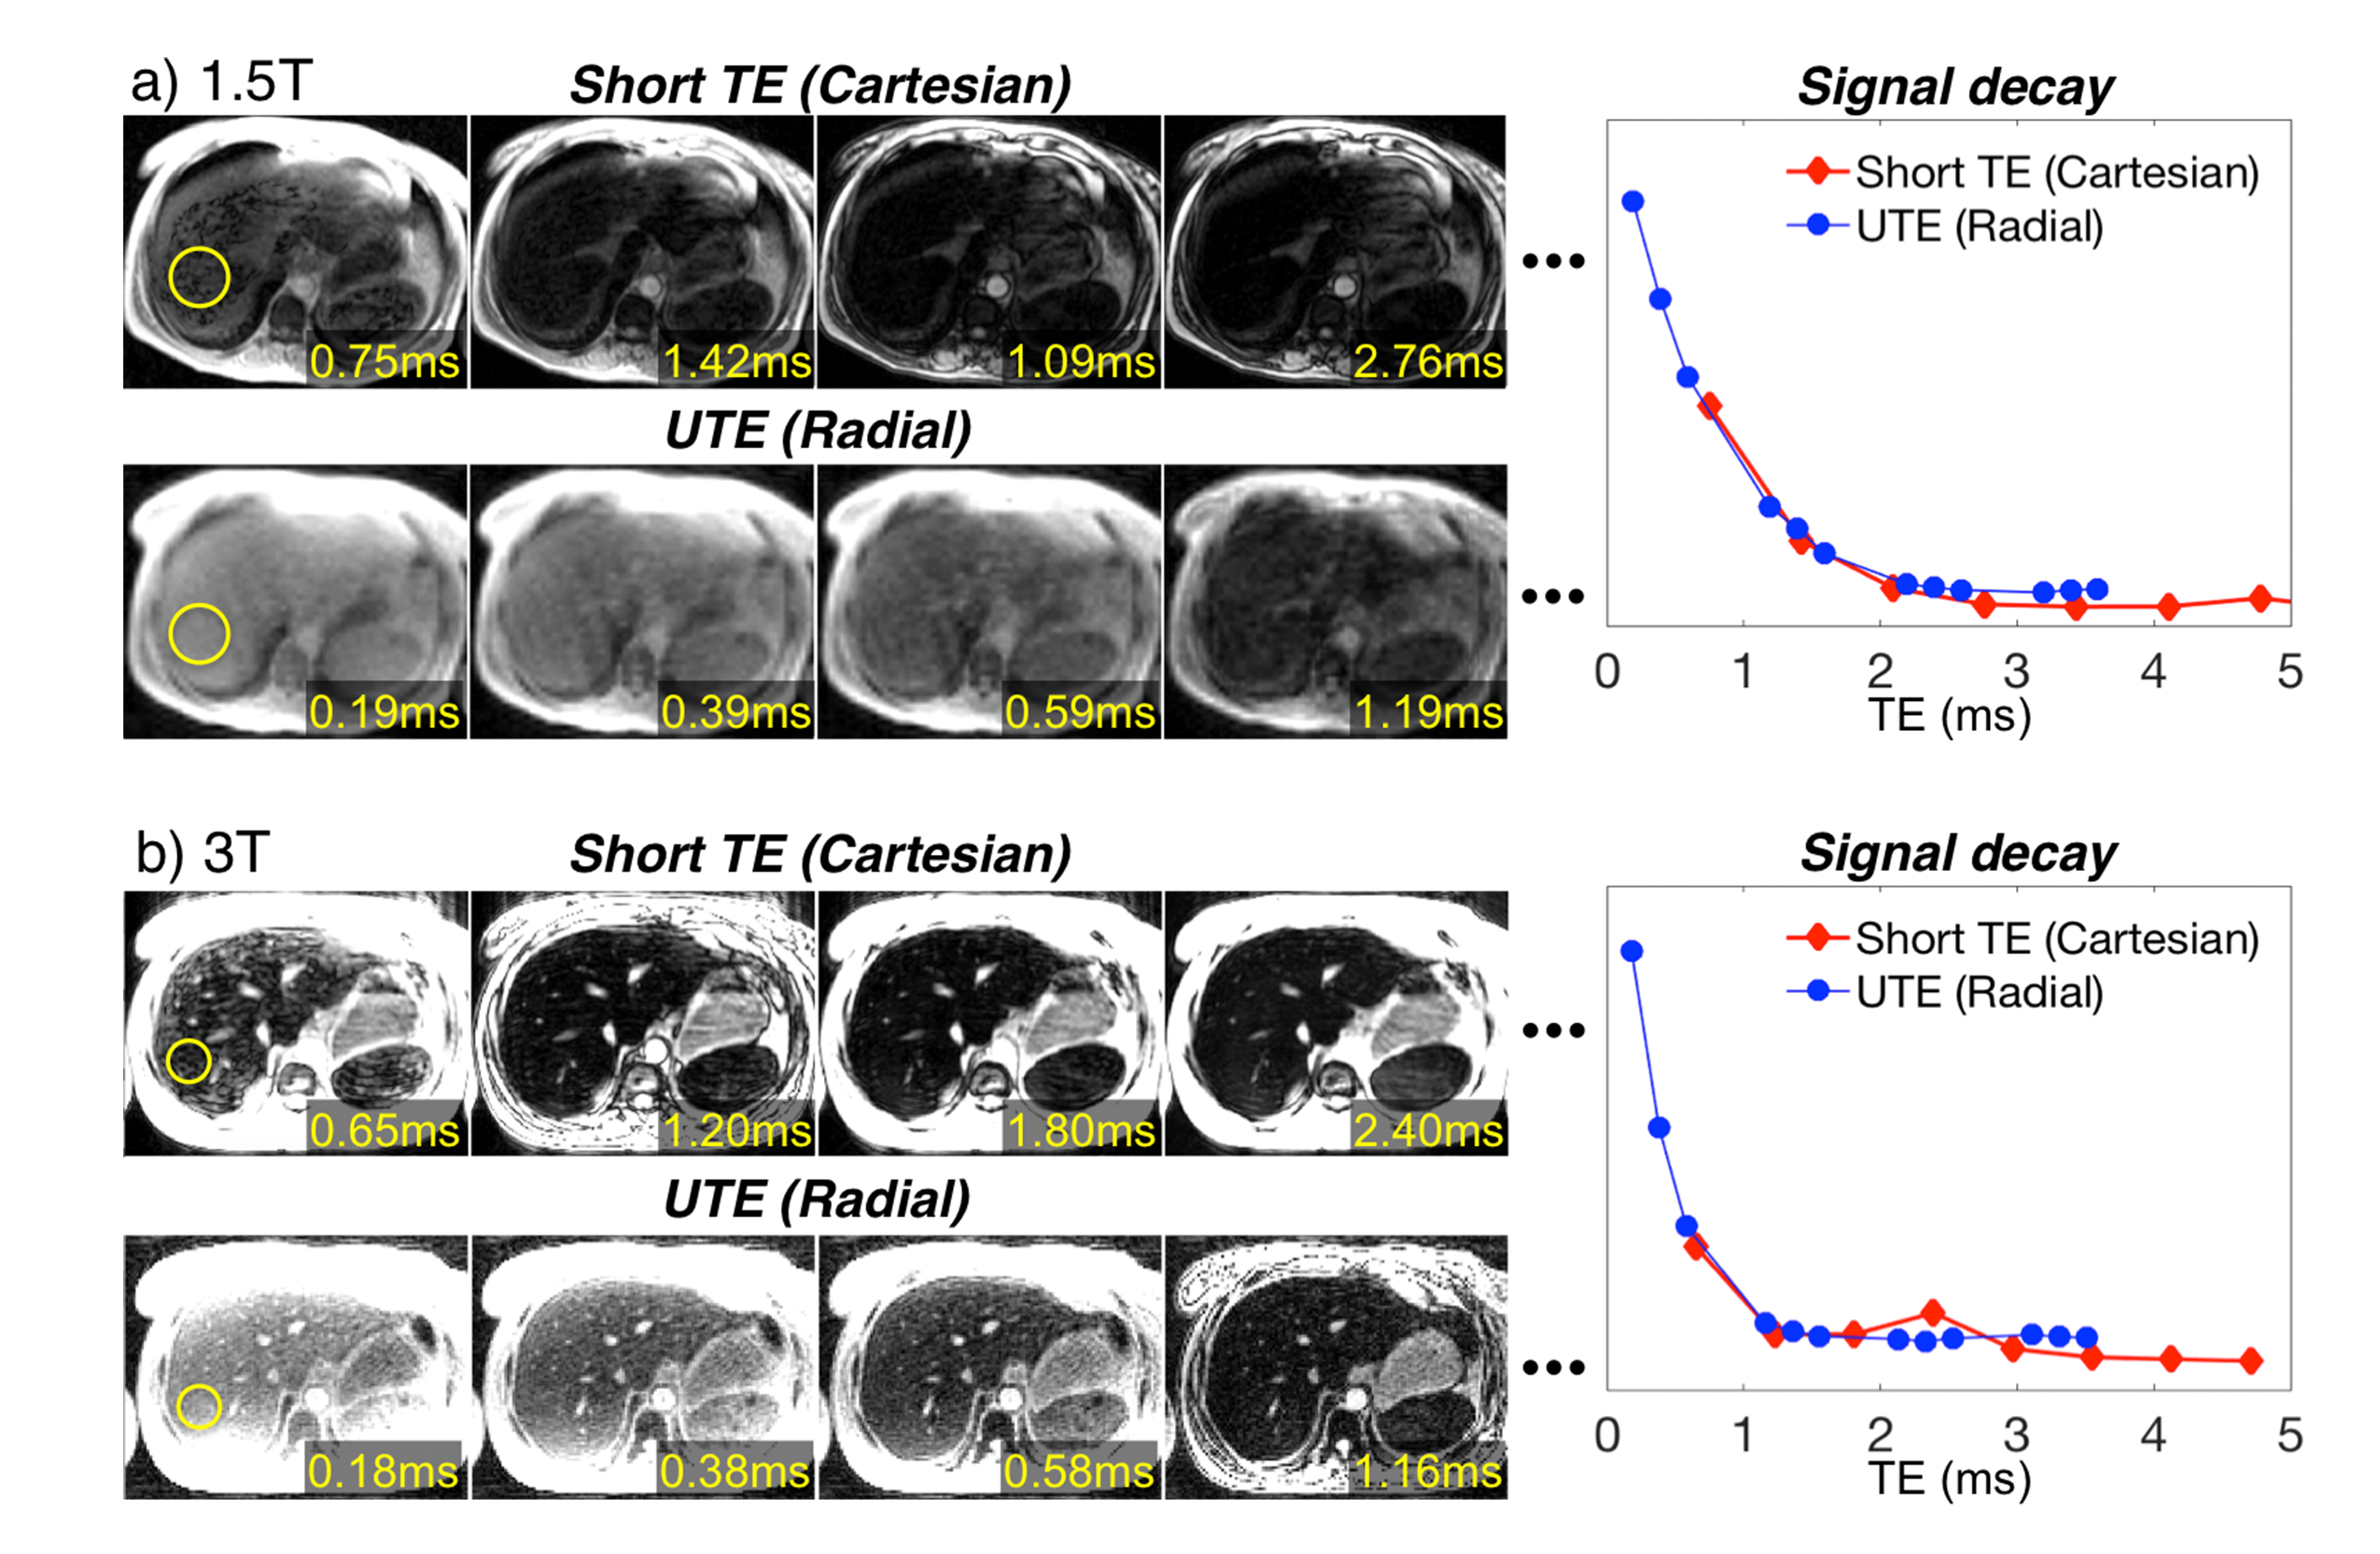
Figure 1 shows echo images and signal decay curves of Cartesian and UTE acquisitions at 1.5T and 3.0T. At 1.5T, both approaches can adequately sample the signal decay curve. However, at 3.0T, the signal decay curve is adequately sampled only when using UTE approach.
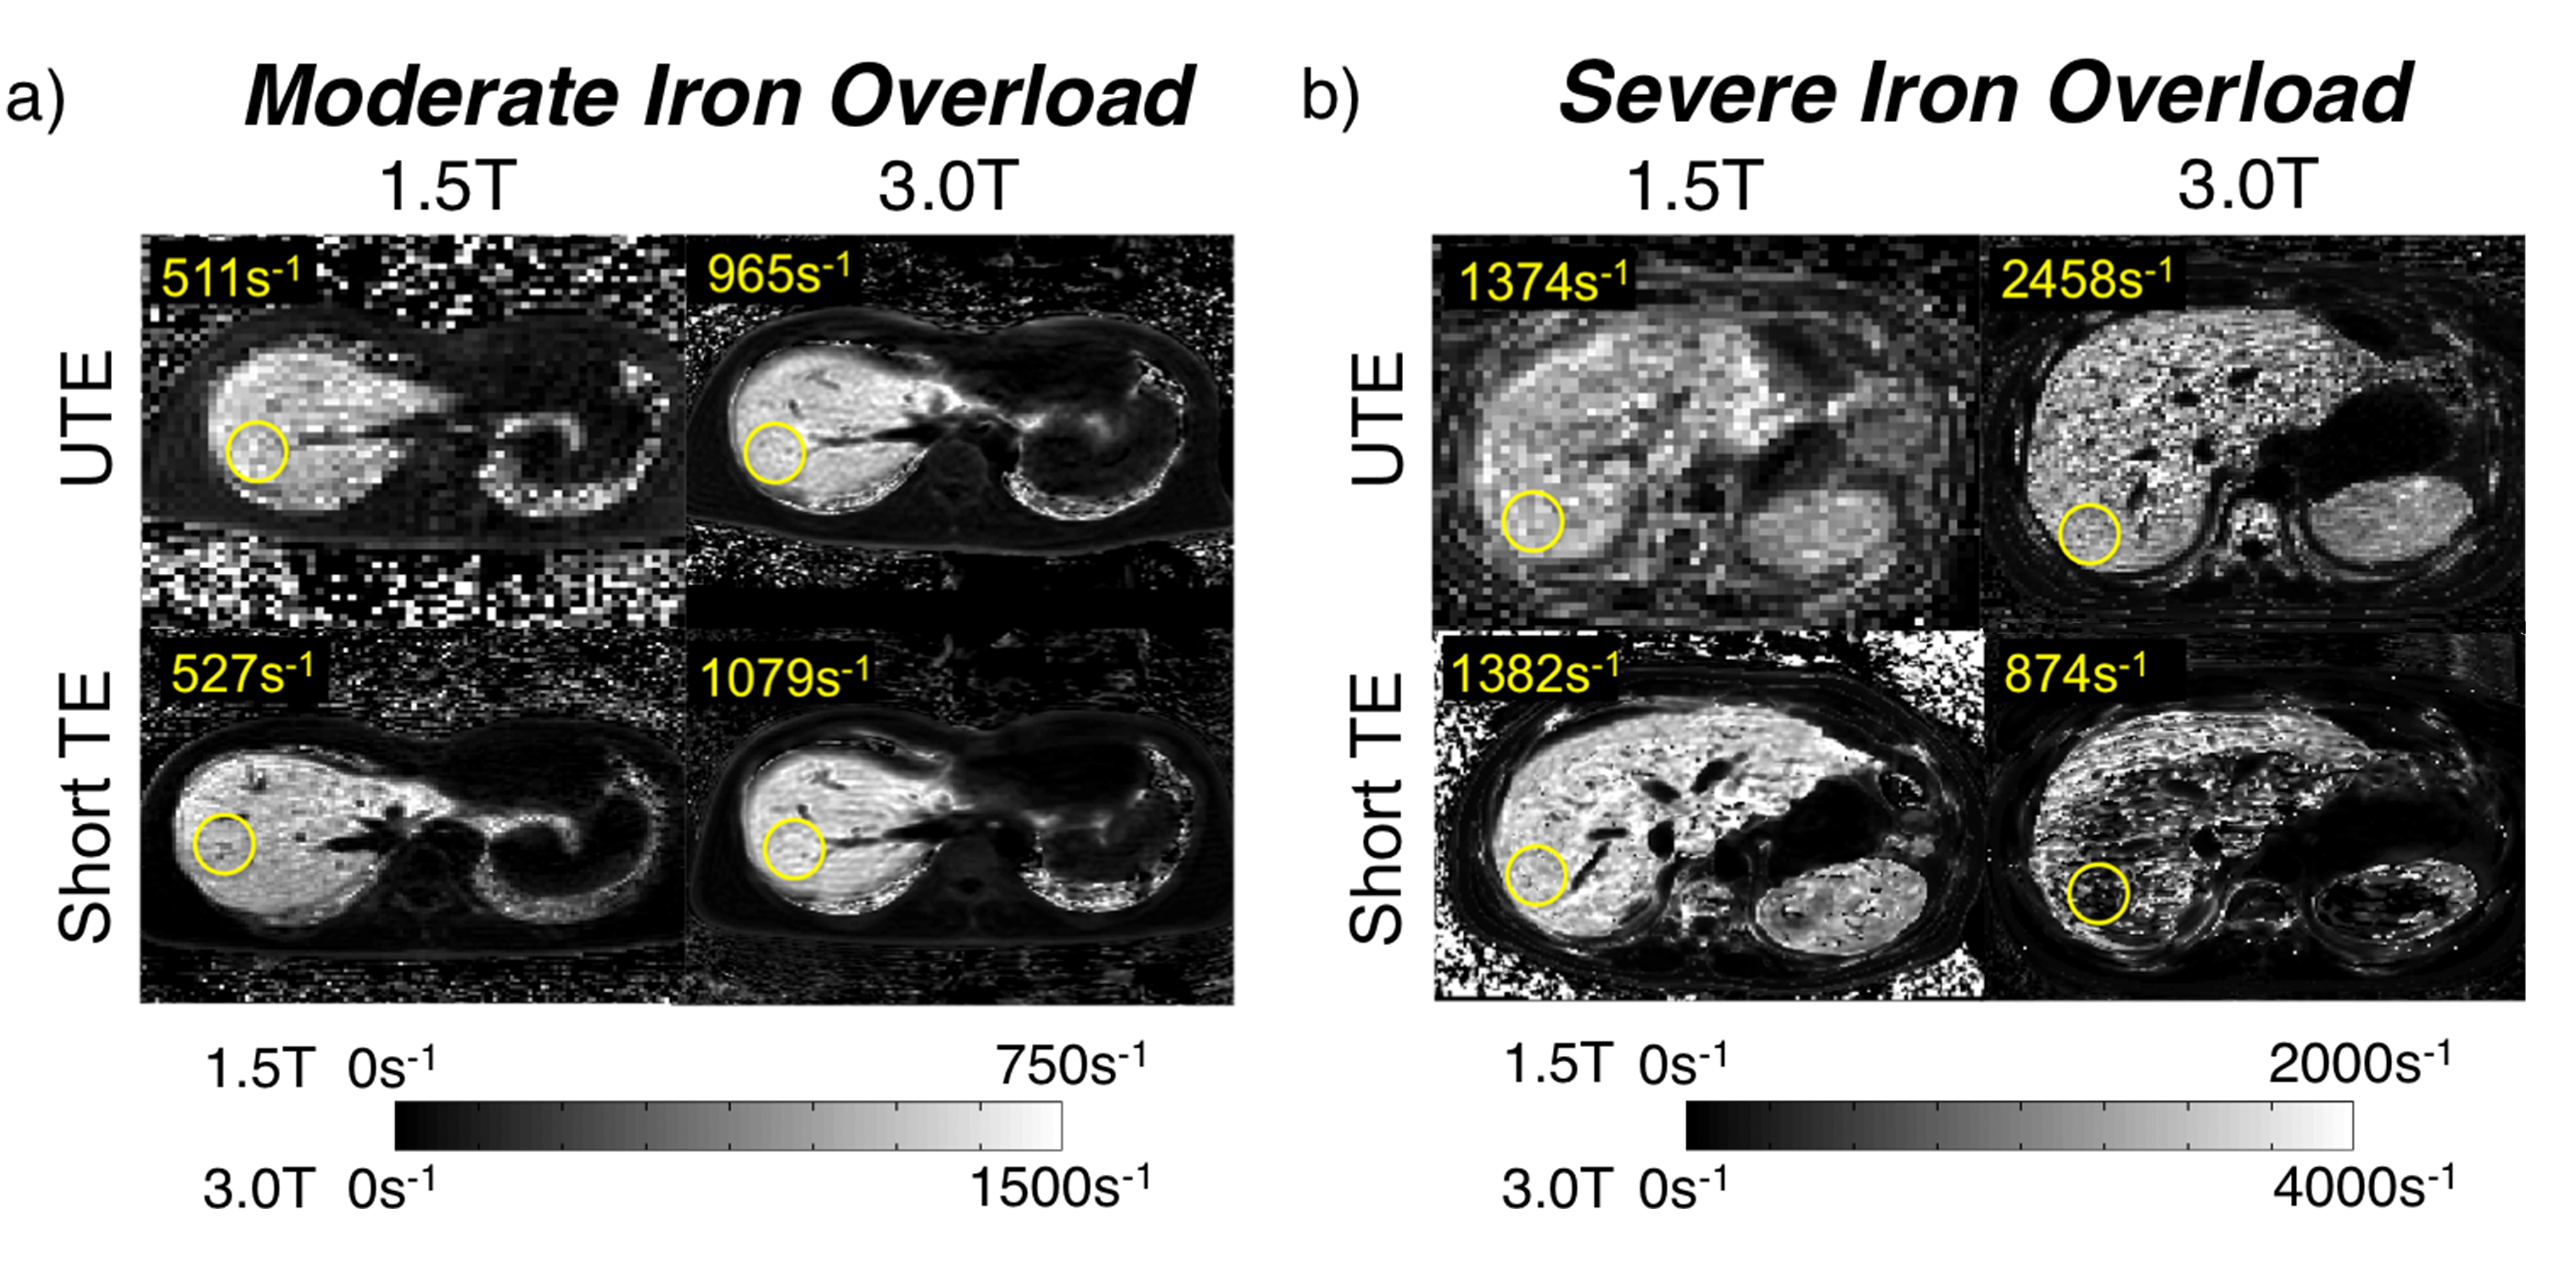
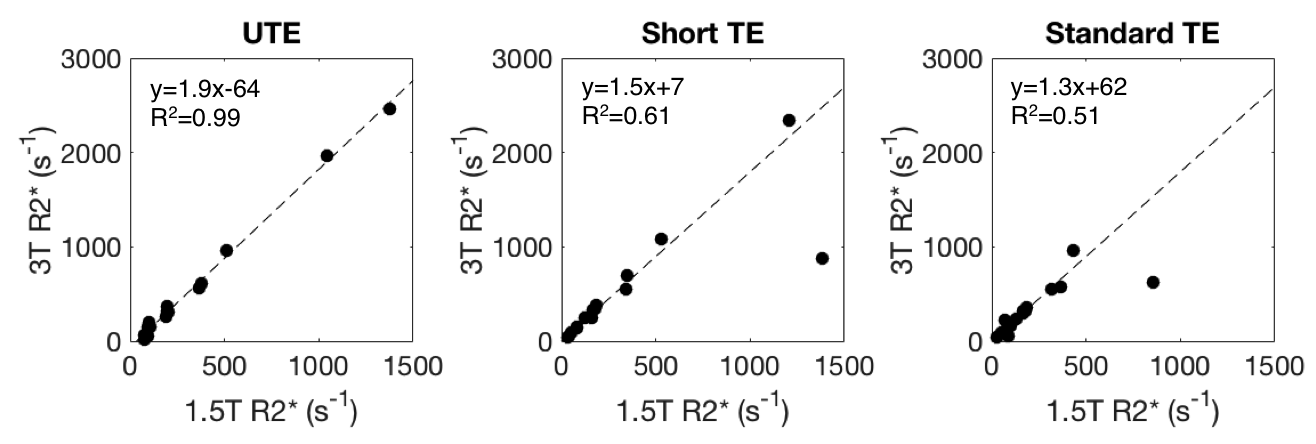
Representative R2* maps are shown for UTE and both Cartesian protocols at 1.5T and 3.0T for a subject with moderate iron overload (Figure 2a) and a subject with severe iron overload (Figure 2b). UTE-R2* mapping demonstrated excellent reproducibility between field strengths with a slope = 1.9 with R2=0.99 (Figure 3). Cartesian R2* mapping (R2*-short TE and R2*-standard TE) were not reproducible across field strengths at higher R2* resulting in weaker correlation.
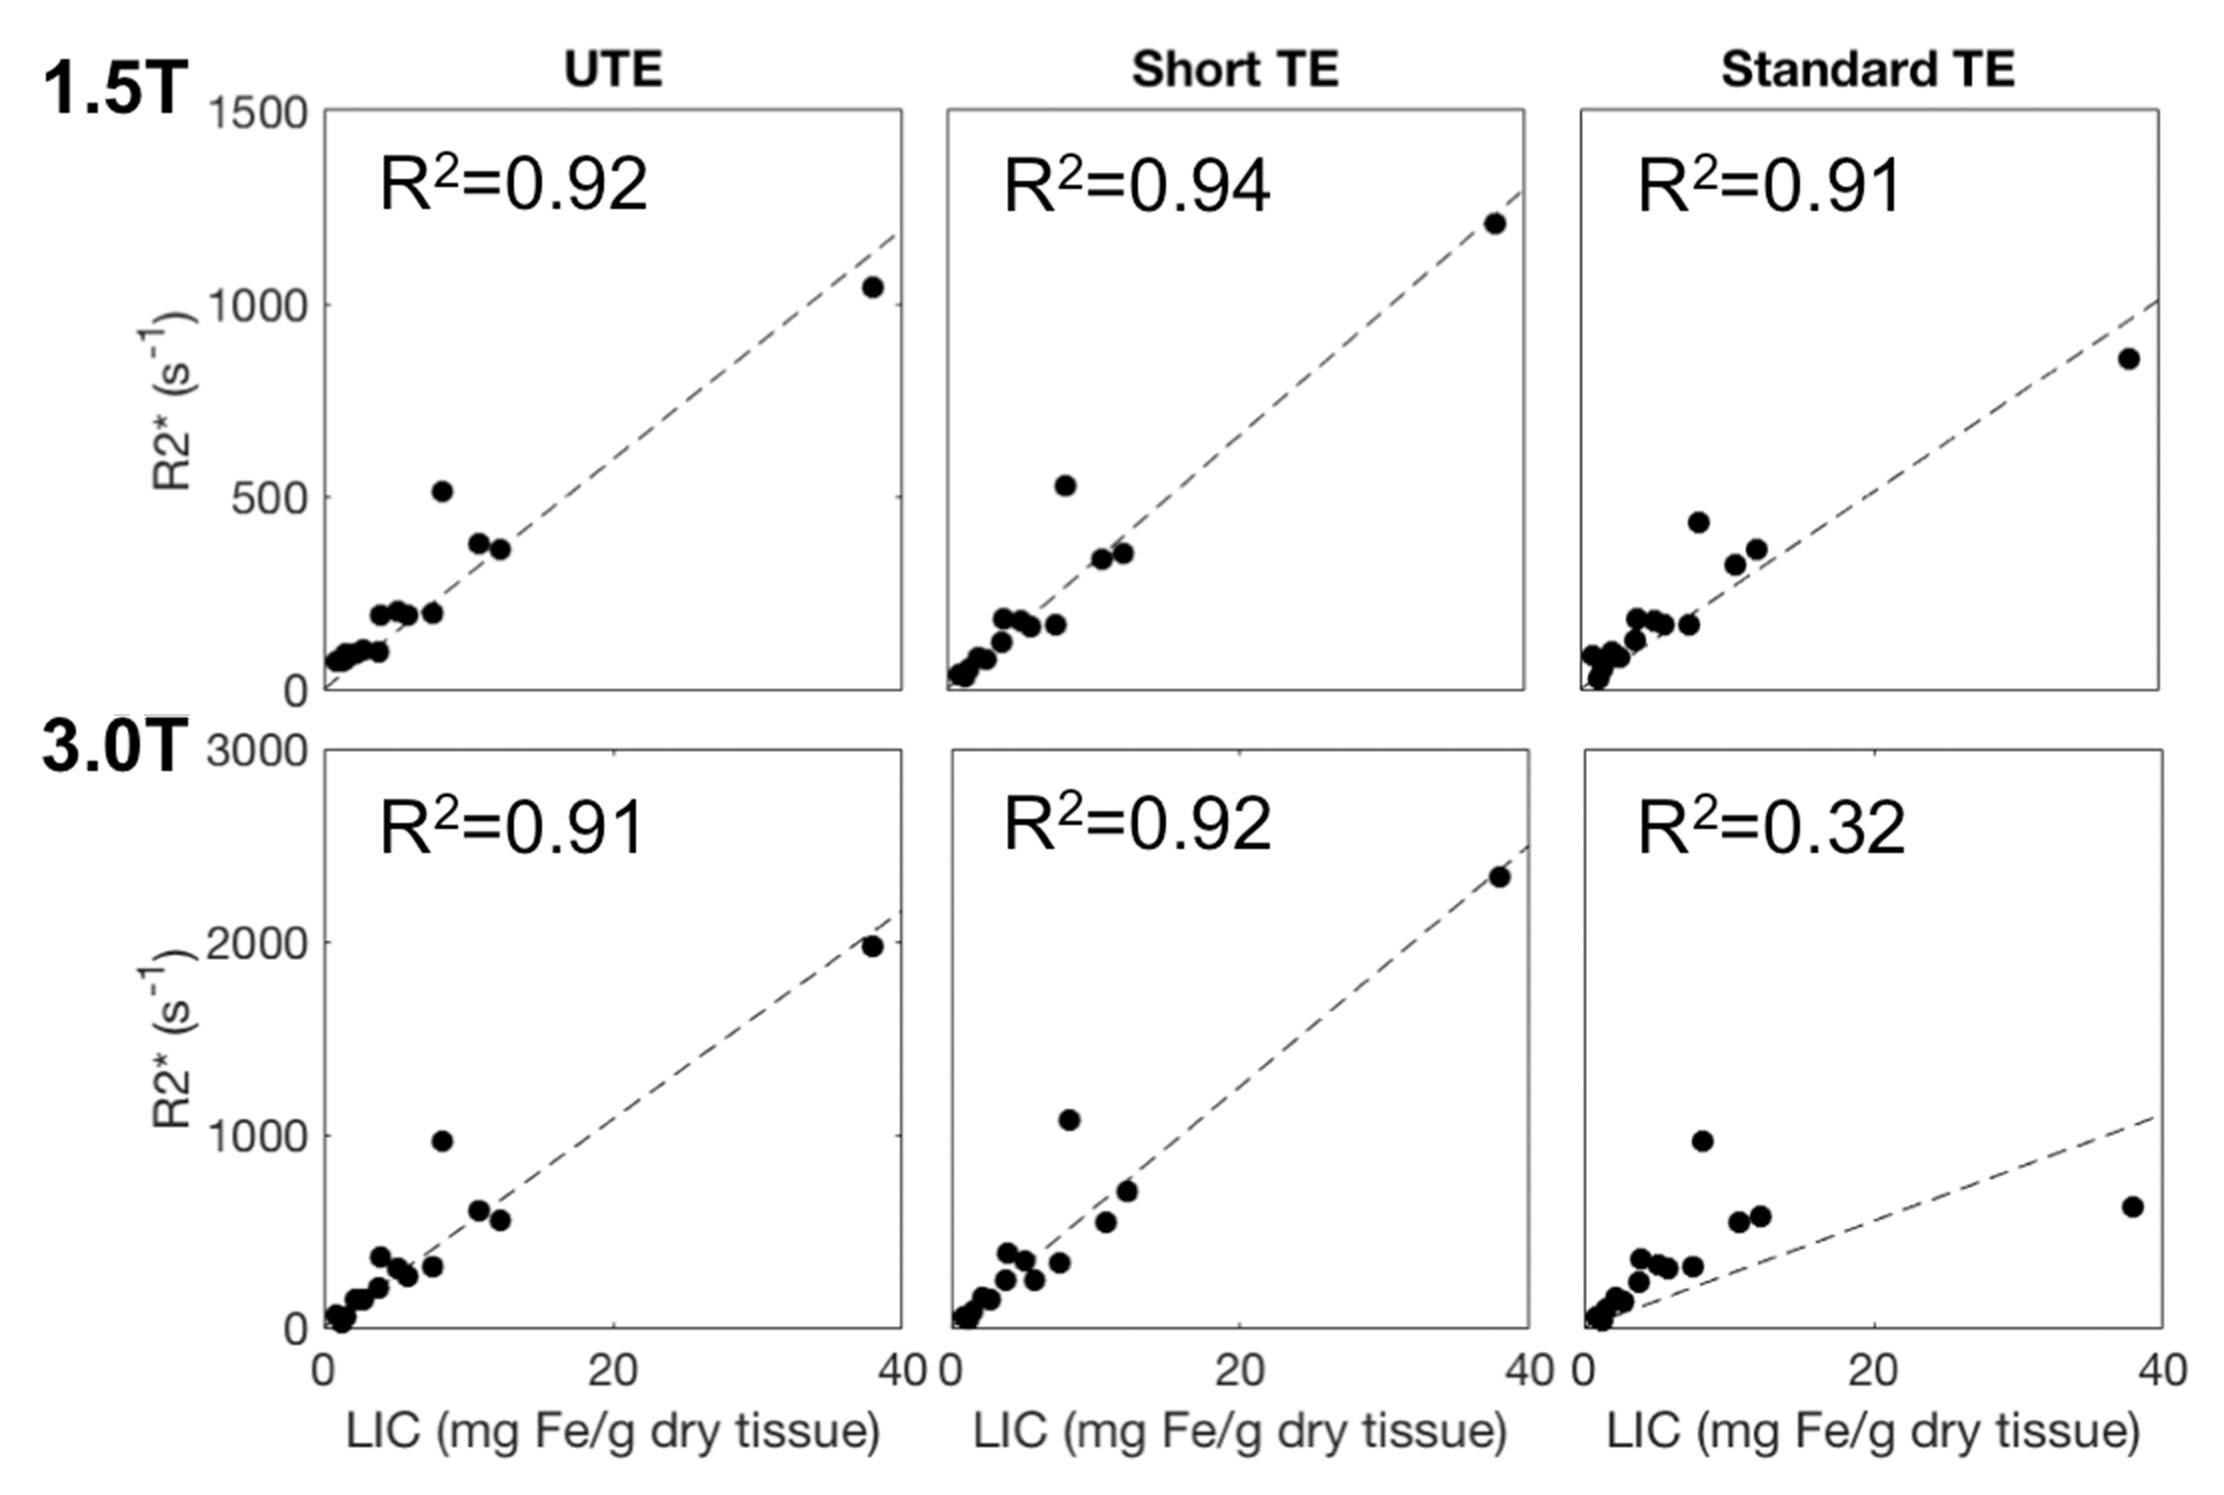
R2* measurements in each MRI protocol was compared to the R2-based LIC from FerriScan. Figure 4 shows plots of the R2* using UTE and Cartesian (short TE and standard TE) versus LIC as measured by FerriScan at both 1.5T and 3.0T. Strong correlations was observed between R2* measures at both field strengths using all acquisitions and LIC. In one case of high iron concentration, FerriScan was unable to estimate the LIC and was excluded from Figure 4.
Discussion
Although preliminary, the results shown suggest that the use of UTE-R2* mapping does increase the range of LIC that can be characterized beyond what is compatible with Cartesian approaches. Furthermore, a small bias in the UTE protocol was observed at low R2* values which led to a deviation from the expected slope of 2.0. This likely arose from the short maximum echo times used in the UTE protocol, which made making accurate measurements of low R2* values difficult. Further optimization of the TEs in UTE protocol, i.e. extending the maximum echo time, is expected to improve the reproducibility at low R2* values.
This study had several limitations, including the small number of subjects with extreme iron overload. More subjects with extreme iron overload are needed to further validate the increased dynamic range for R2* mapping using UTE.
Conclusions
R2* mapping using UTE imaging is reproducible across different field strengths in subjects with iron overload. Preliminary results suggest that the range of LIC that can be measured is greater using UTE imaging when compared to Cartesian approaches.Acknowledgements
The authors acknowledge the support of NIH (R01DK083380, R01DK088925, R01DK100651, K24DK102595), NSERC, and GE Healthcare.References
1. Wood JC, Enriquez C, Ghugre N, Tyzka JM, Carson S, Nelson MD, Coates TD. MRI R2 and R2* mapping accurately estimates hepatic iron concentration in transfusion-dependent thalassemia and sickle cell disease patients. Blood. 2005;106:1460-1465.
2. Doyle EK, Chia JM, Wood JC. Iron overload quantification using UTE Imaging at 3T. ISMRM 2016. 0359.
3. Krafft AJ, Loeffler RB, Song R, McCarville ME, Robson MD, Jankins JS, Hillenbrand CM. Quantitative Ultra-short Echo Time Imaging for Massive Iron Overload Assessment: A Way to Make It Happen. ISMRM 2015. 0087.
4. Hernando D, Kellman P, Haldar JP, Liang ZP. Robust Water/Fat Separation in the Presence of Large Field Inhomogeneities Using a Graph Cut Algorithm. 2010;63:79-90.
Figures