0370
Assessment of Nonalcoholic Fatty Liver Disease (NAFLD) Activity Score (NAS) with MR Elastography (MRE)1Radiology, Mayo Clinic, Rochester, MN, United States, 2Gastroenterology and Hepatology, Mayo Clinic, Rochester, MN, United States, 3Anatomic Pathology, Mayo Clinic, Rochester, MN, United States
Synopsis
To investigate the utility of a hepatic imaging protocol “hepatogram”, which includes multi-parametric MR Elastography (MRE) and fat fraction assessment, in predicting nonalcoholic fatty liver disease (NAFLD) activity score (NAS: 0-8). In both preclinical and clinical subjects with histology-proven NAFLD, generalized linear models of liver stiffness, damping ratio and fat fraction successfully distinguished each NAS score with excellent accuracy (AUROC>0.89 for all). Misclassifications in distinguishing steatohepatitis (NAS≥3) from NAFLD (NAS<3) was only 2/64 mice and 3/51 human subjects. Our findings indicate the hepatogram imaging protocol can predict NAS score and may be useful to monitor NAFLD disease progression and regression.
Purpose
The diagnosis of nonalcoholic fatty liver disease (NAFLD) and steatohepatitis (NASH) is defined by the presence and pattern of specific histological abnormalities on liver biopsy. A semi-quantitative scoring system called NAFLD Activity Score (NAS) – the unweighted sum of steatosis, lobular inflammation, and hepatocellular ballooning scores – was developed as a tool to diagnose NASH or measure changes in NAFLD during therapeutic trials. NAS of ≥5 correlates with a diagnosis of “definite NASH”, 3≤NAS<5 are “borderline NASH”, while NAS<3 are diagnosed as “not NASH”. The purpose of this study is to noninvasively predict NAS score and distinguish NASH from NAFL in an in vivo mouse model and a pilot patient population, using our predictive model with three imaging biomarkers acquired with a hepatogram imaging protocol.Materials and Methods
All activities related to animal and human subjects were reviewed and approved by our institutional animal care and use committee (IACUC) and institutional review board (IRB) respectively. Multifrequency 3D MRE (80-200Hz) [1] and 2-point Dixon imaging were performed on 64 mice in vivo. Complete histologic analyses have been obtained after their euthanization, including 36 NAFLD/NASH male mice fed a fast food diet and fructose water and 28 control male mice fed regular chow and water supply. Multifrequency 3D MRE (30, 40, 60Hz) and IDEAL-IQ examinations (i.e., “hepatogram”) were performed on 38 NAFLD/NASH patients within one week of their bariatric surgery and liver biopsy. 13 normal healthy volunteers had hepatogram imaging only without liver biopsy.
For both preclinical and clinical models, MRE gave an output of complex shear modulus, from which one can derive liver stiffness, storage modulus, loss modulus and damping ratio at multiple mechanical frequencies. Fat fraction was either calculated with a 2-point Dixon or an IDEAL-IQ method. Pairwise comparisons (nonparametric Dunn method for joint ranking) were performed for the mean values of liver stiffness, damping ratio, loss modulus and fat fraction among different stages/grades of fibrosis, inflammation, ballooning and steatosis. Logistic models were used to evaluate the effect likelihood with subsequent ROC analyses. Generalized linear regression predictive models were also tested assuming a continuous NAS output. Ceiling operations were used to predict NAS score for NASH classifications. For all statistical analysis, a significance level of less than 0.05 was used.
Results
We selected one mechanical quantity from its optimal working frequency for further statistical analyses (e.g., liver stiffness at higher frequency, damping ratio or loss modulus at lower frequency). As shown in Figures 1-3, most selected hepatogram parameters were positively associated with three NAS elements and fibrosis stage. As summarized in the table of Figure 4, most parameters demonstrated significant differences between F0/I0/B0/S0 and moderate to severe extent of fibrosis, inflammation, ballooning and steatosis. Damping ratio only detect moderate inflammation in the animal model, but not sensitive to other pathophysiologic statuses. As shown in the images of Figure 4 and charts (c, d) of Figure 1, when comparing with normal volunteers, we observed substantially elevated damping ratio and loss modulus in NAFLD patients, even without histologically detectable inflammation in some patients.
Logistical predictive models were first tested regarding to an ordinal NAS output. For each NAS score, no less than 0.89 AUROCs were achieved for both animal and human studies. Predicted continuous NAS values were illustrated for mice in Figure 5(b) and humans in Figure 5(d) respectively. NASH classifications were performed by taking ceilings of the continuous predicted NAS output. Only a few false positive misclassifications were observed – two failures in 64 mice, three failures in 51 humans – as shown in the colored block areas in (b) and (d).
Discussion and Conclusion
Regression results of our prediction models are very successful. All the tested three predictors (μ, ζ, FF or μ, G’’, FF) have significant effects on the outcomes (p<0.05). The NAS score is the unweighted sum of three numeric values that are subjectively assigned by the pathologist for steatosis, inflammation and cellular ballooning. Therefore, the linear predictive formula is very straightforward and easy to understand, assuming each of the predictors is the associated response to each of the NAS features (i.e., μ -ballooning, ζ/G’’-inflammation, FF- steatosis). The misclassifications (false positive failures) can be explained by: 1) histologically-assessed NAS score is subjective and has potential sampling errors; 2) the method adopted in our preclinical study can cause local ischemia and acute inflammation in the liver tissue; 3) normal volunteers may have undiagnosed liver disease; 4) limited sampling size in severe NASH. Further model parameter optimization is needed with more clinical data. We also expect a slightly more sophisticated statistical model may improve the prediction accuracy.Acknowledgements
This work has been supported by NIH grants EB017197 and EB001981.References
1. Yin, M., et al. Advanced assessment of liver diseases with magnetic resonance elastography in animal models. in International Society for Magnetic Resonance in Medicine. 2015. Toronto, Canada.Figures
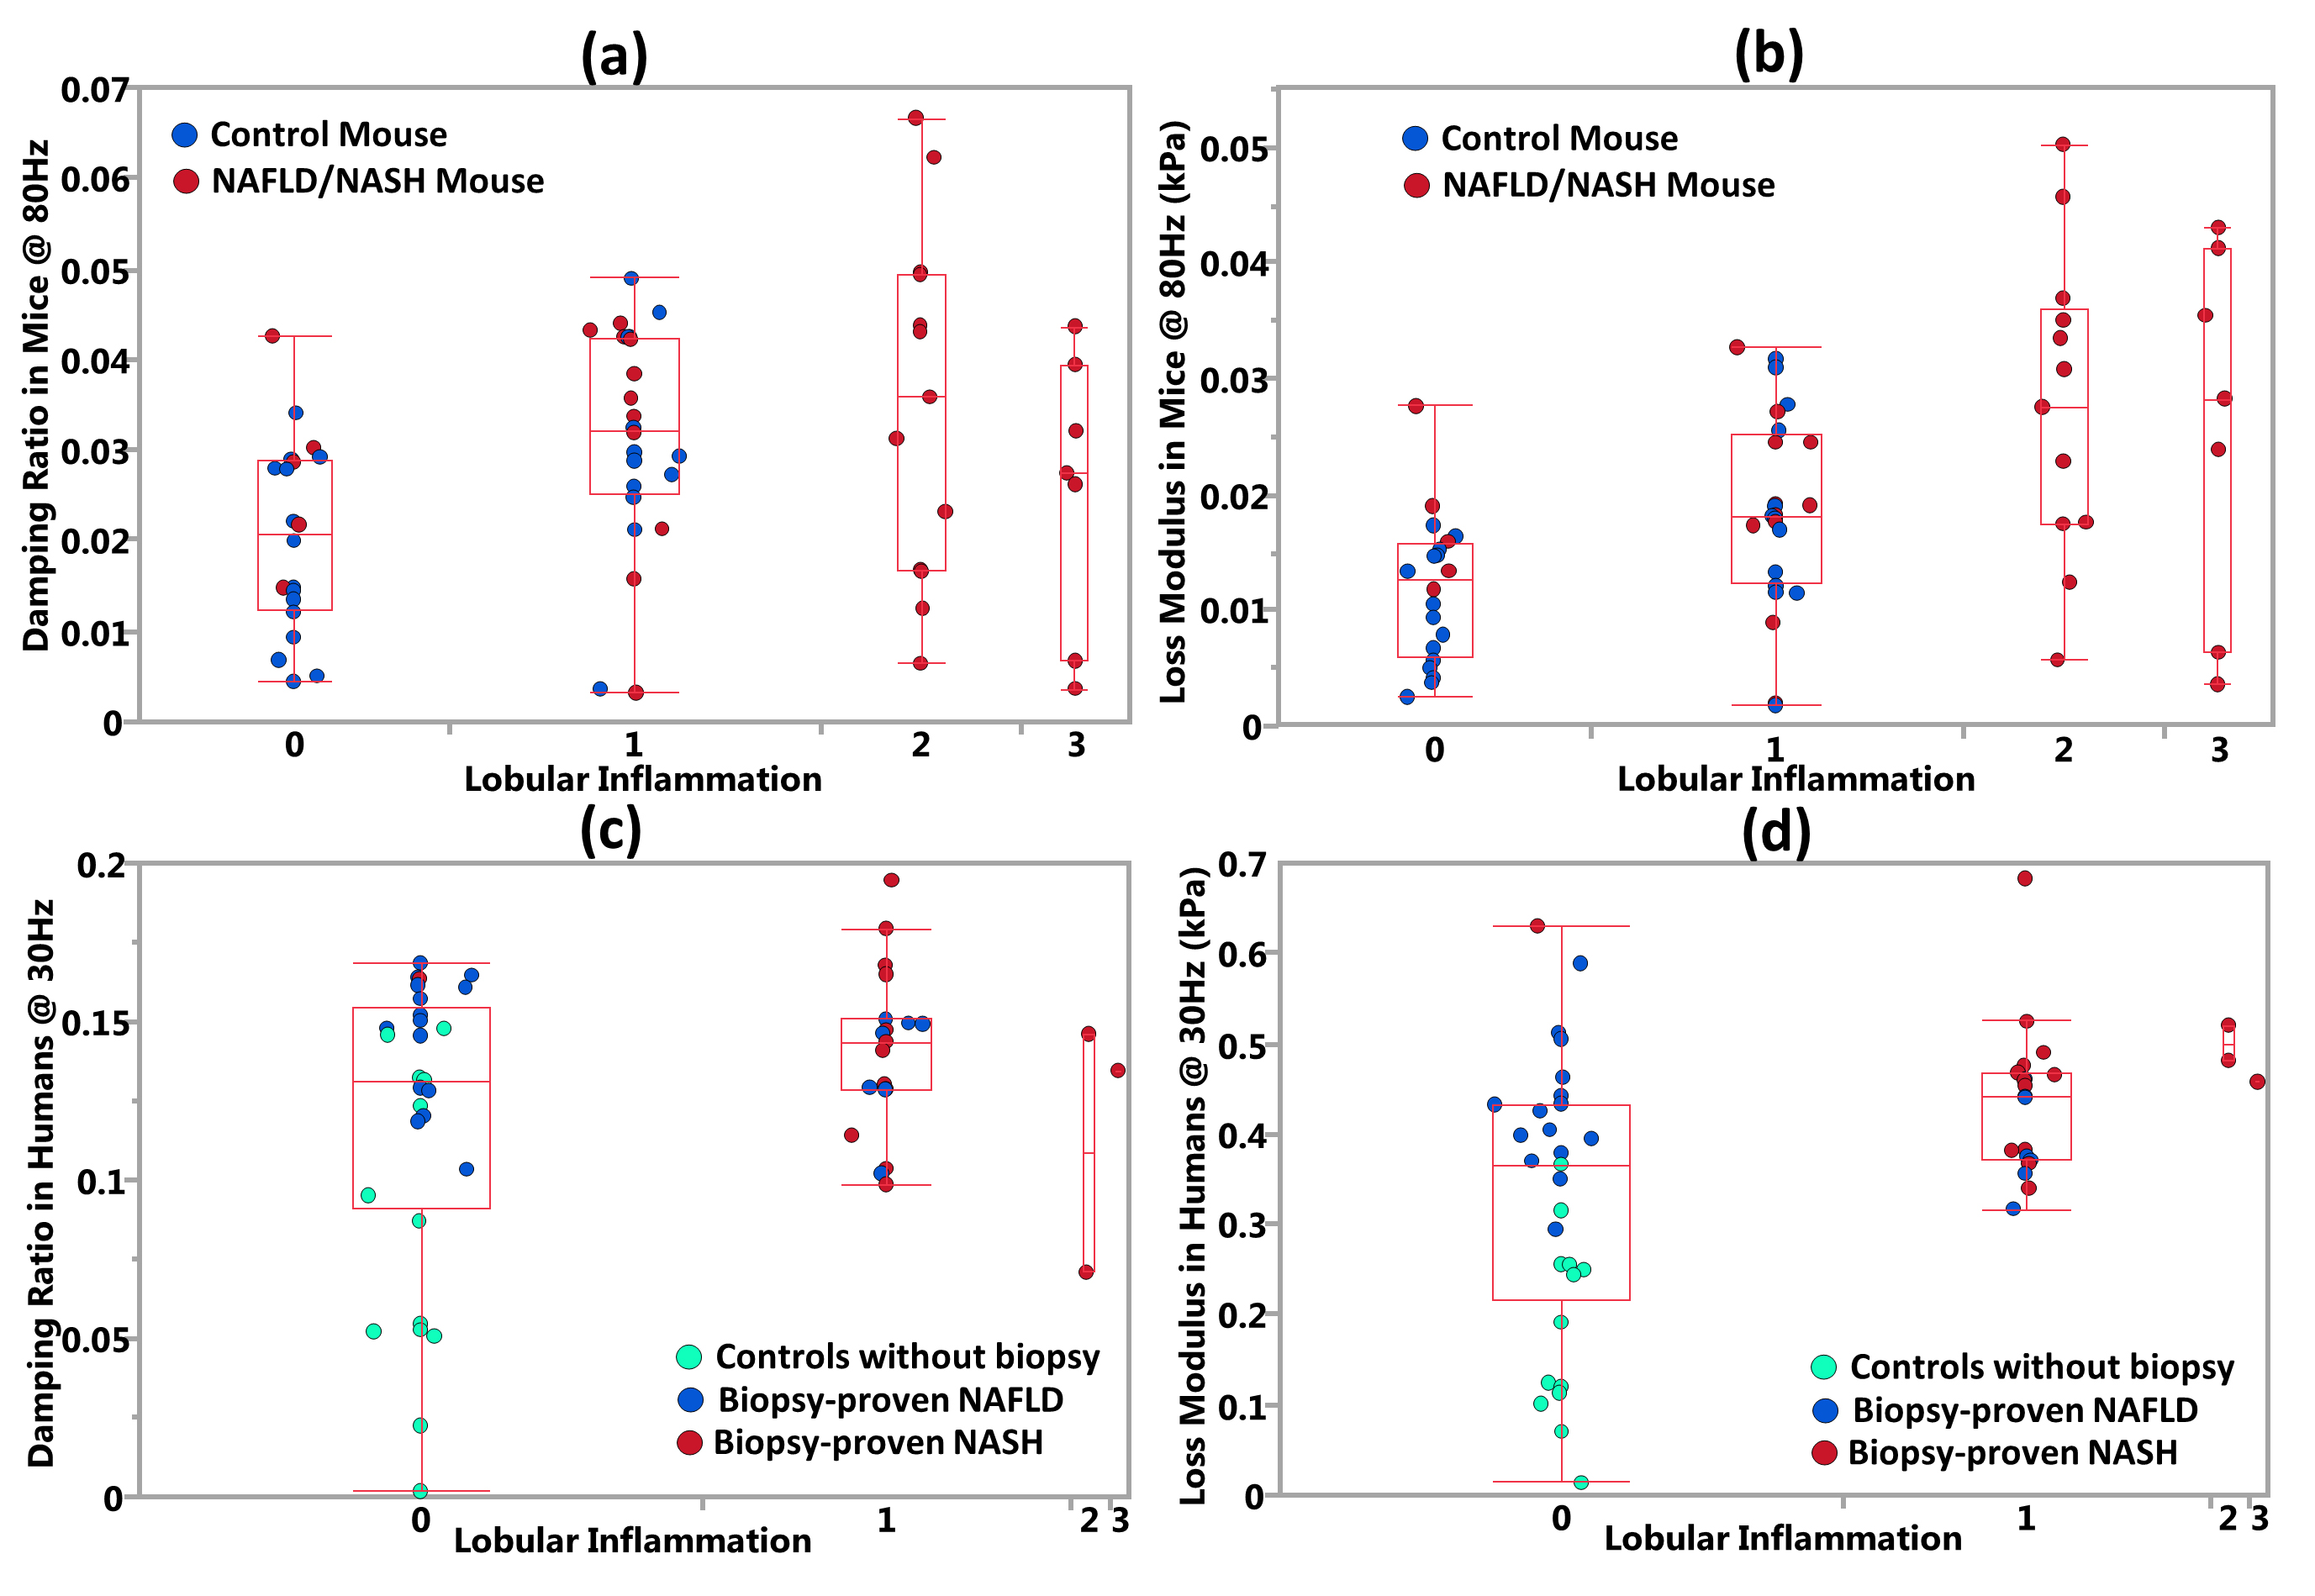
Figure 1 – Damping ratio and loss modulus vs. lobular inflammation.
Charts (a) and (b) show progressively elevated mean damping ratio and loss modulus with increased lobular inflammation in mice. Some controls have mild lobular inflammation, which may due to invasive MRE examination[1]. Charts (c) and (d) did not show substantial change in the mean damping ratio and loss modulus between different inflammation grades in the human studies. However, most controls have substantially lower damping ratio and loss modulus than any of NAFLD/NASH patients, even those NAFLD patients without histologically observable inflammatory cellular invasion (i.e., I0 – inflammation grade 0).
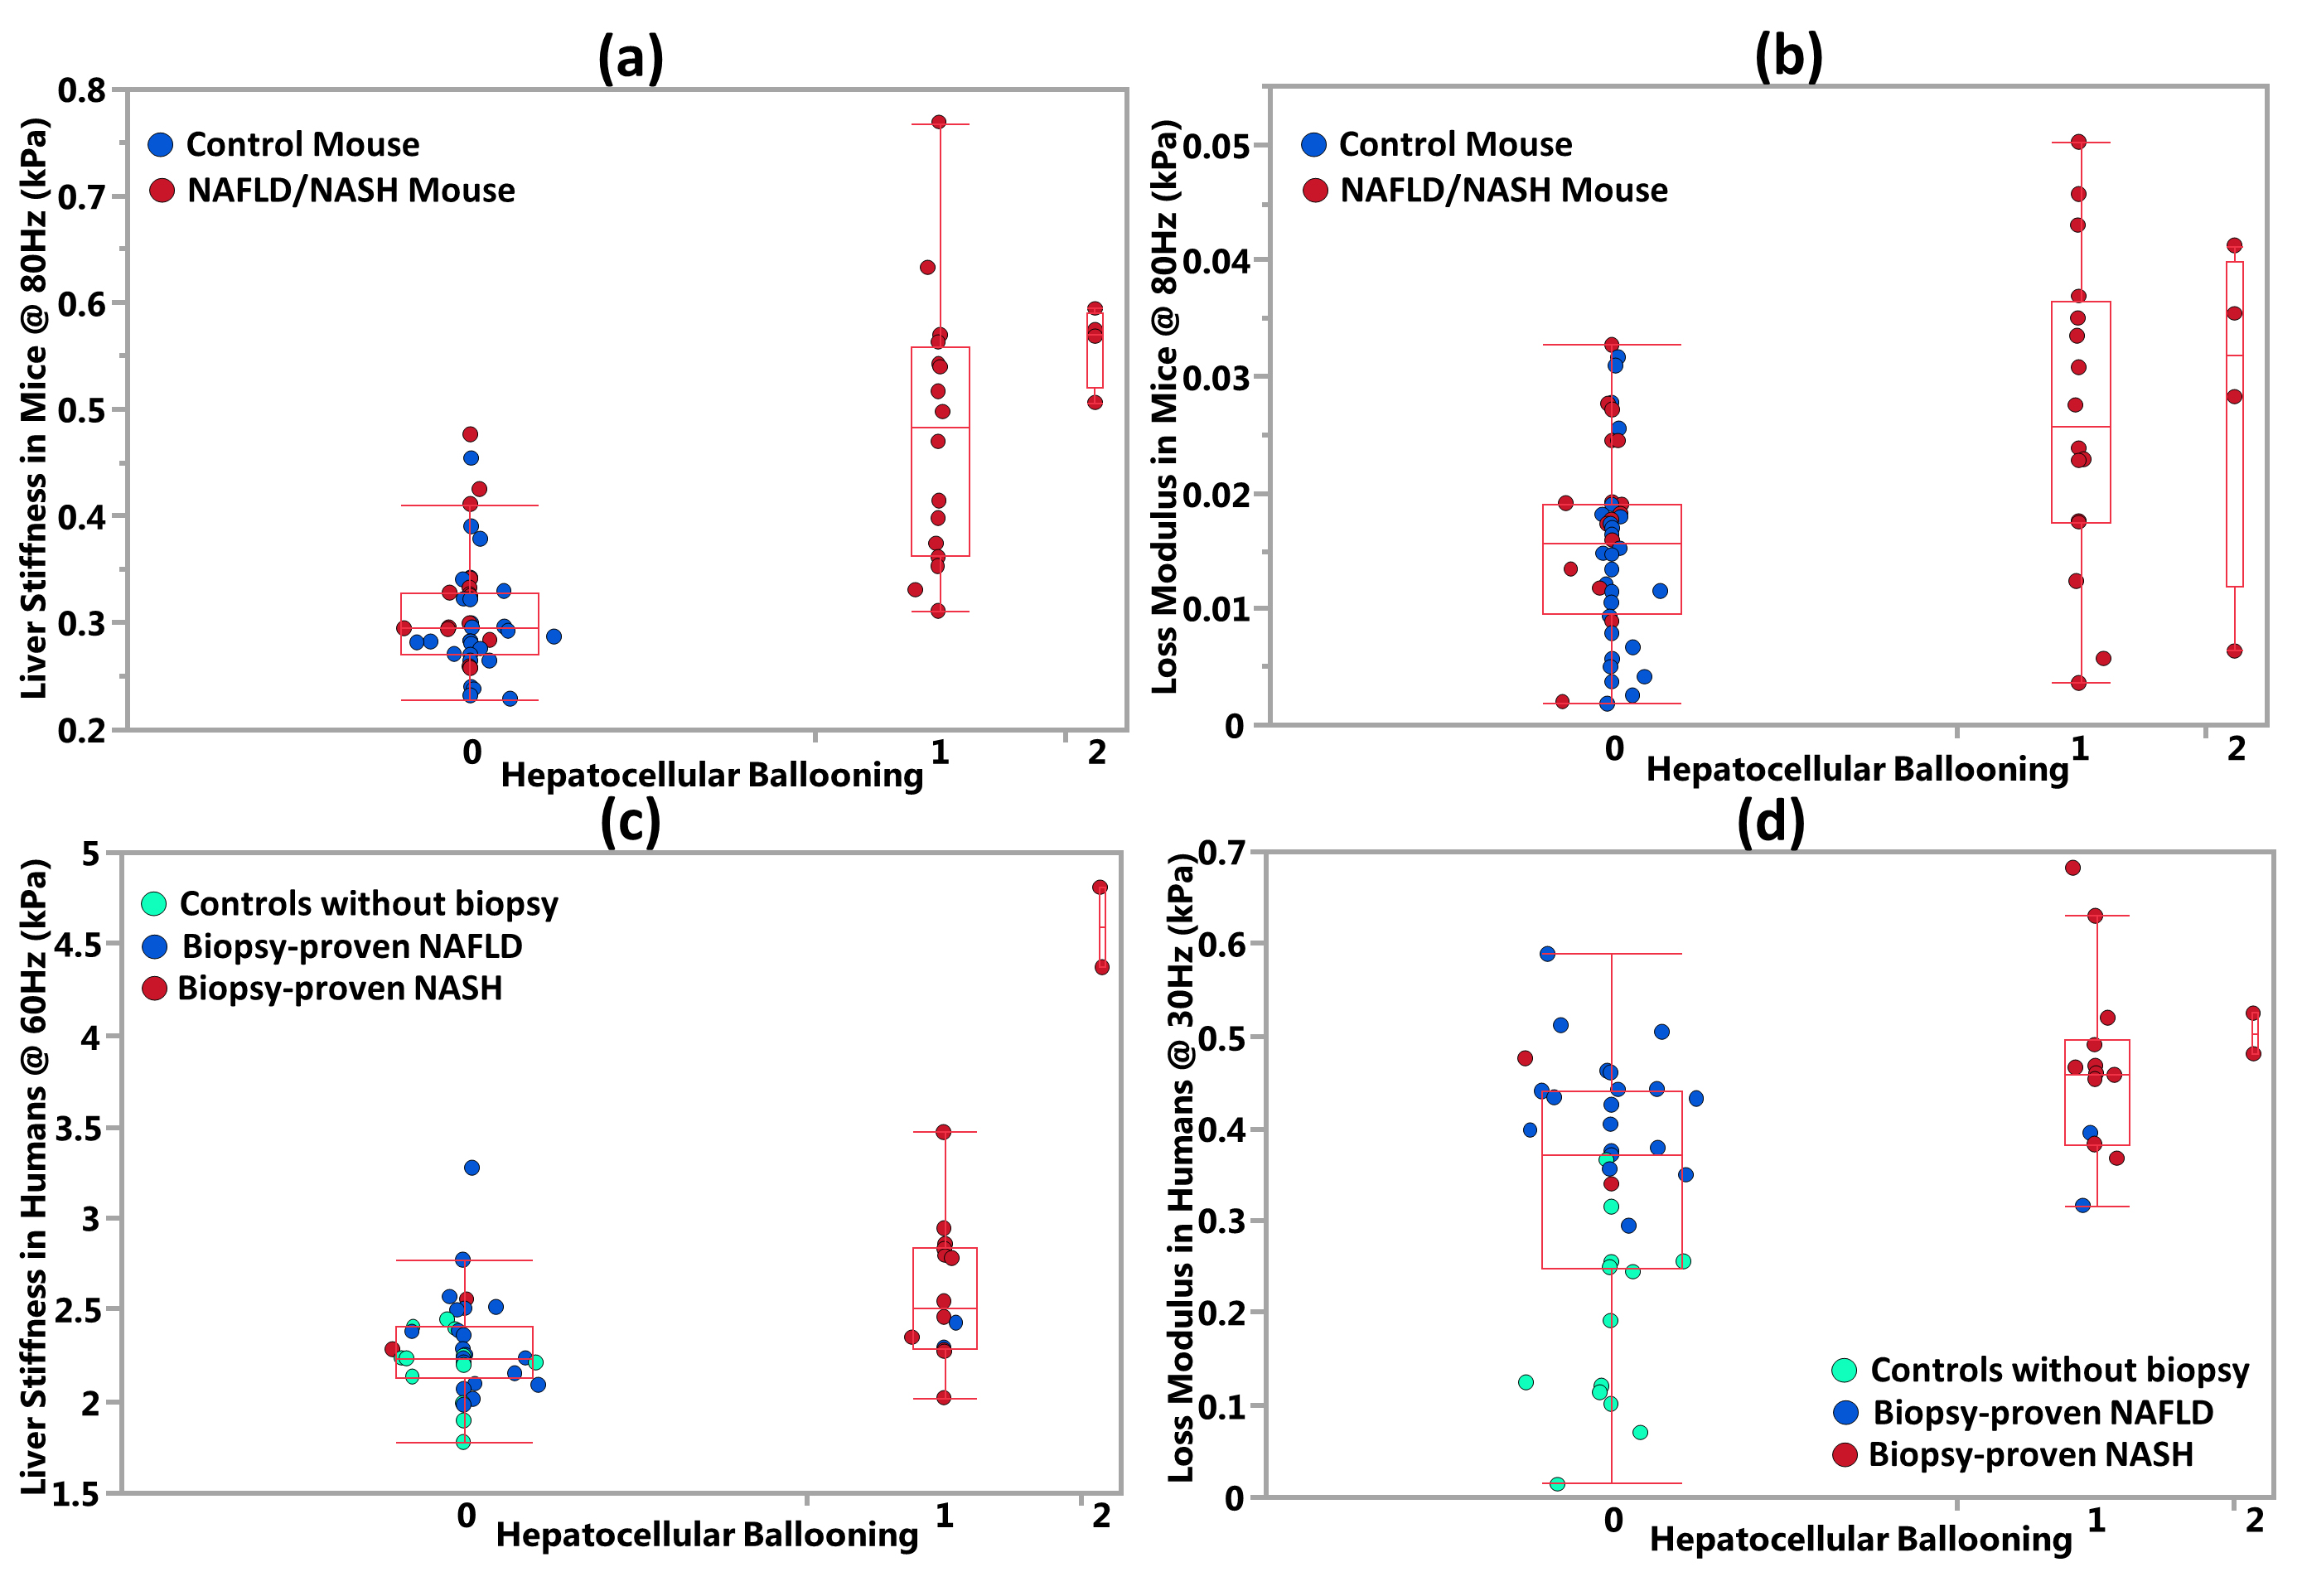
Figure 2 – Liver stiffness and loss modulus vs. hepatocellular ballooning.
Charts (a) (c) and (b)(d) demonstrate that both mean liver stiffness and loss modulus elevated significantly with emerging hepatocellular ballooning in animal and human subjects respectively. However, we did not have sufficient sampling size for ballooning grade of 2. This may lead to some insignificant findings.
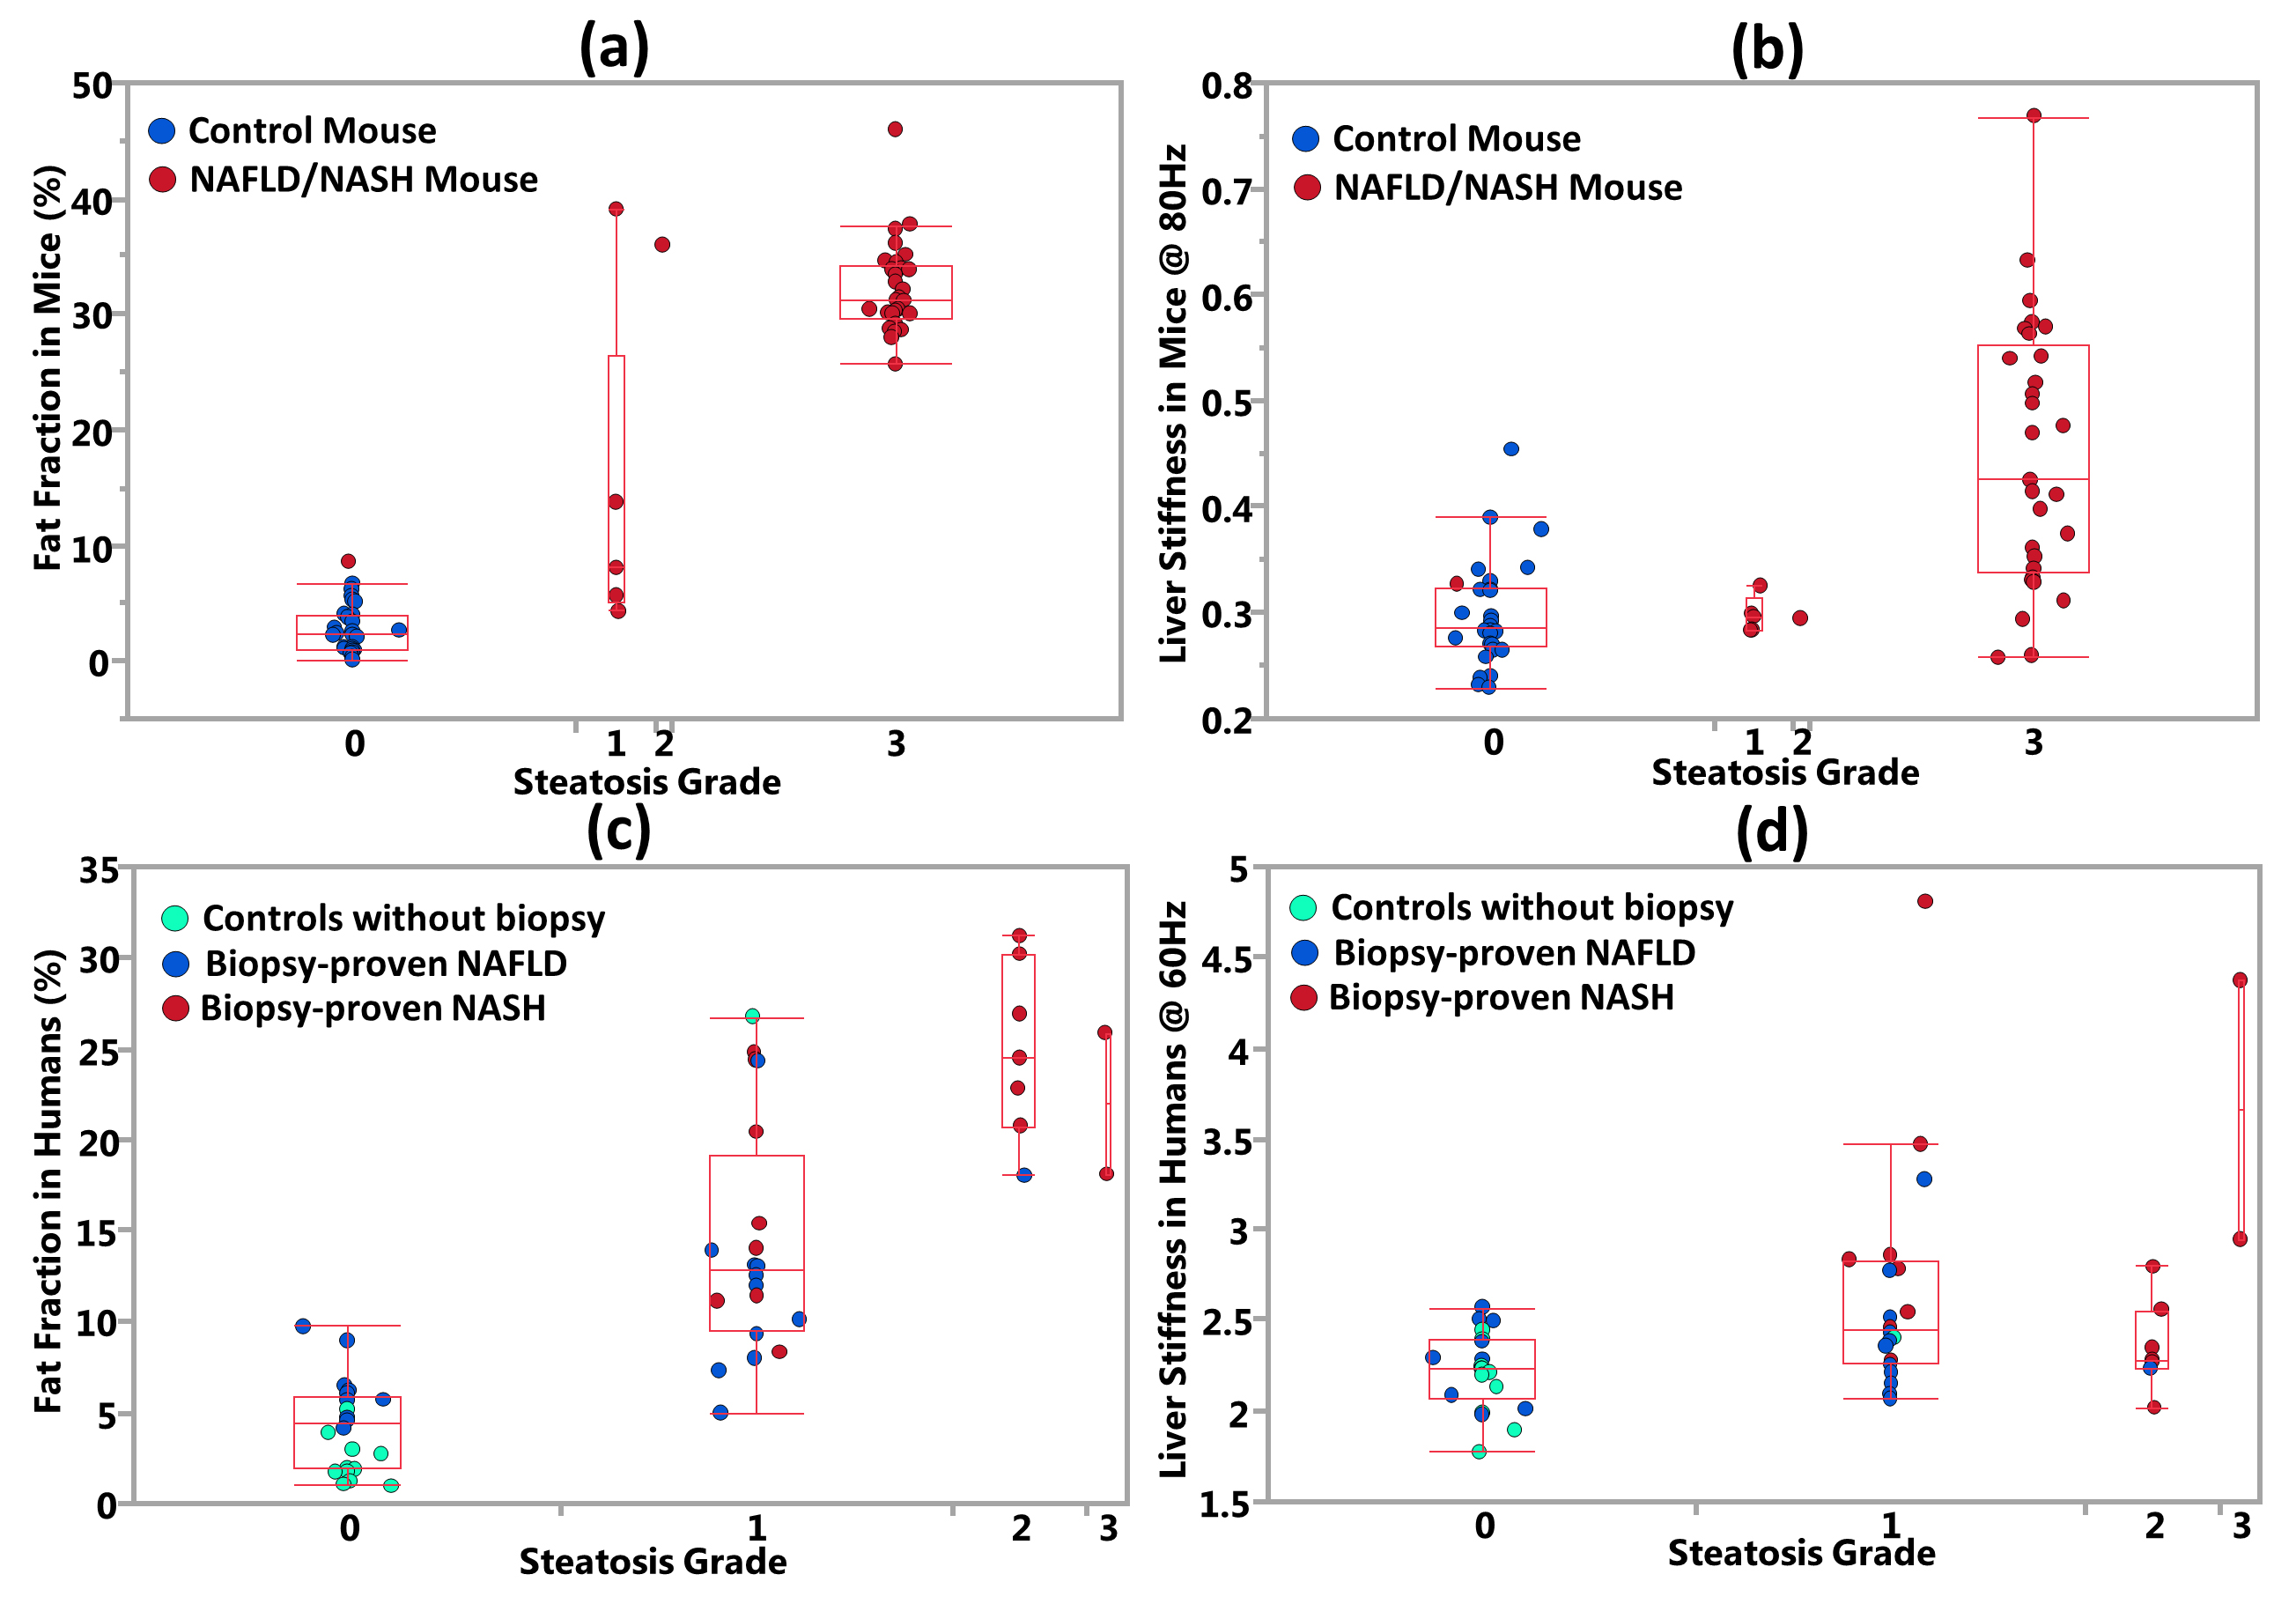
Figure 3 – Fat fraction and liver stiffness vs. steatosis.
Charts (a) and (c) demonstrate that fat fraction increased progressively with steatosis grade. Charts (b) and (d) show that many subjects with increased steatosis grade also tend to have elevated liver stiffness. However, the relationship became much weaker in human subjects compared to the animal model. We did not achieve sufficient sampling size for steatosis grade of 2 in mice and 3 in humans. This may lead to some insignificant findings.
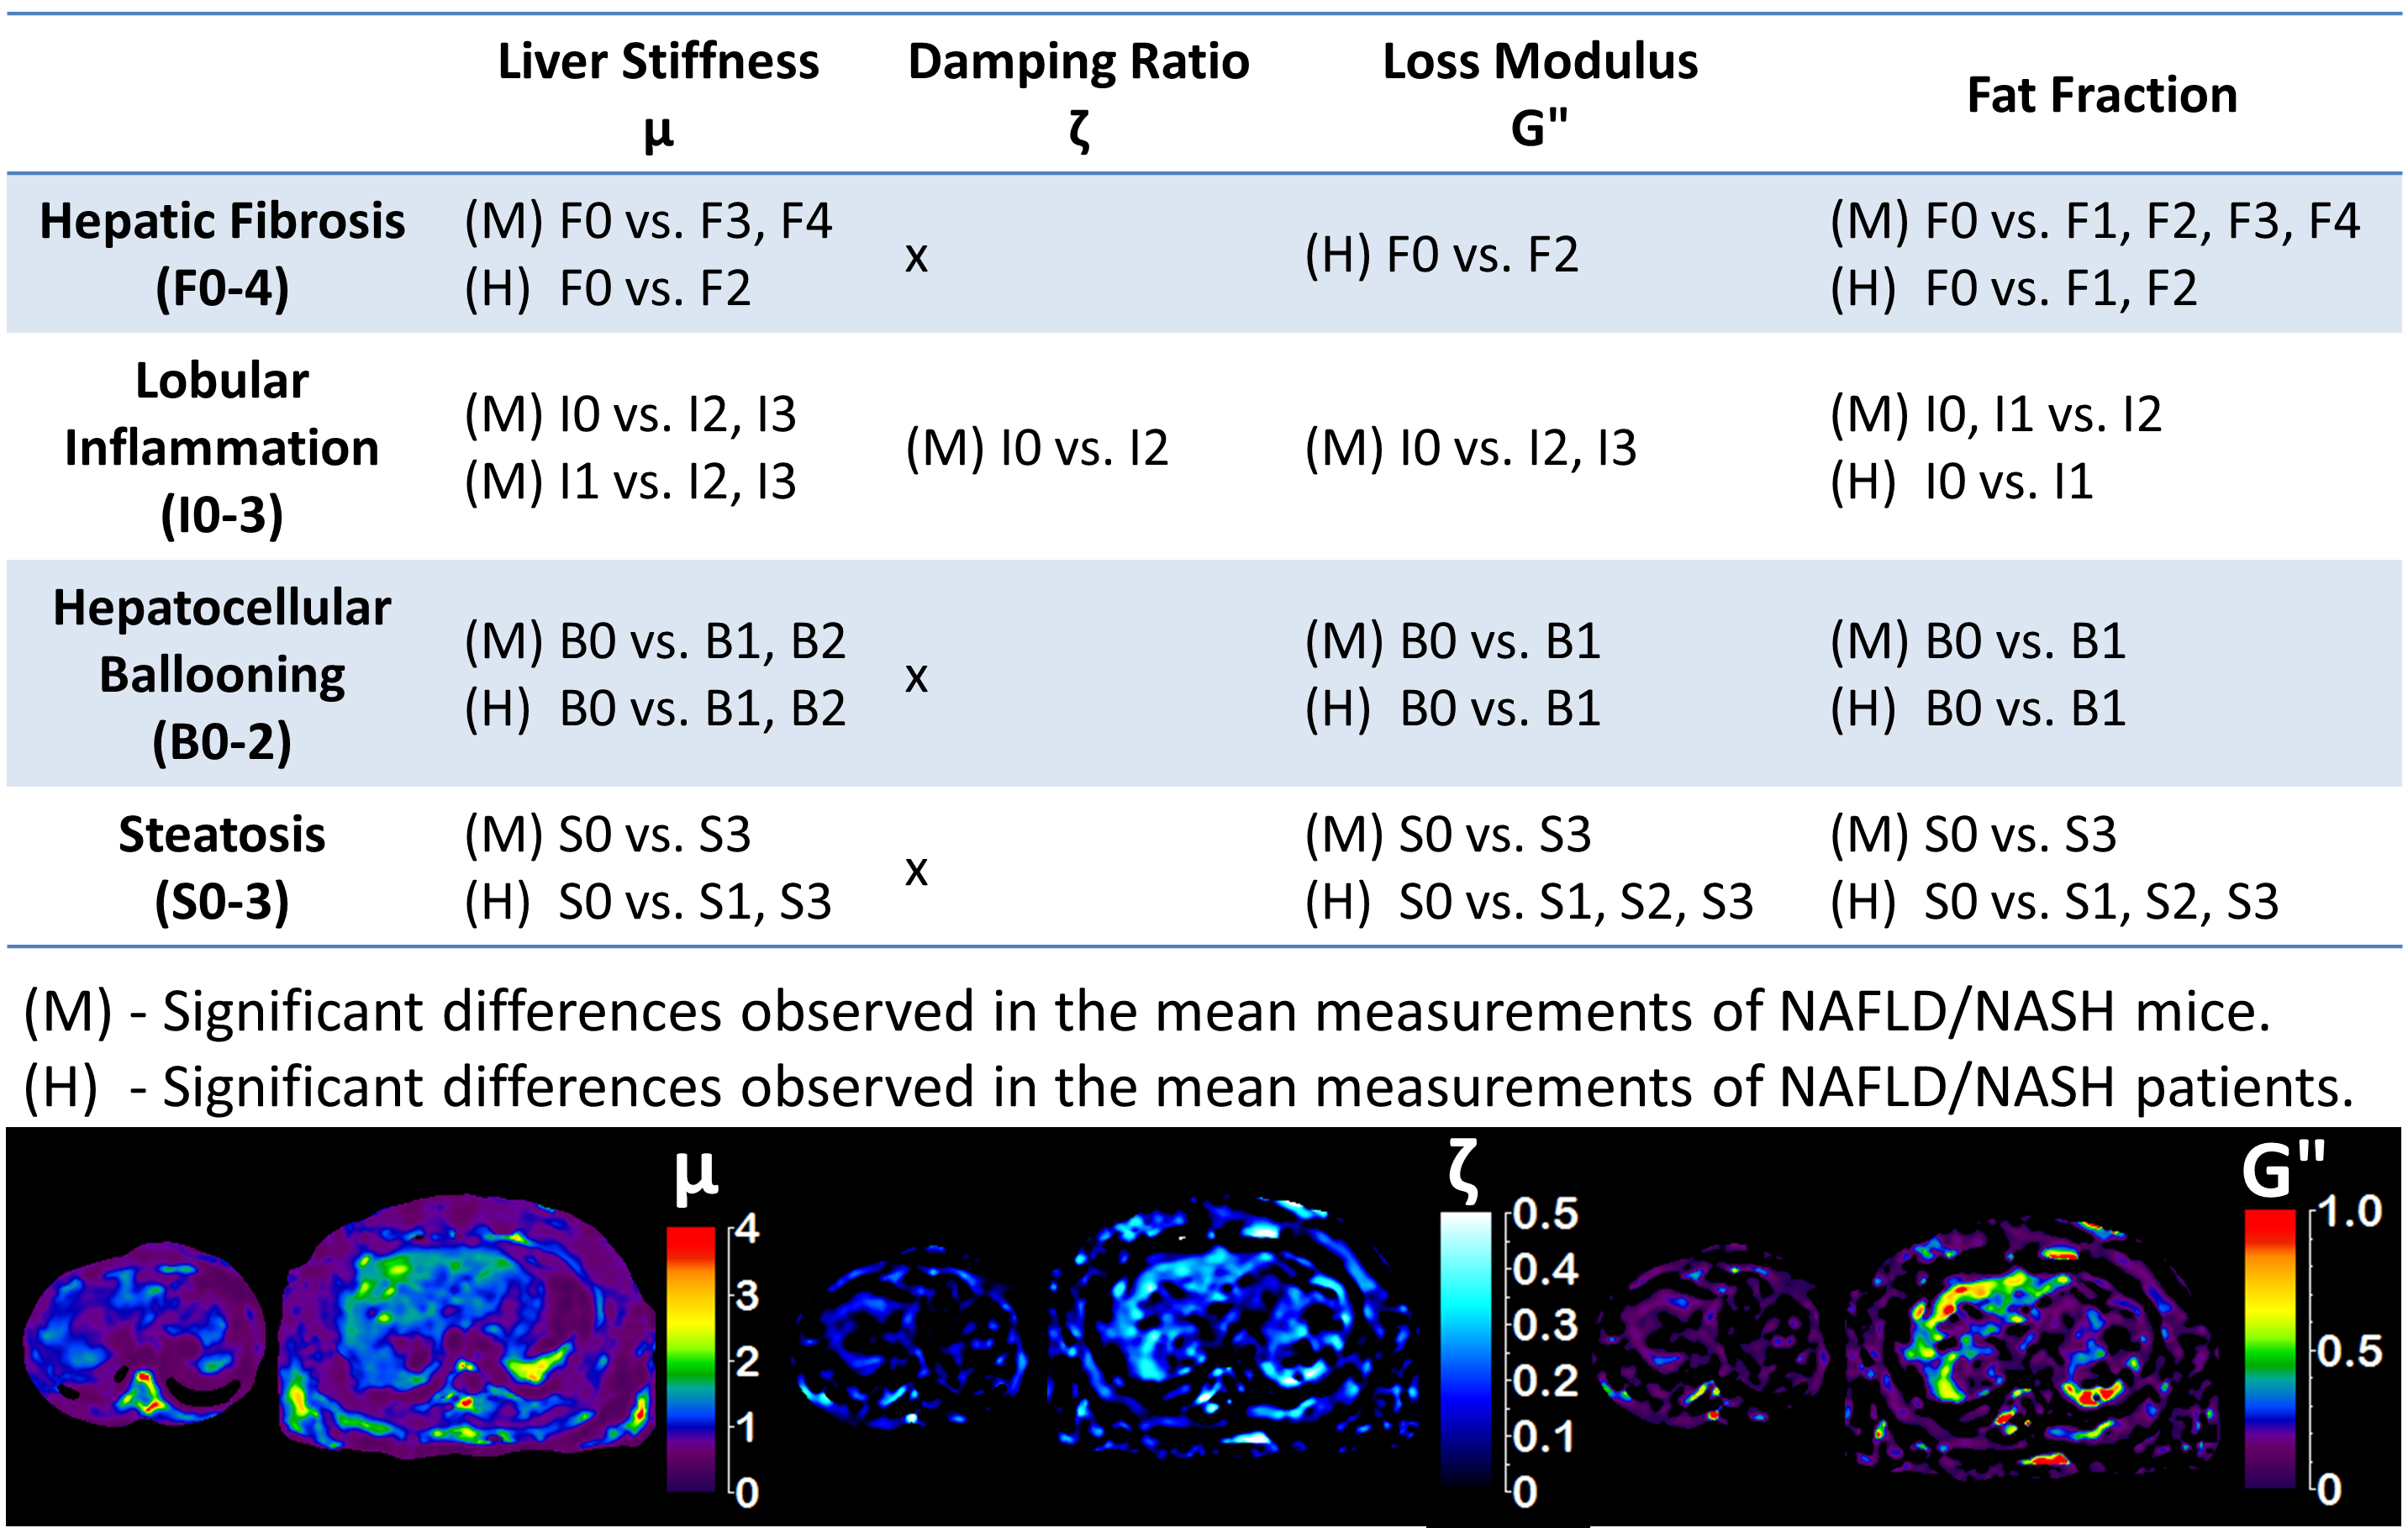
Figure 4 – Summary of nonparametric pairwise comparisons of four hepatogram parameters.
Pairwise comparison results with significant differences (p<0.05) were listed in the table. F, I, B and S are labels for fibrosis, inflammation, ballooning and steatosis respectively. The numbers (e.g., F0,I1,B0,S0) indicate numerical stages/grades assigned by pathologist. At the bottom of this figure, maps of liver stiffness (μ), damping ratio (ζ) and loss modulus (G’’) of a normal volunteer (left, small size, F0,I0,B0,S0) and a biopsy-proven NAFLD patient (right, big size, F0,I0,B0,S1) were also shown. All quantities of μ, ζ, and G’’ substantially elevated in this NAFLD patient with mild steatosis, even without histologically detectable inflammation, ballooning and fibrosis.
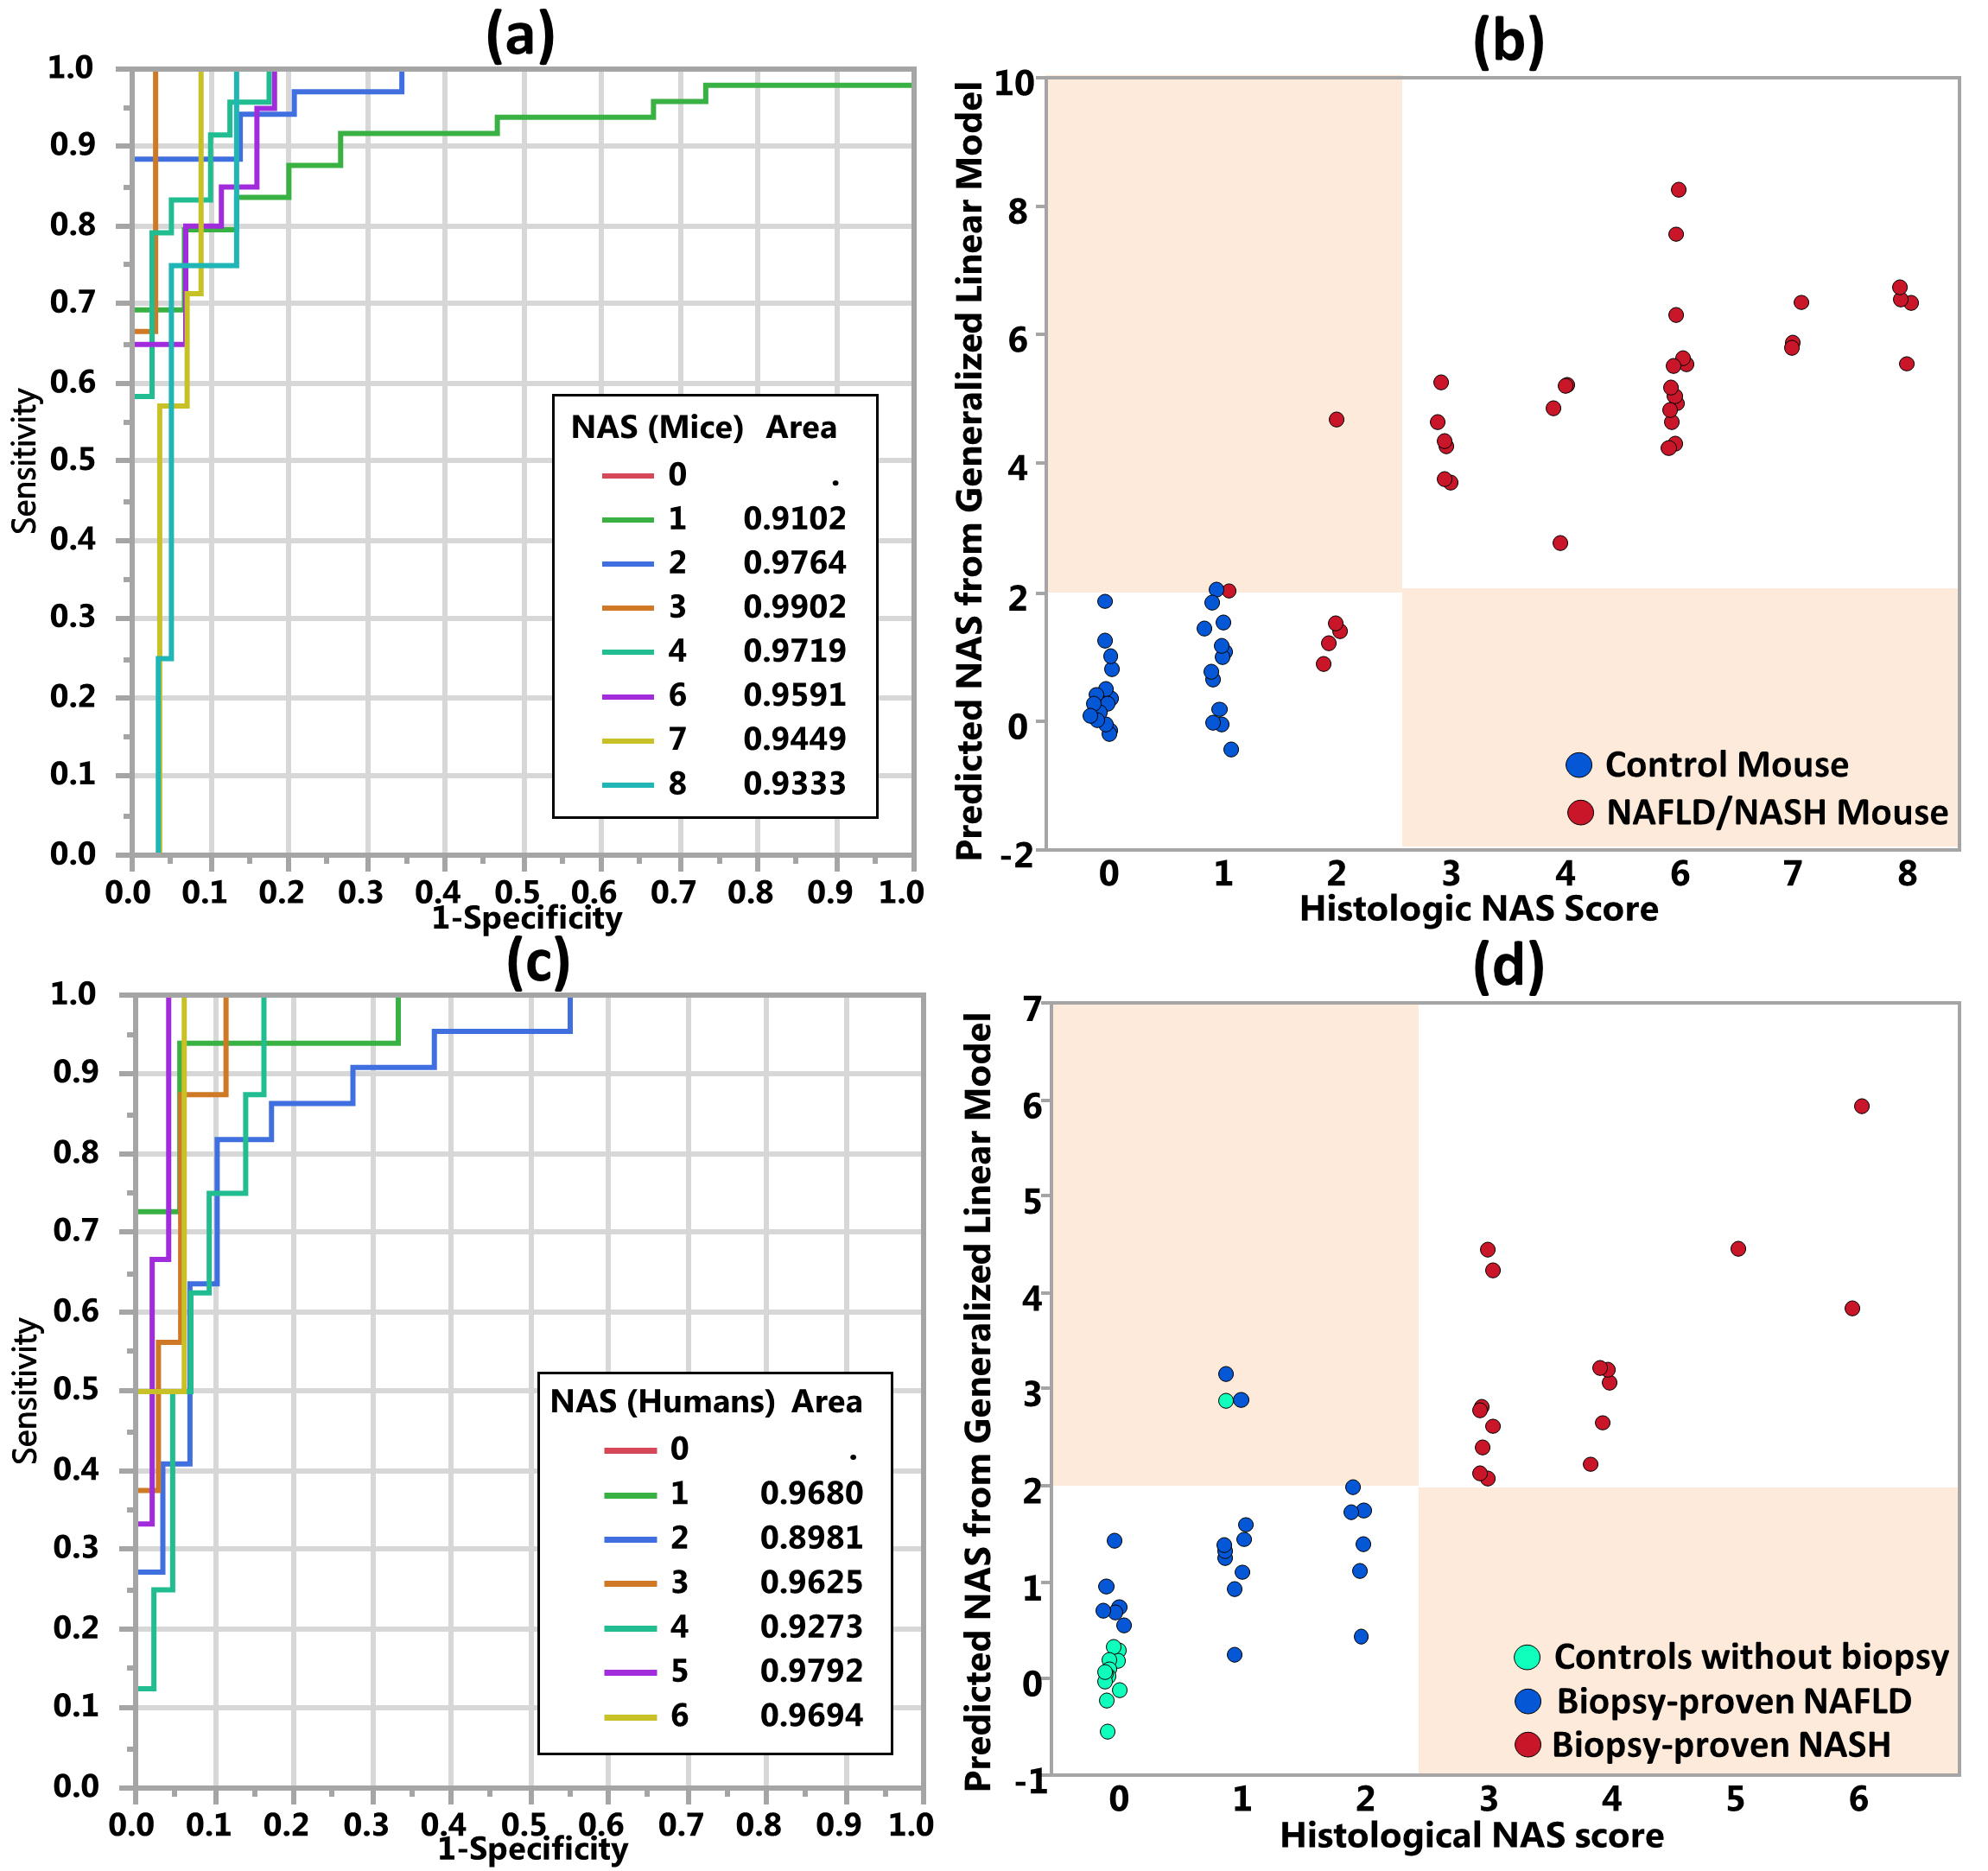
Figure 5 – ROC analyses of NAS prediction and NASH classifications with three hepatogram parameters.
Charts (a) and (c) show ROC analyses of NAS score prediction with three hepatogram parameters in mice and humans respectively. Charts (b) and (d) demonstrate NASH classification plots with the prediction models. We labeled the subject as “NASH” if the predicted continuous variable is greater than 2 as NASH. Otherwise, we labeled the subject as “NAFL, not NASH”. Misclassification regions in charts (b) and (d) were marked with colored blocks. All misclassified cases fell into the colored blocks. They are false positive failures.