0367
Determining the T1 of the water in the liver by modelling the effects of fat, iron and off-resonance frequencies on MOLLI T1 measurements1University of Oxford Centre for Magnetic Resonance Research, University of Oxford, Oxford, United Kingdom, 2Oxford Centre for Diabetes, Endocrinology and Metabolism, University of Oxford, Oxford, United Kingdom, 3Translational Gastroenterology Unit, University of Oxford, Oxford, United Kingdom
Synopsis
The frequency dependence of balanced steady-state free precession signals causes significant alterations in modified Look-Locker inversion recovery T1 measurements of livers with fat accumulation, leading to either under- or over-estimation of liver T1 values. This is further to the already-known influence of iron. The present study shows a possibility to correct for these effects, yielding a T1 measurement that represents the T1 of the water component independent of the fat and is tested both in phantoms and human participants.
Purpose
The modified Look-Locker inversion recovery (MOLLI) T1 mapping sequence1 and its variants (e.g. shortened-MOLLI2) have been used both in cardiac and hepatic MRI3,4. However, due to the frequency dependence of balanced steady-state free precession (bSSFP) readouts employed by MOLLI, the T1 of a fatty liver may be over- or underestimated, depending on the TR of the readout, the field strength and off-resonance frequency5. We believe that it is the T1 of water that is the parameter of interest, therefore the aim of this study is to investigate the possibility of removing the effects of the fat signal in MOLLI T1 maps.
Methods
Phantoms: Fifteen phantoms were built by mixing peanut oil into water-agar gels containing 0.45mM, 0.73mM and 1.61mM of NiCl2 to obtain fat fractions (FF) of 0%, 5%, 10%, 20% and 30%6. Phantoms were scanned using a Trio Tim 3T scanner (Siemens, Erlangen, Germany). T1 of the water component was determined using a multiple-TR, multiple-TE STEAM MRS sequence7, MOLLI T1 maps were collected using shMOLLI and T2 of phantoms with FF=0% was determined using a multiple-contrast spin echo imaging sequence. Off-resonance frequencies were determined from multiple-echo GRE images where fat and water were in phase (TE=2.46, 4.92 ms). Phantoms were modelled with a two-compartment model, representing fat and water components. Separate bSSFP signals were simulated for both compartments at the measured off-resonance frequency using a Bloch-equation simulation of the shMOLLI sequence in MATLAB (The MathWorks, Natick, MA). Signals were then mixed to reflect FF of each phantom. Fat was modelled using six spectral peaks: chemical shifts, relative amplitudes, T1 and T2 values were determined from MRS spectra of a 100% peanut oil phantom. T2 of water was fixed and the T1 of water varied between 500 ms and 1600 ms. For each simulated water T1 water and fat signals were combined and compared to the measured bSSFP signal, by fitting them using $$$S_{simulated}=aS_{measured}$$$. The water T1 corresponding to the signal with the highest R2 was then used to simulate a water-only signal with 0% fat and on resonance to obtain the corrected signal which, fitted using the conditional shMOLLI fitting algorithm, yielded the corrected shMOLLI T1.
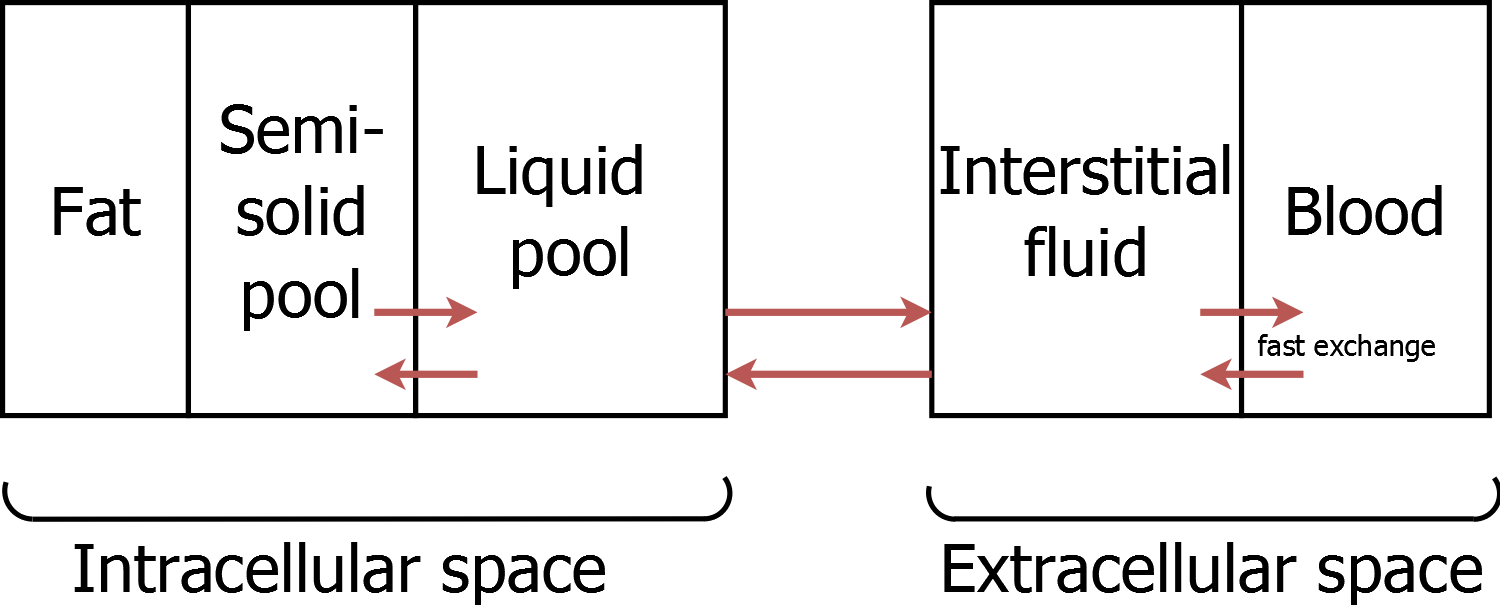
Patients: N=11 patients with pathologies including non-alcoholic fatty liver disease and hepatic fibrosis were scanned (mean age 53.3±5.5 years, 9 females). ShMOLLI T1 maps, multiple-echo GRE images, multiple-TR, multiple-TE STEAM MRS and long-TR STEAM MRS data were collected from each patient. Iron levels were determined from T2* values computed from GRE images. The liver model proposed by Tunnicliffe et al.8 was extended with a fat compartment (fig. 1) and bSSFP signals of different compartments were simulated at the measured off-resonance frequency using the Bloch-McConnell equations. Fat did not exchange protons with the cytosol of hepatocytes and was modelled using six spectral peaks9 with T1 and T2 values taken from the literature10 and from peanut oil measurements, due to its similarity with subcutaneous fat11. In the model extracellular volume fraction (ECF) was varied between 25% and (100-FF)% and extracellular, semisolid intracellular, liquid intracellular water signals and fat signal were simulated then combined to obtain one bSSFP signal. Again, the measured bSSFP signal was fitted to the simulated signal and the ECF corresponding to the highest R2 value was used to simulate a water-only signal with normal iron (1 mg/g dry weight) and on resonance. This signal was fitted using the shMOLLI conditional fitting algorithm to get the corrected shMOLLI T1 value.
Results
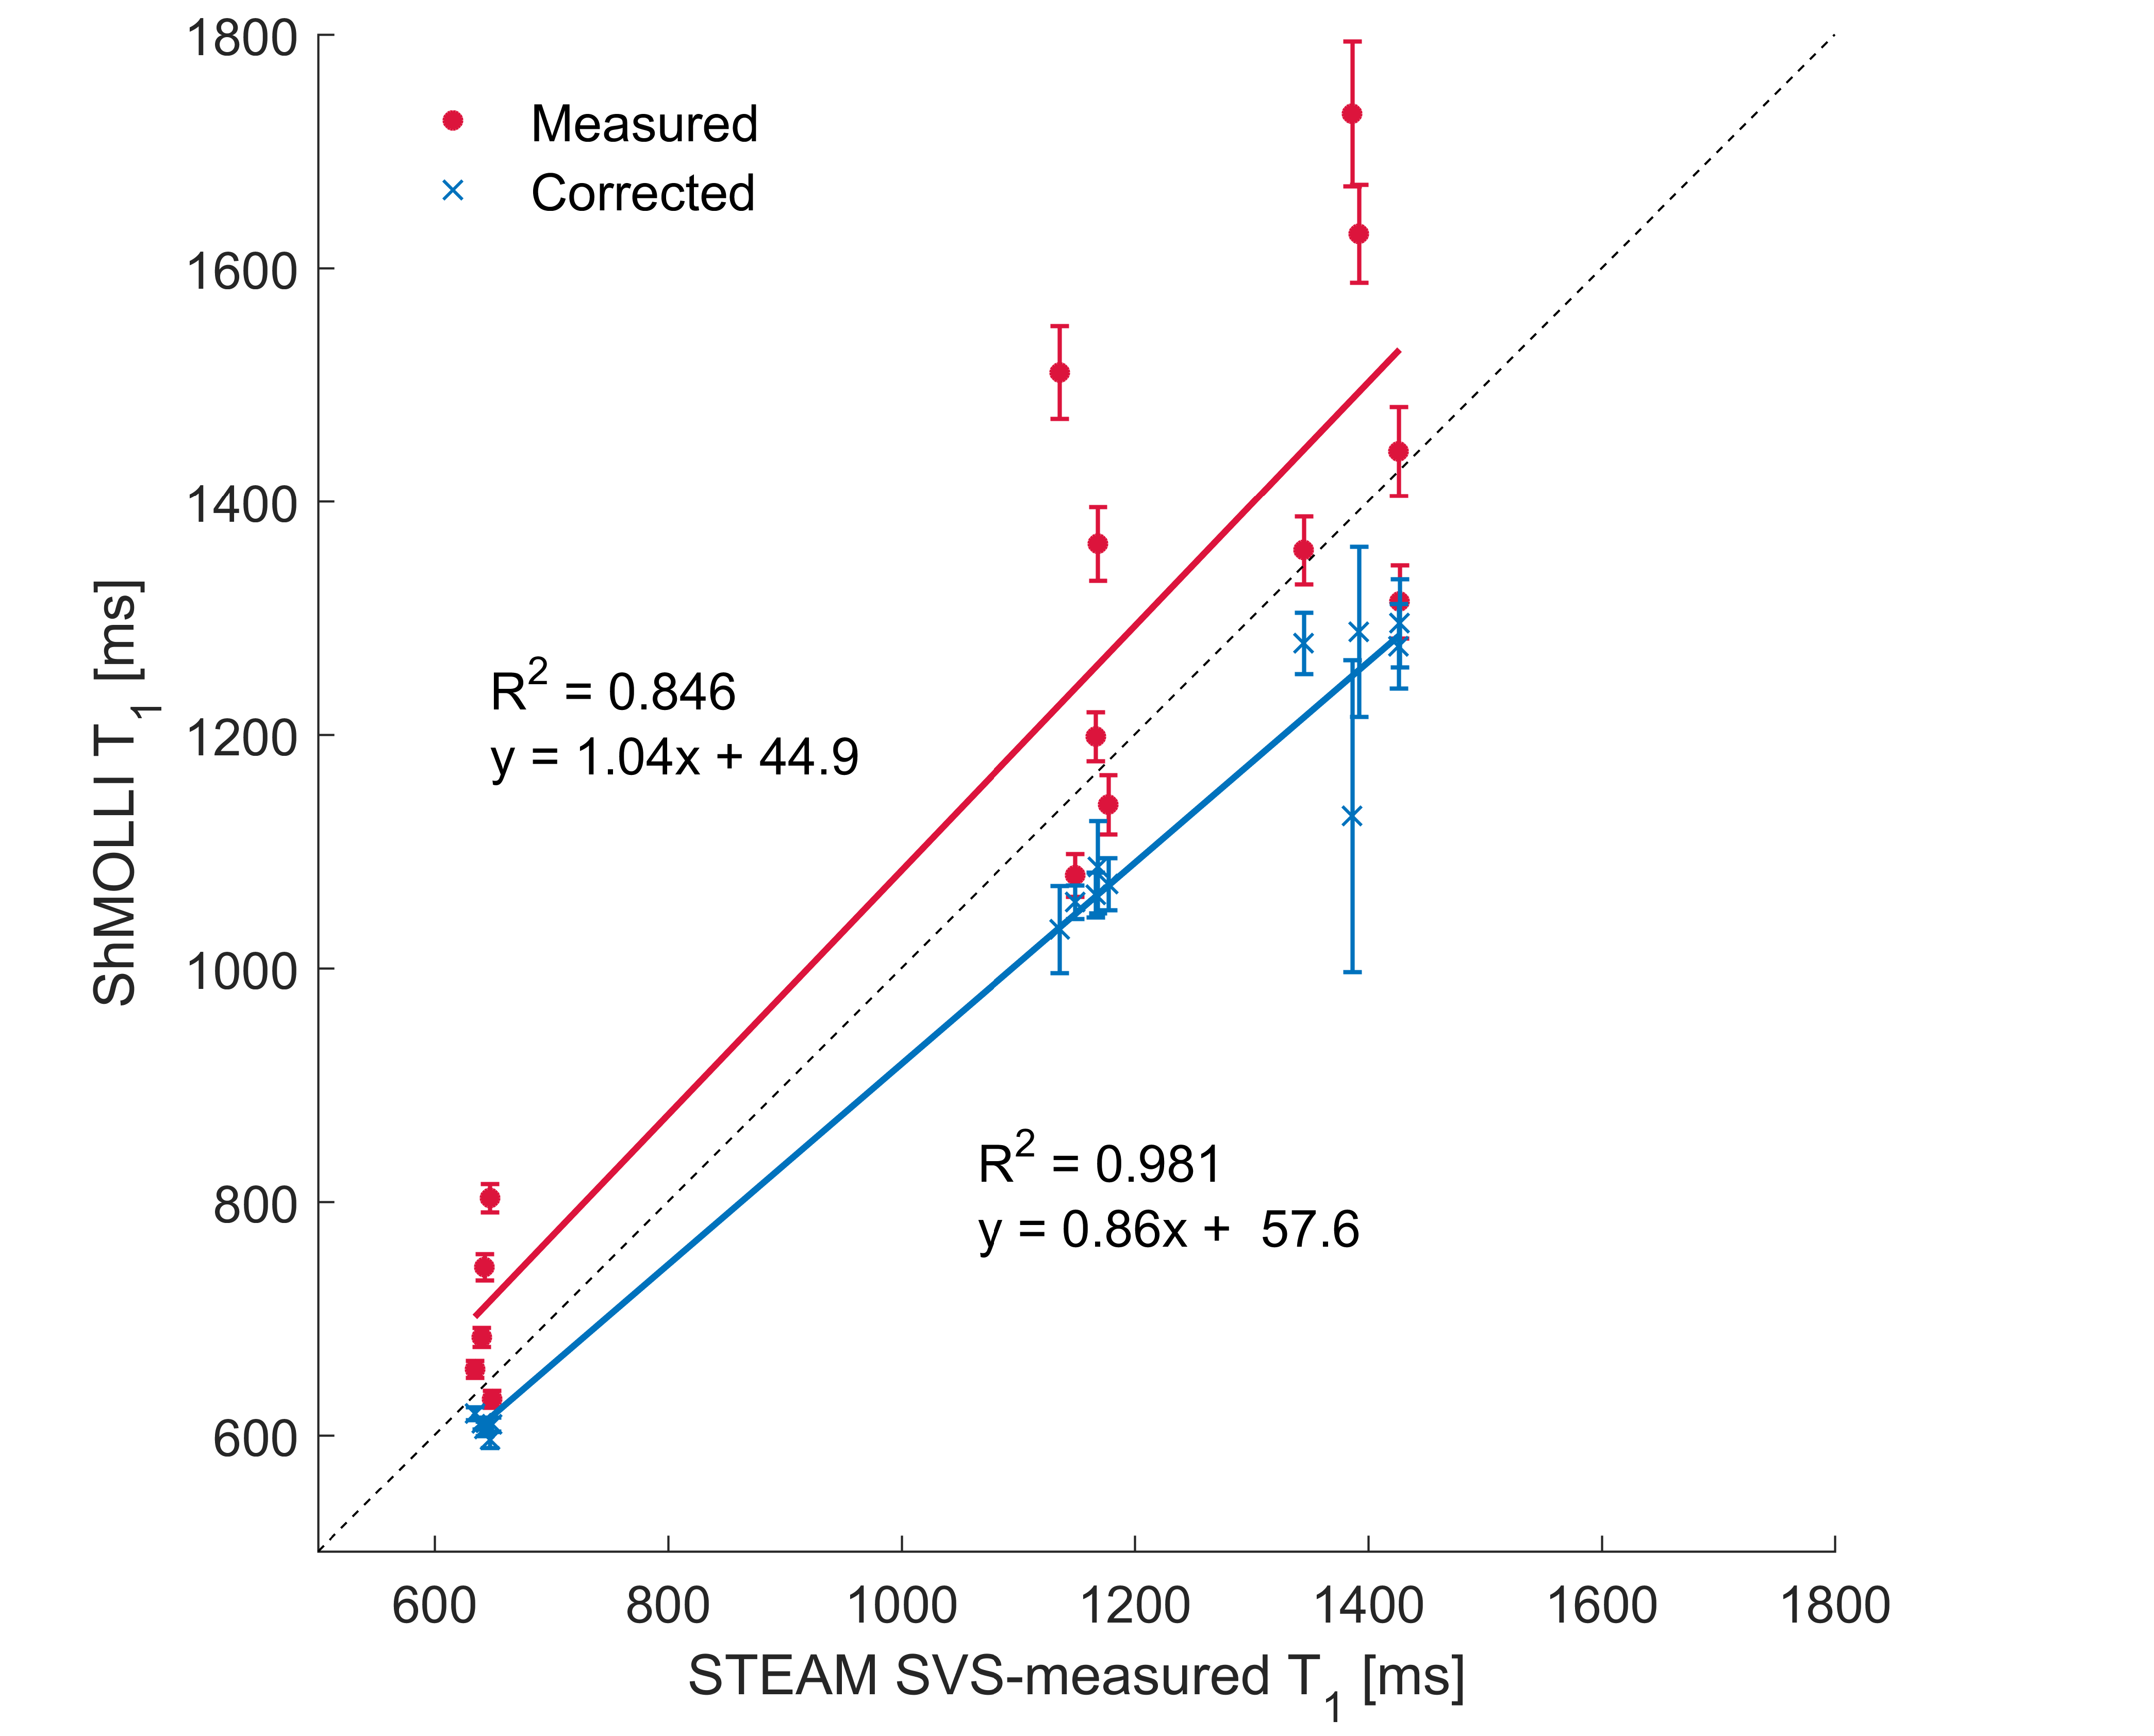
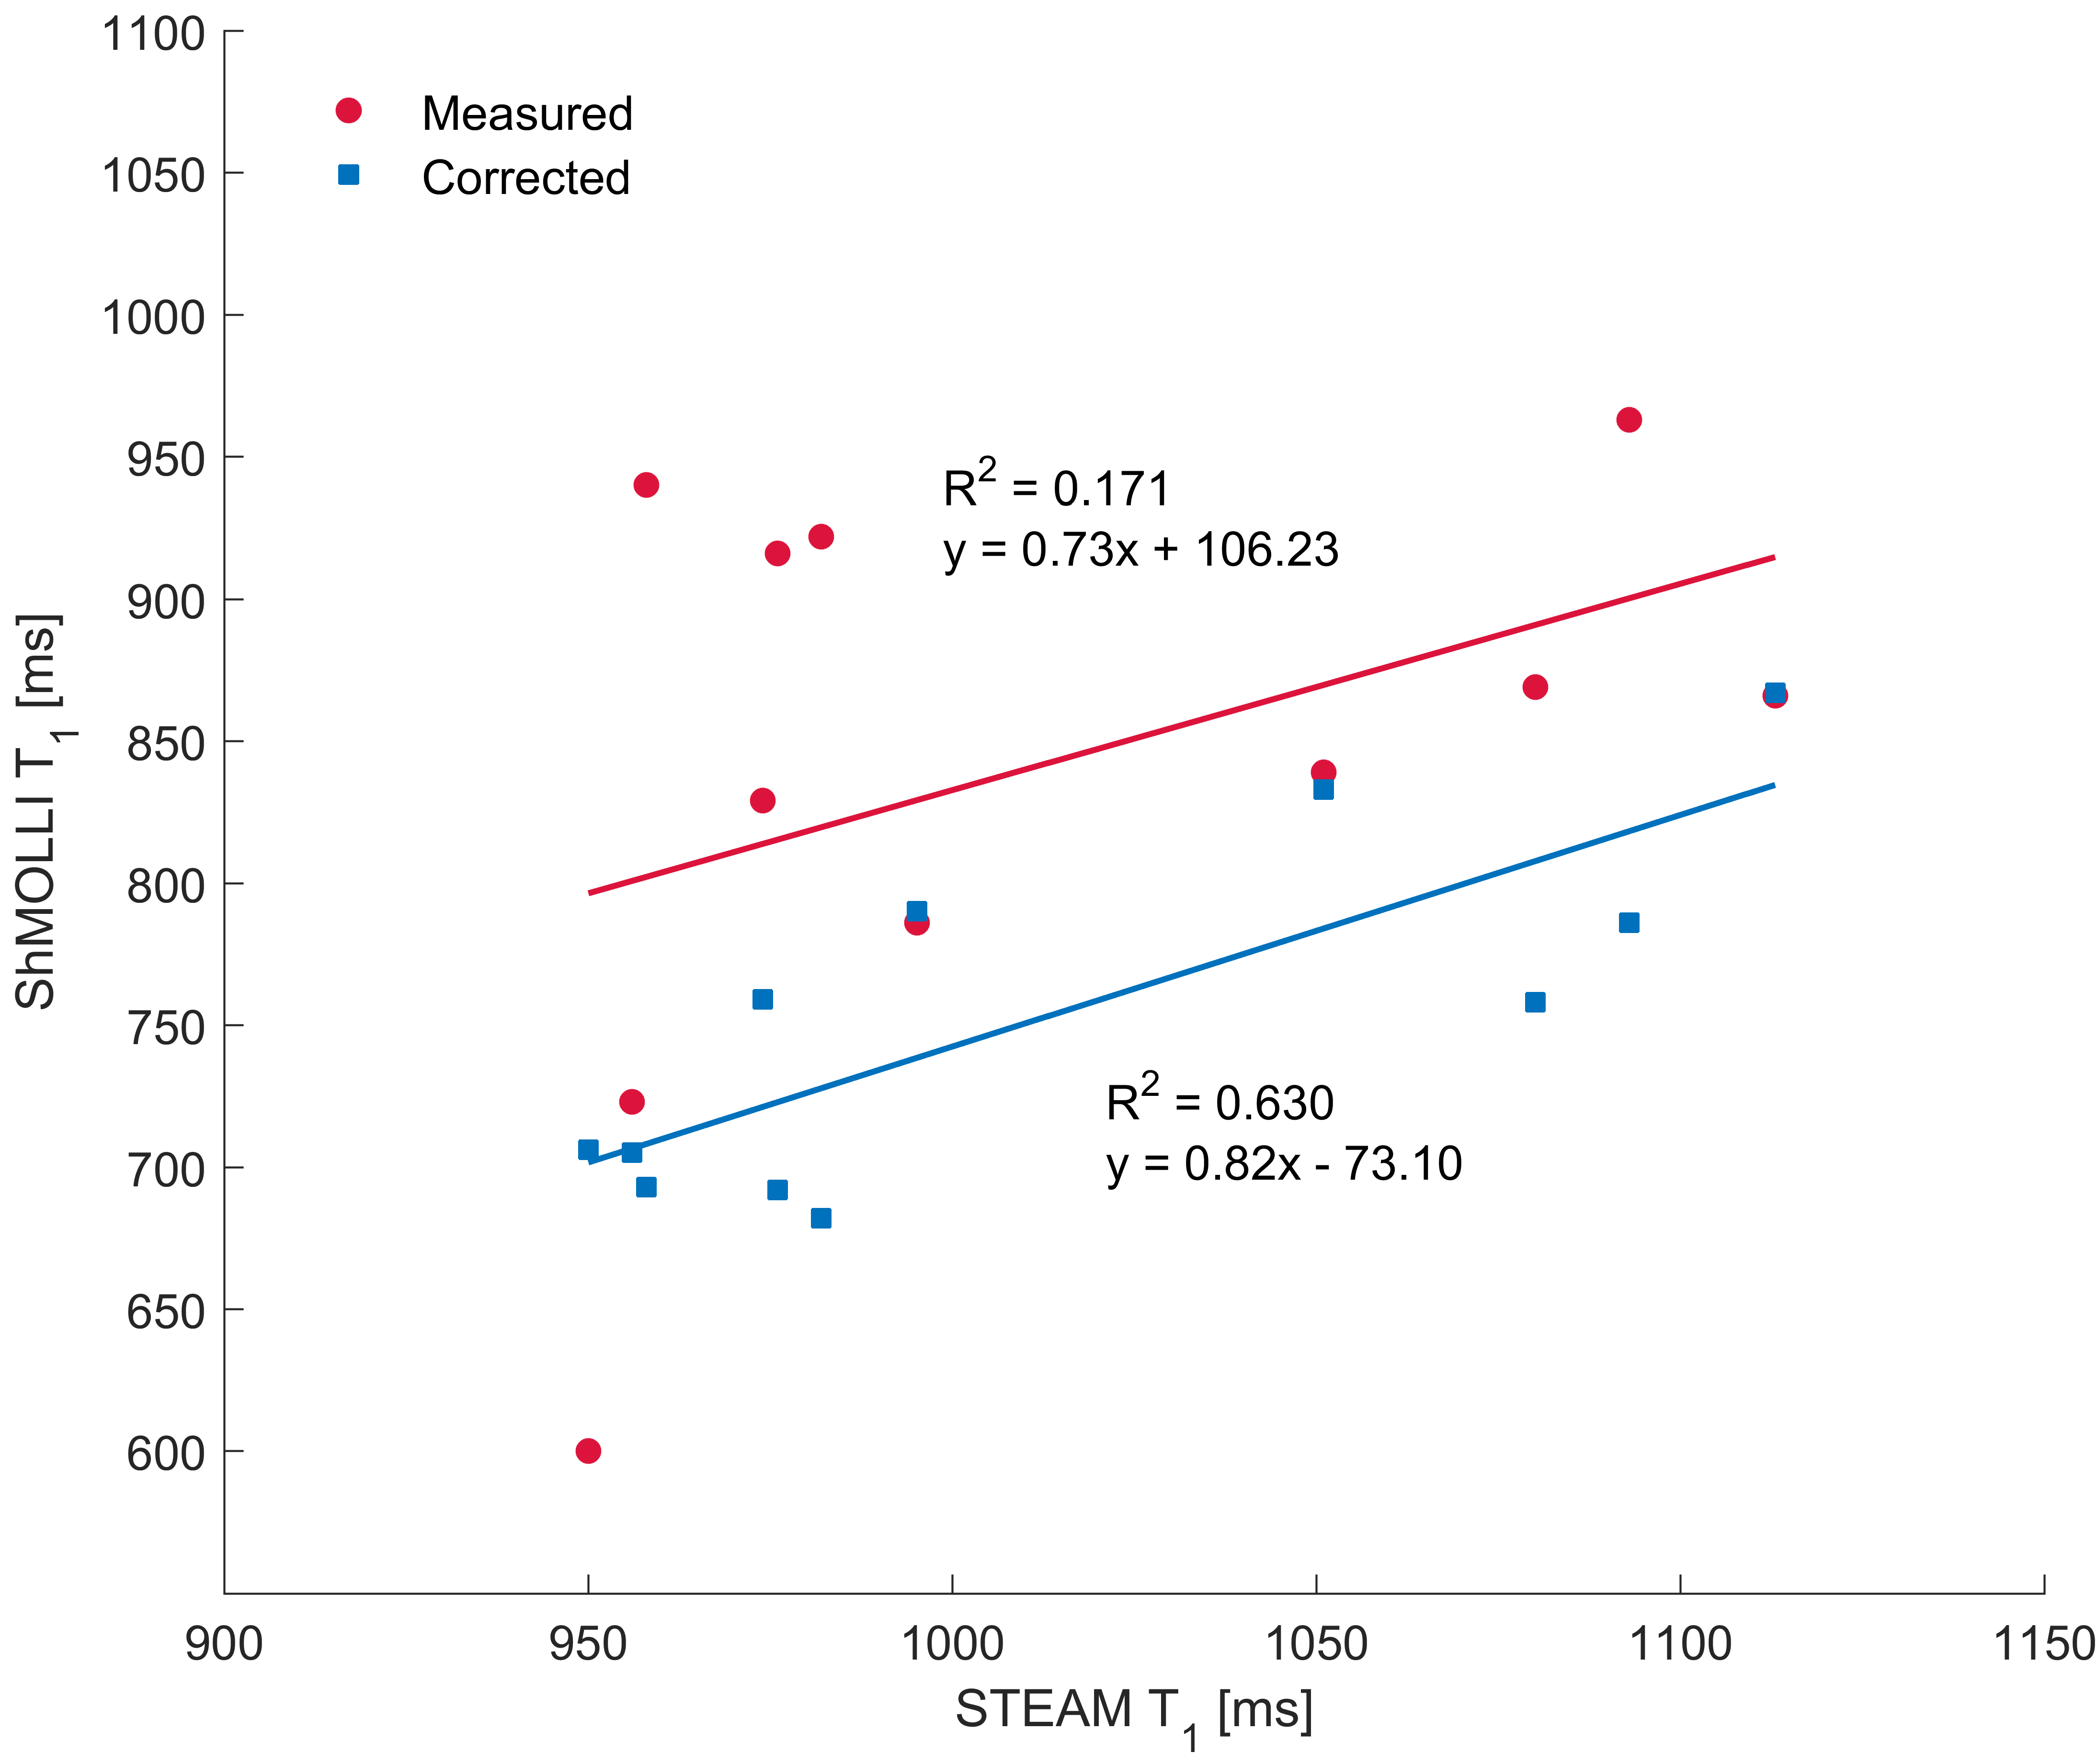
Variance of shMOLLI T1 was significantly reduced by the correction both in phantoms (p<0.01) and in patients (p=0.03). Additionally, the correlation between water STEAM T1 and shMOLLI T1 increased from R2=0.846 to R2=0.981 (fig. 2) in phantoms and from R2=0.171 to R2=0.63 in patients (fig. 3).Discussion
As fig. 3 shows, the correction preserved the sensitivity of T1 to increased water content, which is related to inflammation or fibrosis. Although all measurements were performed at a field strength of 3T, MOLLI T1 maps at 1.5T will also benefit from the correction, due to the strong dependence of the bSSFP signal on off-resonance frequencies and the smaller difference in resonance frequencies of water and lipid (~230 Hz instead of ~460 Hz at 3T). A limitation of the study is the small number of patients and the limited range of FF: 0.7% to 20%.Conclusion
A MOLLI T1 correction method has been developed that provides a T1 that would have been measured if the patients had 0% fat, normal iron levels and were placed on resonance in a perfectly homogeneous magnetic field.Acknowledgements
This work was supported by a UK MRC DTA (MR/K501256/1), a Scatcherd European Scholarship and the RDM Scholars Programme.References
1. Messroghli DR, Radjenovic A, Kozerke S, Higgins DM, Sivananthan MU, Ridgway JP. Modified Look-Locker inversion recovery (MOLLI) for high-resolution T1 mapping of the heart. Magn. Reson. Med. 2004;52(1):141-146. doi:10.1002/mrm.20110.
2. Piechnik SK, Ferreira VM, Dall’Armellina E, et al. Shortened Modified Look-Locker Inversion recovery (ShMOLLI) for clinical myocardial T1-mapping at 1.5 and 3 T within a 9 heartbeat breathhold. J. Cardiovasc. Magn. Reson. 2010;12(1):69. doi:10.1186/1532-429X-12-69.
3. Ferreira VM, Piechnik SK, Robson MD, Neubauer S, Karamitsos TD. Myocardial tissue characterization by magnetic resonance imaging: novel applications of T1 and T2 mapping. J. Thorac. Imaging 2014;29(3):147-54. doi:10.1097/RTI.0000000000000077.
4. Banerjee R, Pavlides M, Tunnicliffe EM, et al. Multiparametric magnetic resonance for the non-invasive diagnosis of liver disease. J. Hepatol. 2014;60(1):69-77. doi:10.1016/j.jhep.2013.09.002.
5. Mozes FE, Tunnicliffe EM, Pavlides M, Robson MD. Influence of fat on liver T 1 measurements using modified Look-Locker inversion recovery (MOLLI) methods at 3T. J. Magn. Reson. Imaging 2016;44(1):105-111. doi:10.1002/jmri.25146.
6. Hines CDG, Yu H, Shimakawa A, McKenzie CA, Brittain JH, Reeder SB. T1 Independent, T2* Corrected MRI with Accurate Spectral Modeling for Quantification of Fat: Validation in a Fat-Water-SPIO Phantom. J. Magn. Reson. Imaging 2009;30(5):1215-1222. doi:10.1002/jmri.21957.
7. Hamilton G, Middleton MS, Hooker JC, et al. In vivo breath-hold (1) H MRS simultaneous estimation of liver proton density fat fraction, and T1 and T2 of water and fat, with a multi-TR, multi-TE sequence. J. Magn. Reson. Imaging 2015. doi:10.1002/jmri.24946.
8. Tunnicliffe EM, Banerjee R, Pavlides M, Neubauer S, Robson MD. A model for hepatic fibrosis: the competing effects of cell loss and iron on shortened modified Look-Locker inversion recovery T1 (shMOLLI-T1) in the liver. J. Magn. Reson. Imaging 2016. doi:10.1002/jmri.25392.
9. Hamilton G, Yokoo T, Bydder M, et al. In vivo characterization of the liver fat 1H MR spectrum. NMR Biomed. 2011;24(7):784-790. doi:10.1002/nbm.1622.
10. Hamilton G, Middleton MS, Bydder M, et al. Effect of PRESS and STEAM sequences on magnetic resonance spectroscopic liver fat quantification. J. Magn. Reson. Imaging 2009;30(1):145-52. doi:10.1002/jmri.21809.
11. Yu H, Shimakawa A, McKenzie CA, Brodsky E, Brittain JH, Reeder SB. Multiecho water-fat separation and simultaneous R2* estimation with multifrequency fat spectrum modeling. Magn. Reson. Med. 2008;60(5):1122-34. doi:10.1002/mrm.21737.
Figures