0366
A paradoxical systemic bias in Gd-EOB-DTPA-enhanced T1 relaxometry of the liver: a comparison of SMART1Map and MOLLI.1Department of Radiology, Shinshu Univ. School of Medicine, Matsumoto, Japan, 2Department of Radiology, Shinshu Univ. Hospital, Matsumoto, Japan, 3GE Healthcare Japan, Japan, 4GE Healthcare, United States
Synopsis
SMART1Map (saturation method using adaptive recovery times for cardiac T1 mapping) is a new single-point T1 mapping technique that directly measures true T1 unlike look-locker approaches. The feasibility of Gd-EOB-DTPA-enhanced T1 relaxometry of the liver using SMART1Map was evaluated comparing with modified look-locker inversion recovery (MOLLI). A significant paradoxical systemic bias was observed between and within SMART1Map and MOLLI in Gd-EOB-DTPA-administrated liver, although SMART1Map may be more reproducible than MOLLI in the rest of conditions. Careful consideration should be given to the effect of the paradoxical systemic bias in the evaluation of liver function using Gd-EOB-DTPA-enhanced T1 relaxometry.
Purpose
Gd-EOB-DTPA-enhanced T1 relaxometry of the liver has been focused for the quantitative assessment of the liver function because the contrast enhancement effect can be evaluated more precisely than signal intensity-based evaluation1. SMART1Map (saturation method using adaptive recovery times for cardiac T1 mapping) is a new single-point technique for cardiac T1 mapping. Unlike Look-Locker approaches, such as modified look-locker inversion recovery (MOLLI), which yield an “apparent” T1 (T1*), SMART1Map directly measures true T1. Because T1* is a function of imaging parameters, it is always shorter than T1, and correction methods are required to obtain the true T1 2. The purpose of this study was to evaluate feasibility of Gd-EOB-DTPA-enhanced T1 relaxometry of the liver using SMART1Map comparing with MOLLI.Methods
This prospective clinical study was approved by an institutional review board, and written informed consent was obtained from all subjects. We evaluated consecutive 21 patients with various degree of chronic hepatitis who underwent Gd-EOB-DTPA-enhanced MR imaging. T1map using SMART1Map and MOLLI, single breath-hold 3D-GRE-T1-weighted image (T1WI) with fat suppression (TR = 5 ms, TE = 1.4 ms, FA = 12°) were obtained at pre-contrast (0 min), 3 and 20 min after intravenous administration of Gd-EOB-DTPA (0.025 mmol/kg body weight at 2 mL/s) at an axial plane with maximum corss-section are of the liver using 1.5T MR scanner (GE Healthcare, Waukesha, WI, USA). Plastic bottle phantoms containing several concentration of Gd-EOB-DTPA diluted by normal saline (0, 0.1, and 0.2 mmol/mL) were scanned together. T1 and signal intensity (SI) on T1WI of the liver, spleen, and bottle phantoms at 0, 3, and 20 min were obtained from region of interests placed on MR images. Estimated SI (eSI) was simulated from observed SI on T1WI at 0 min and obtained T1s under the same MR parameters as used in the actual scan according to various T1 relaxometry methods [SMART1Map, MOLLI with ‘Look-Locker’ correction (cMOLLI), and MOLLI without correction (ucMOLLI)]. The relation of T1s obtained from SMART1Map [T1SMART1] and cMOLLI [T1cMOLLI], the relation of eSI and observed SI according to various T1 relaxometry methods were evaluated using Bland-Altman analysis.Results
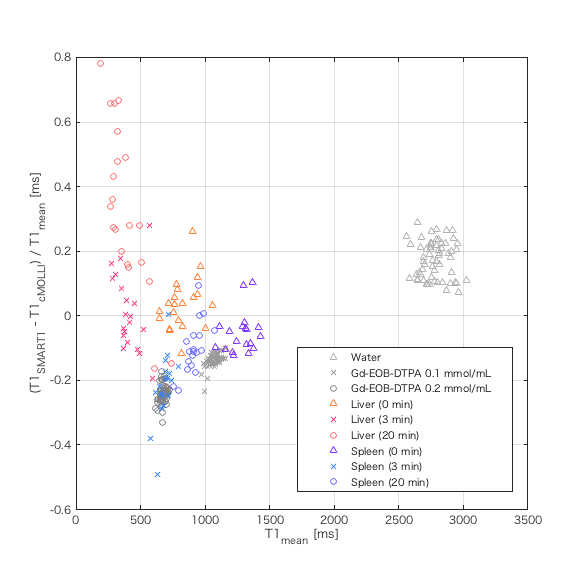
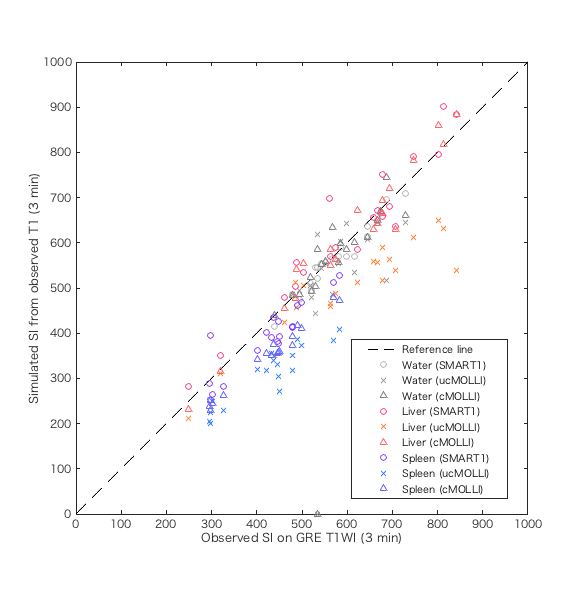
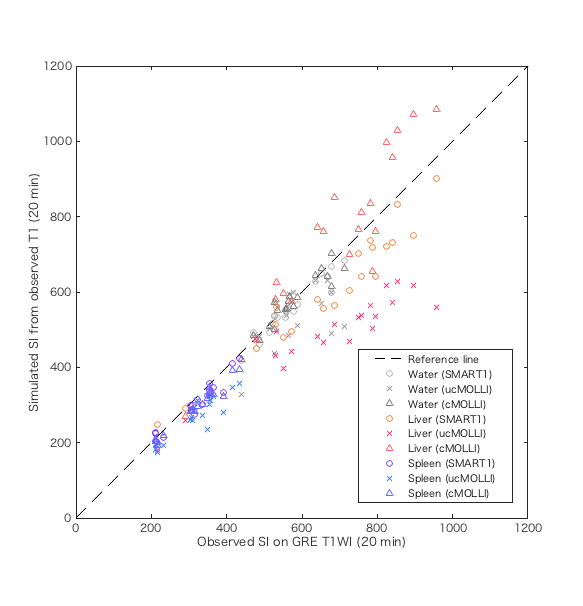
T1SMART1 was significantly longer than T1cMOLLI in water and the liver at 20 min after Gd-EOB-DTPA administration; oppositely, T1SMART1 was significantly shorter than T1cMOLLI in the rest of conditions except in the liver at pre-contrast and 3 min after Gd-EOB-DTPA administration. The significant positive correlation between mean of T1 [T1mean = (T1SMART1 + T1cMOLLI) / 2] and relative difference rate of T1 [T1RDR = (T1SMART1 - T1cMOLLI) / T1mean] was observed in phantoms (r = 0.97, P < 0.0001), in the spleen at 3 min (r = 0.63, P = 0.005) and 20 min (r = 0.68, P = 0.001) after Gd-EOB-DTPA administration; oppositely, significant negative correlation was observed in the liver at 20 min after Gd-EOB-DTPA administration (r = -0.81, P < 0.0001). Estimated signal intensity (eSI) from observed T1 was significantly lower than observed SI on T1WI in the spleen at 3 and 20 min after Gd-EOB-DTPA administration in SMART1Map and cMOLLI; however, absolute difference between eSI and observed SI was significantly small in SMART1Map (P < 0.0001 for 3 min, P = 0.014 for 20 min). eSI in the liver at 20 min after Gd-EOB-DTPA administration was significantly lower in SMART1Map (P < 0.0001 ) and higher in cMOLLI (P = 0.005) compared to observed SI. eSI using ucMOLLI was significantly lower than observed SI in most of conditions.Discussion
Our results revealed following 2 major findings. 1) The negative proportional systemic bias was observed in T1 obtained from SMART1Map compared to cMOLLI in Gd-EOB-DTPA-administrated liver; oppositely, the positive proportional systemic bias was observed in the rest of conditions. 2) The positive and negative proportional systemic bias were observed in eSI calculated from T1 obtained from cMOLLI and from SMART1Map compared to observed SI on GRE T1WI in Gd-EOB-DTPA-administrated liver; although the fixed systemic bias was small in SMART1Map compared to cMOLLI in the rest of conditions. These findings suggest existence of paradoxical systemic bias specific to Gd-EOB-DTPA-administrated liver in T1 relaxometry using SMART1Map and cMOLLI. This kind of systemic bias has not been reported before; therefore, careful consideration should be given to the effect of the paradoxical systemic bias in the evaluation of liver function using Gd-EOB-DTPA-enhanced T1 relaxometry.Conclusion
A significant paradoxical systemic bias can exist between and within SMART1Map and MOLLI in Gd-EOB-DTPA-enhanced T1 relaxometry of the liver, although SMART1Map may be more reproducible than MOLLI except for Gd-EOB-DTPA-administrated liver.Acknowledgements
No acknowledgement found.References
1. JH Yoon, JM Lee, M Paek, JK Han, BI Choi. Quantitative assessment of hepatic function: modified look-locker inversion recovery (MOLLI) sequence for T1 mapping on Gd-EOB-DTPA-enhanced liver MR imaging. Eur Radiol 2016; 26:1775-1782. 2)
2. GS Slavin, JA Stainsby. True T1 mapping with SMART1Map (saturation method using adaptive recovery times for cardiac T1 mapping): a compareson with MOLLI. Journal of Cardiovascular Magnetic Resonance 2013; 15(Suppl 1):P3.
Figures