0365
Monitoring Resolution of Fatty Liver Disease with MRI following Bariatric Surgery: A Prospective, Multi-center Study1University of Wisconsin, Madison, WI, United States, 2St. Jude Children's Research Hospital, Memphis, TN, 3University of California-San Diego, San Diego, CA, 4Viginia Commonwealth University, Richmond, VA
Synopsis
The temporal resolution of fatty liver disease following bariatric surgery is poorly understood. We used a validated chemical shift encoded MRI (CSE-MRI) method to measure liver proton density fat fraction (PDFF) as a biomarker of liver fat. We followed a cohort of 50 obese adults undergoing bariatric surgery with pre-operative very low calorie diet (VLCD) and conclude that average liver PDFF normalizes to <5% by 6 months following bariatric surgery. Normalization of liver fat is seen in 79% of patients who lower body mass index (BMI) by ≥10 mg/k2 and 83% of patients who lose ≥30 kg.
Purpose
To prospectively and longitudinally evaluate changes in liver fat content relative to anthropometrics (body mass index [BMI], weight, and waist circumference [WC]) in obese patients undergoing a bariatric surgery with pre-operative very low calorie diet (VLCD) using a chemical shift encoded MRI (CSE-MRI) technique to measure liver PDFF as a biomarker of liver fat.Methods
Over 66 months, we recruited consecutive obese patients from two bariatric surgery centers undergoing bariatric surgery with pre-operative VLCD. Potential patients were excluded for factors precluding MRI (extreme claustrophobia, body habitus exceeding scanner limit, non-compatible medical devices, etc.), pregnancy, comorbid liver disease, or hepatotoxic medications at baseline. Enrolled patients were excluded from final analysis if bariatric surgery was ultimately not performed, if they did not undergo pre-operative VLCD, or if intra-operative biopsy was negative for hepatic steatosis (histologic grade 0). Pre-operative VLCD was initiated an average of 18.2±8.6 days prior to surgery. Patients underwent CSE-MRI [1-5] to measure liver proton density fat fraction (PDFF) at 5 time points, including baseline pre-VLCD (2-3 weeks before surgery); post-VLCD (1 day before surgery); and 1, 3, and 6 months post-surgery). Anthropometric data (BMI, weight, WC) were also recorded at each time point. Changes in liver PDFF were compared to concomitant changes in anthropometric data over time.Results
50 patients (M:F, 7:43; mean age, 51.0±11.2 years) comprised the final analysis cohort. Mean pre-VLCD PDFF was 18.1±8.6% with mean pre-VLCD BMI of 44.9±6.5 kg/m2, mean weight of 121.5±21.1 kg, and mean WC of 132.2±14.3 cm.
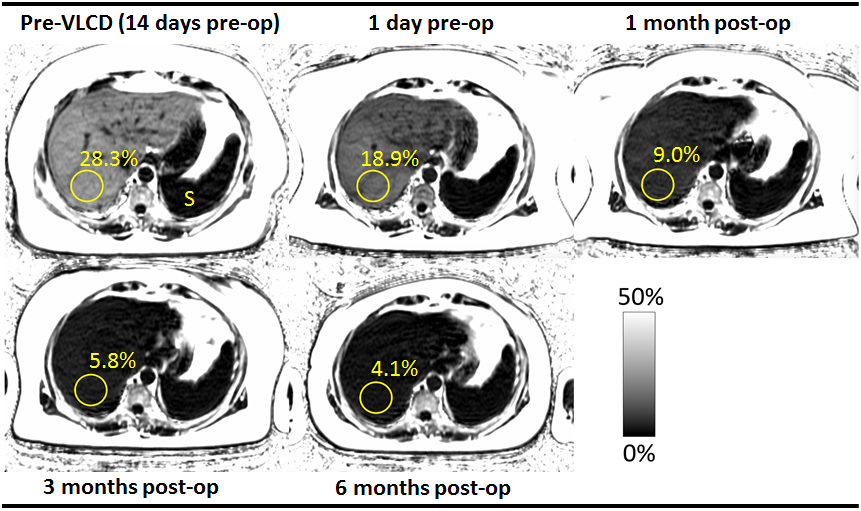
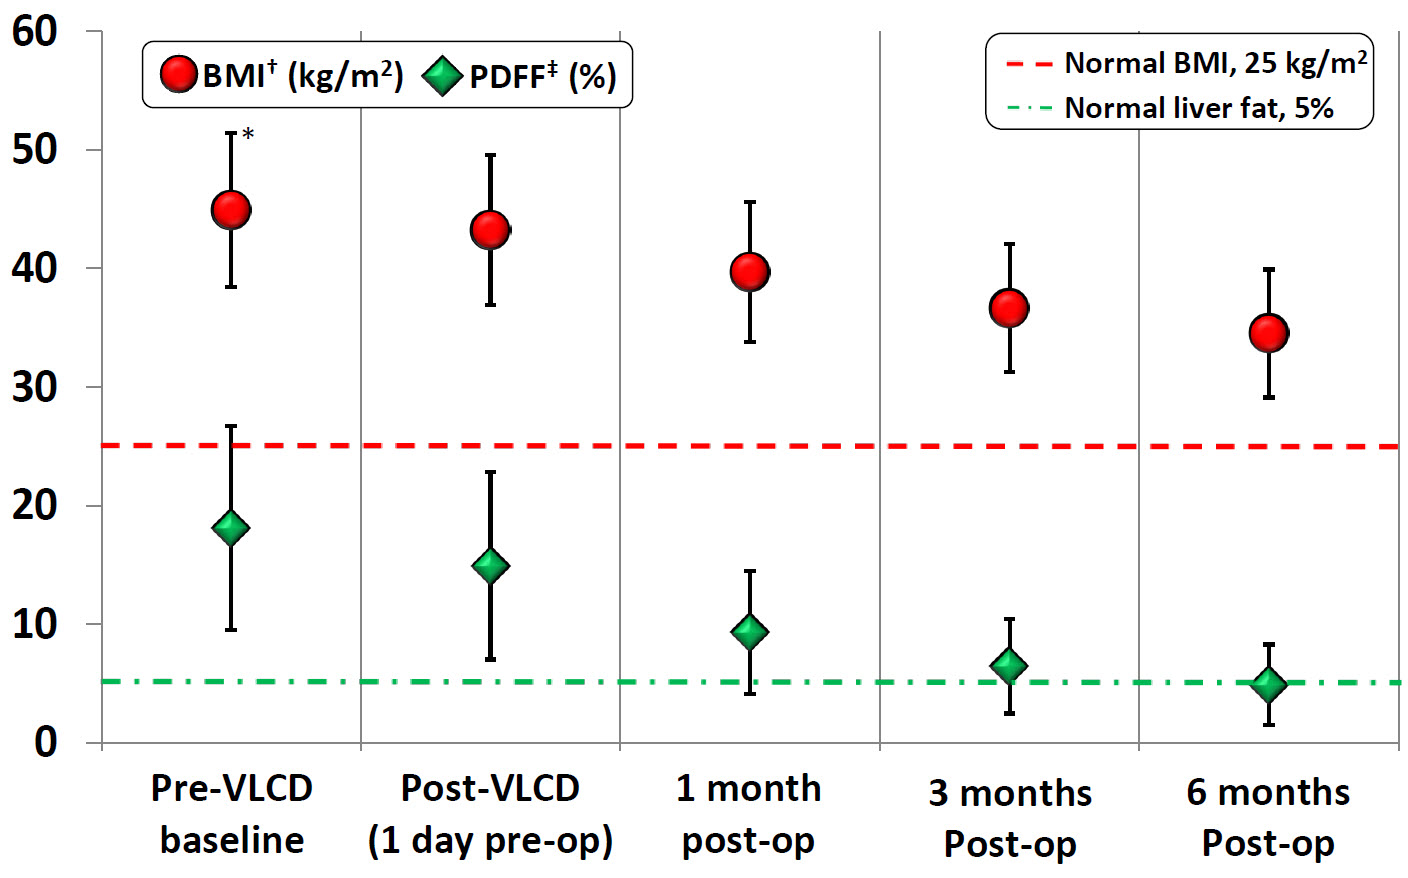
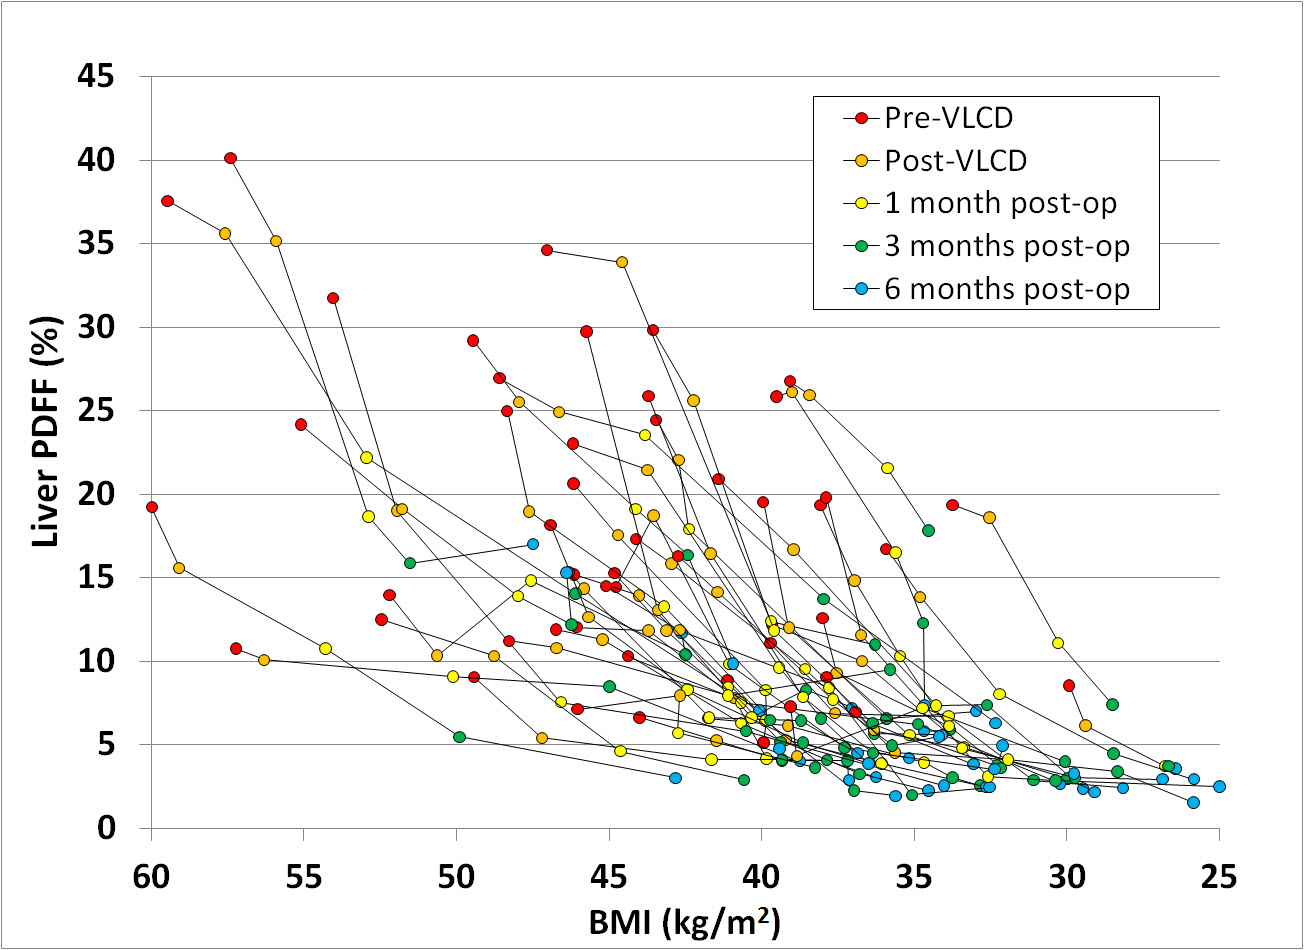
Figure 1 shows an example of a series of PDFF maps in one of the patients enrolled in this study. Mean PDFF decreased to 14.9% post-VLCD and 9.3%, 6.5%, and 4.9% at 1, 3, and 6 months post-surgery, respectively (Figure 2). BMI decreased to 43.2, 39.7, 36.6, and 34.5 kg/m2; mean weight decreased to 117.0, 107.2, 99.1, and 91.6 kg; and mean WC decreased to 129.2, 123.7, 116.0, and 110.9 cm, respectively. A plot of change in PDFF vs. BMI over time for individual patients is shown in Figure 3.
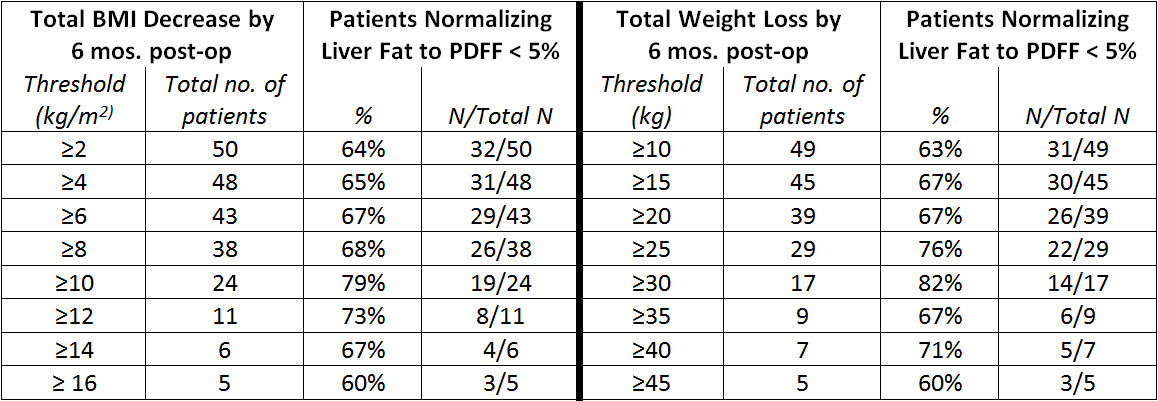
Overall, 64% of patients (32/50) normalized liver fat to PDFF <5% by the 6-month post-surgery time point. Mean overall BMI decrease was 10.4 kg/m2, with mean weight decrease of 30.0 kg and WC decrease of 21.3 cm. Patients decreasing BMI by ≥10 kg/m2 were more likely to normalize liver fat to PDFF <5% than those who decreased BMI by <10 kg/m2 (79%, 19/24 vs 50%, 13/26; P=0.042). Similar results were seen in patients losing ≥30 kg compared to those losing <30 kg (83%, 15/18 vs 50%, 16/32, P=0.030). The fraction of patients normalizing PDFF to <5% for different BMI and weight loss thresholds is shown in Figure 5.
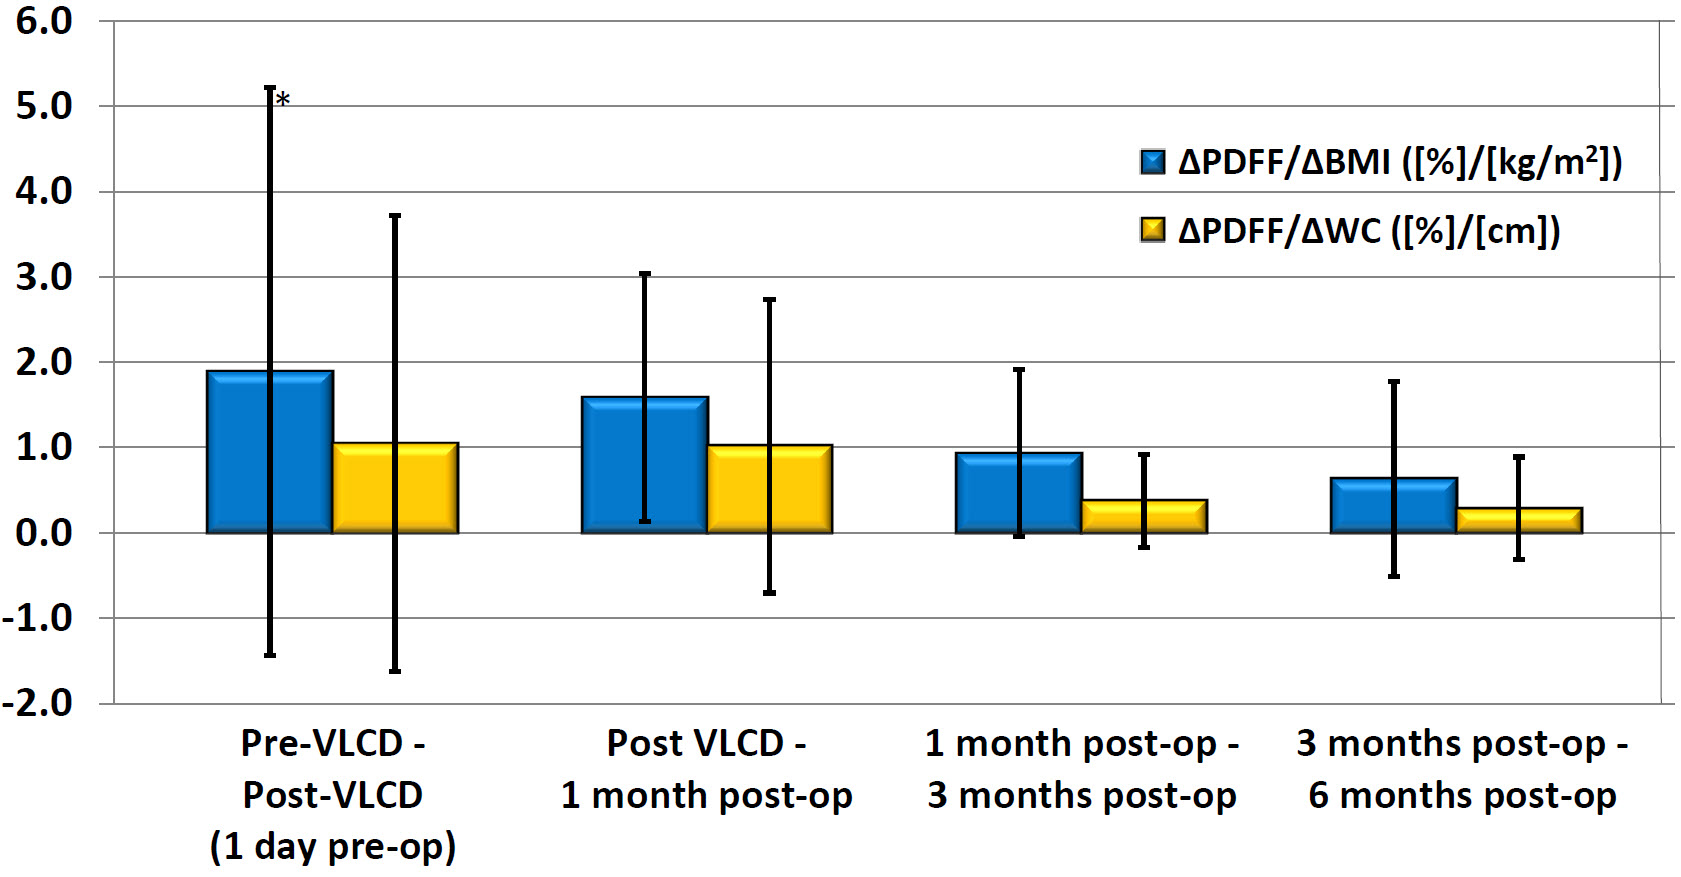
Decreases in PDFF relative to BMI (∆PDFF/∆BMI, %/[kg/m2]) slowed over time, averaging 1.9, 1.6, 0.9, and 0.6 between respective MRI exams (Figure 4), with similar results seen with decreases in PDFF relative to WC (∆PDFF/∆WC, [%/cm]), averaging 1.05, 1.02, 0.37, and 0.29, respectively.
Discussion
Using a validated CSE-MRI method to measure PDFF as a biomarker for liver fat, we observed normalization of liver fat from a pre-operative average PDFF of over 18% to a PDFF of <5% in our obese adult population 6 months following bariatric surgery with pre-operative VLCD. This reduction in liver fat corresponded to a mean BMI reduction of approximately 10 kg/m2, or a mean overall weight loss of approximately 30 kg. Patients losing ≥10 kg/m2 or ≥30 kg were significantly more likely to normalize liver fat, at a rate of approximately 80%. We also observed that relative to anthropometrics (BMI, WC), liver fat decreased most rapidly during the pre-operative VLCD period, with progressively smaller decreases observed at successive time points following bariatric surgery.Conclusion
CSE-MRI can be successfully used to monitor liver fat content over time following bariatric surgery. A BMI decrease of 10 kg/m2 or overall weight loss of 30 kg may serve as useful clinical reference points for normalization of liver fat following bariatric surgery. Observations that liver fat content decreased most rapidly during the pre-operative VLCD period suggests that corrections to metabolic derangements in the liver may being to occur in advance of significant overall weight loss.Acknowledgements
The authors wish to acknowledge support from the NIH (R01 DK088925, R01 DK083380, R01 DK100651, K24 DK102595) and GE Healthcare who provides research support to the University of Wisconsin and the University of California, San Diego.References
1. Reeder SB, Cruite I, Hamilton G, Sirlin CB. Quantitative Assessment of Liver Fat with Magnetic Resonance Imaging and Spectroscopy. Journal of Magnetic Resonance Imaging 2011;34:729-749.
2. Reeder SB, Hu HCH, Sirlin CB. Proton density fat-fraction: A standardized mr-based biomarker of tissue fat concentration. Journal of Magnetic Resonance Imaging 2012;36:1011-1014.
3. Hines CDG, Yu HZ, Shimakawa A, McKenzie CA, Warner TF, Brittain JH, Reeder SB. Quantification of Hepatic Steatosis with 3-T MR Imaging: Validation in ob/ob Mice. Radiology 2010;254:119-128.
4. Hines CDG, Frydrychowicz A, Hamilton G, Tudorascu DL, Vigen KK, Yu HZ, McKenzie CA, et al. T-1 Independent, T-2* Corrected Chemical Shift Based Fat-Water Separation With Multi-peak Fat Spectral Modeling Is an Accurate and Precise Measure of Hepatic Steatosis. Journal of Magnetic Resonance Imaging 2011;33:873-881.
5. Idilman IS, Aniktar H, Idilman R, Kabacam G, Savas B, Elhan A, Celik A, et al. Hepatic Steatosis: Quantification by Proton Density Fat Fraction with MR Imaging versus Liver Biopsy. Radiology 2013;267:767-775.
Figures