0364
Linearity, Bias, and Precision of Proton-Density Fat Fraction for Liver Fat Quantification: A Meta-Analysis1Radiology, University of Texas Southwestern Medical Center, Dallas, TX, United States, 2Radiology, Center for Advanced Magnetic Resonance Development, Duke University Medical Center, Durham, NC, United States, 3Radiology, Medical Physics, Biomedical Engineering, Medicine, and Emergency Medicine, University of Wisconsin, Madison, WI, United States, 4Liver Imaging Group, Radiology, University of California San Diego, San Diego, CA, United States, 5Radiology, University of Montréal, Montréal, QC, Canada, 6Radiology, University of Bonn, Bonn, Germany, 7University Greifswald, Greifswald, Germany, 8Ludwig-Maximilian University Hospital, Munich, Germany, 9Chonbuk National University Medical School and Hospital, Jeonju, Korea, Republic of
Synopsis
Proton-density fat fraction (PDFF) is a quantitative imaging biomarker (QIB) of hepatic triglyceride concentration and steatosis. Liver PDFF can be measured noninvasively using magnetic resonance imaging (MRI) or spectroscopy (MRS). Various MRI-based PDFF methods have been validated in single-center studies at 1.5T or 3T field strength using a specific reconstruction algorithm on a single vendor platform. However, its technical performance as a QIB is unknown in a multi-center, multi-vendor setting. In this meta-analysis of previously published data from multiple studies, we demonstrated excellent linearity, negligible bias, and high repeatability/reproducibility of MRI-PDFF across different field strengths, vendors, and reconstruction algorithms.
Introduction
Proton-density fat fraction (PDFF) is a quantitative imaging biomarker (QIB) of intracellular hepatic triglyceride concentration and steatosis, which can be measured using magnetic resonance imaging (MRI) or spectroscopy (MRS). PDFF is a fundamental property of tissue and represents the ratio of MR-visible triglyceride protons to the sum of visible triglyceride and water protons. As the only standardized QIB for hepatic fat content, PDFF holds promise for multi-center research studies and in clinical practice. Proton-density fat fraction (PDFF) is mathematically defined as: PDFF = ∑all PDfat peak / (PDwater peak + ∑all PDfat peak), where PD is the MR-visible proton-density at resonance frequencies corresponding to water (4.7 ppm) and triglyceride (multiple frequencies [1]).
Various MRI-based methods for measuring PDFF have been proposed, including 2D and 3D spoiled gradient recalled echo (SGRE) sequences at 1.5T and 3T field strengths, using different reconstruction algorithms. Compelling published data indicate that MRI-PDFF has high linearity and negligible bias against MRS as the reference, as well as excellent test-retest repeatability. By comparison, there are limited data on the performance of MRI-PDFF in multi-center or clinical settings, where MRI-PDFF measurements may be made on scanners of different field strengths, different vendors, and using different reconstruction algorithms. The purpose of this meta-analysis was to summarize the existing literature on MRI-PDFF to obtain pooled linearity, bias, and precision estimates across different field strengths, scanner vendors, and reconstruction algorithms.
Methods
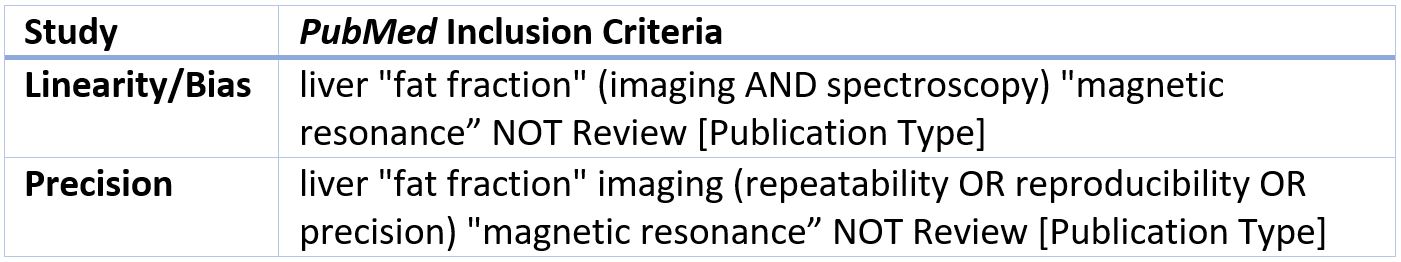
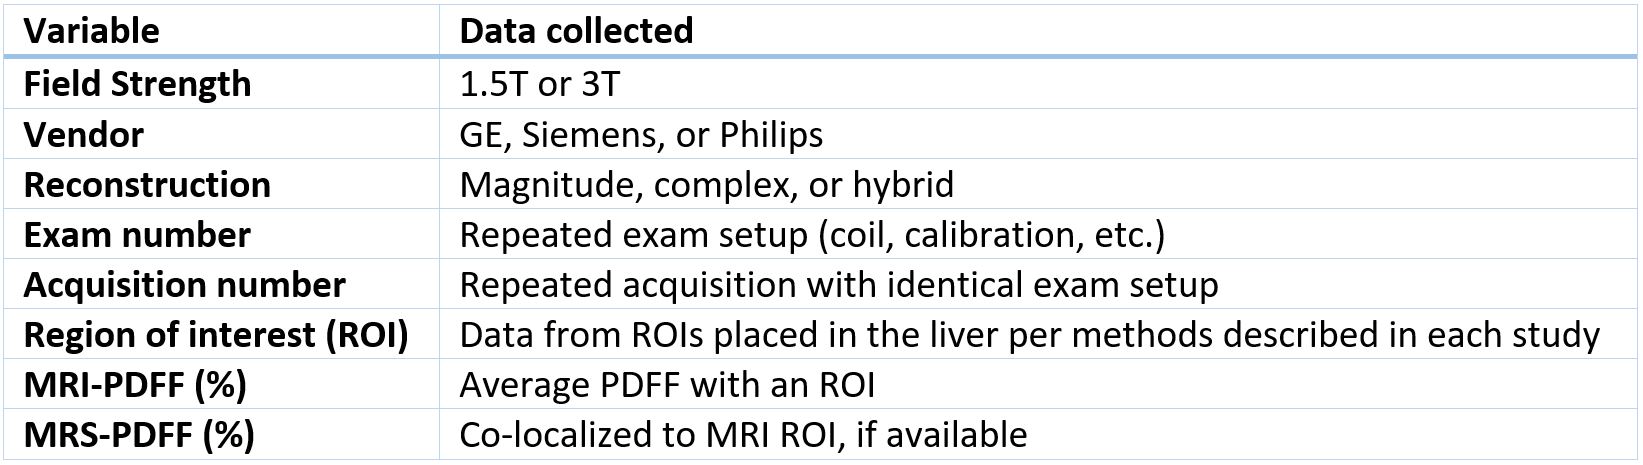
A PubMed search was performed for primary research articles using criteria detailed in Table 1. Abstracts, followed by full papers, were screened using the following exclusion criteria: secondary analysis of previously published data; not meeting criteria for PDFF; not in vivo human study; no adequate MRS-PDFF reference standard (i.e. no long-TR multi-TE T2-corrected STEAM sequence for the linearity/bias study); no repeated PDFF measurements (for the precision study). Once all eligible papers were identified, the lead or senior authors of these articles were invited to submit the de-identified source PDFF data for this meta-analysis. For each subject’s MRI-PDFF measurements, data listed in Table 2 were recorded in a pooled database.
The pooled data were analyzed using R (version 3.1.3, The R Foundation for Statistical Computing, Vienna, Austria). Linearity was evaluated using linear regression of MRI- vs. MRS-PDFF. Bias, defined as the PDFF difference between MRI and MRS (as the reference technique), was evaluated using a linear mixed model, with field strength, vendor, and reconstruction as fixed effects, and subject, ROI, exam and acquisition as random effects. Precision, defined as variability of MRI-PDFF with repeated measurements, was also evaluated using a linear mixed effects model, with field strength, vendor, reconstruction, subject, ROI, exam, and acquisition as random effects.
Results
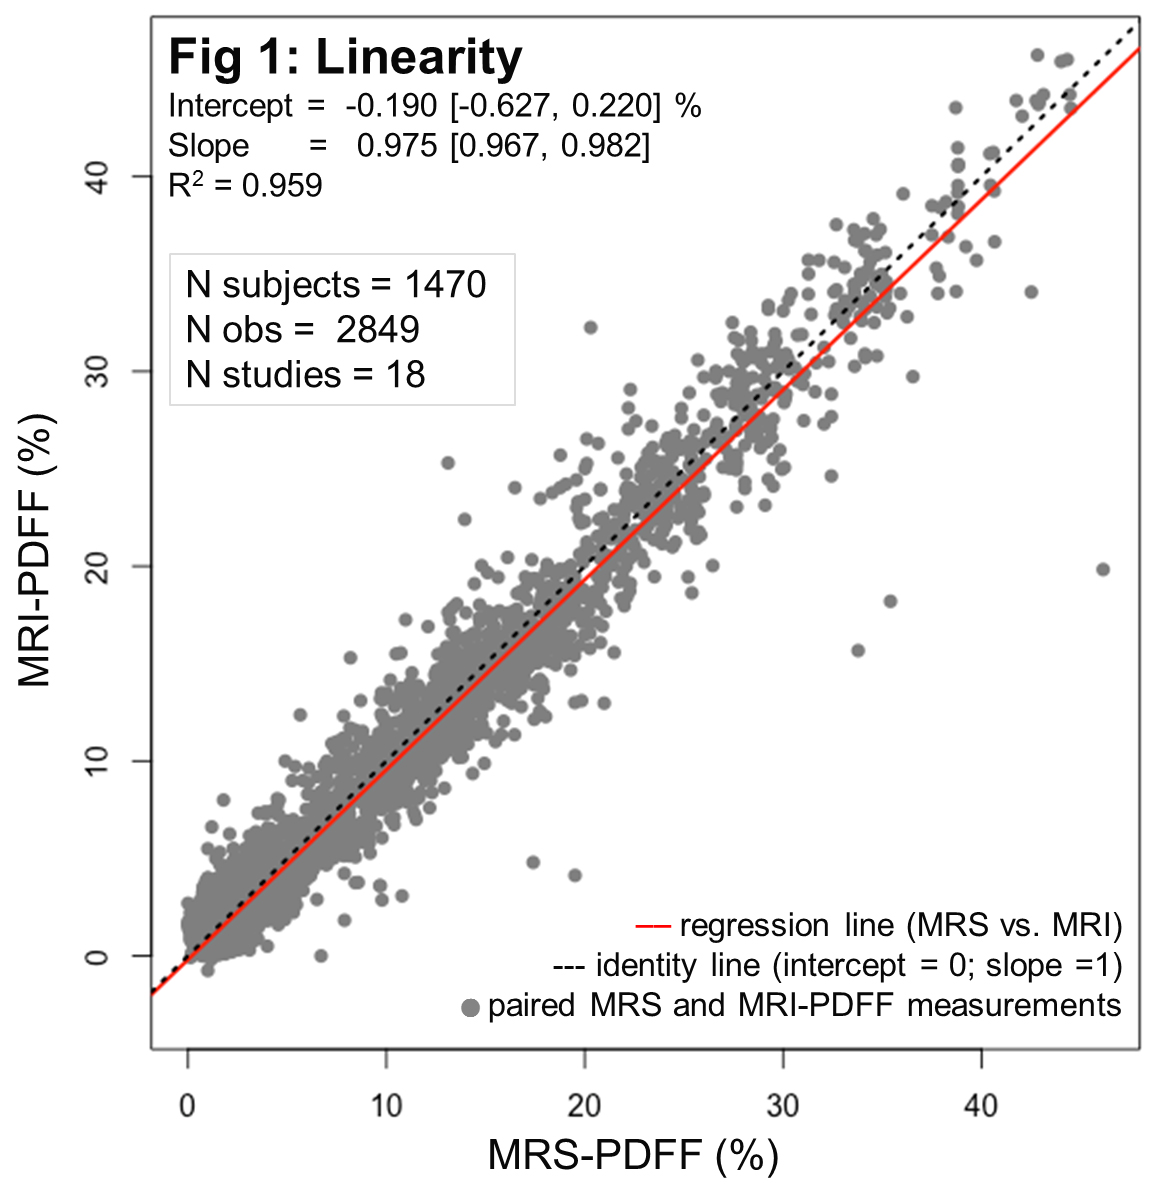
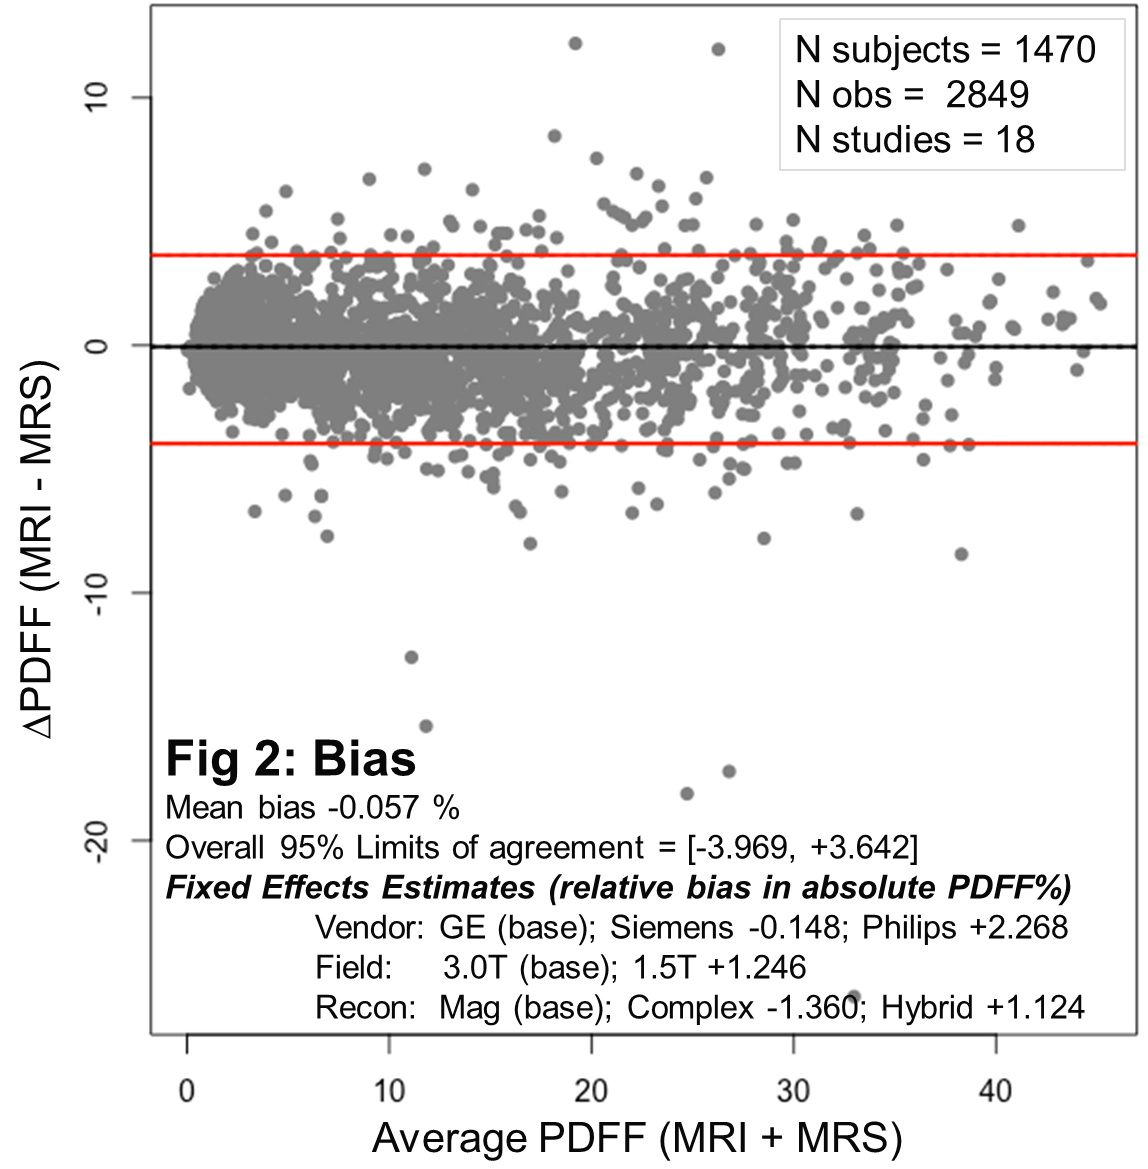
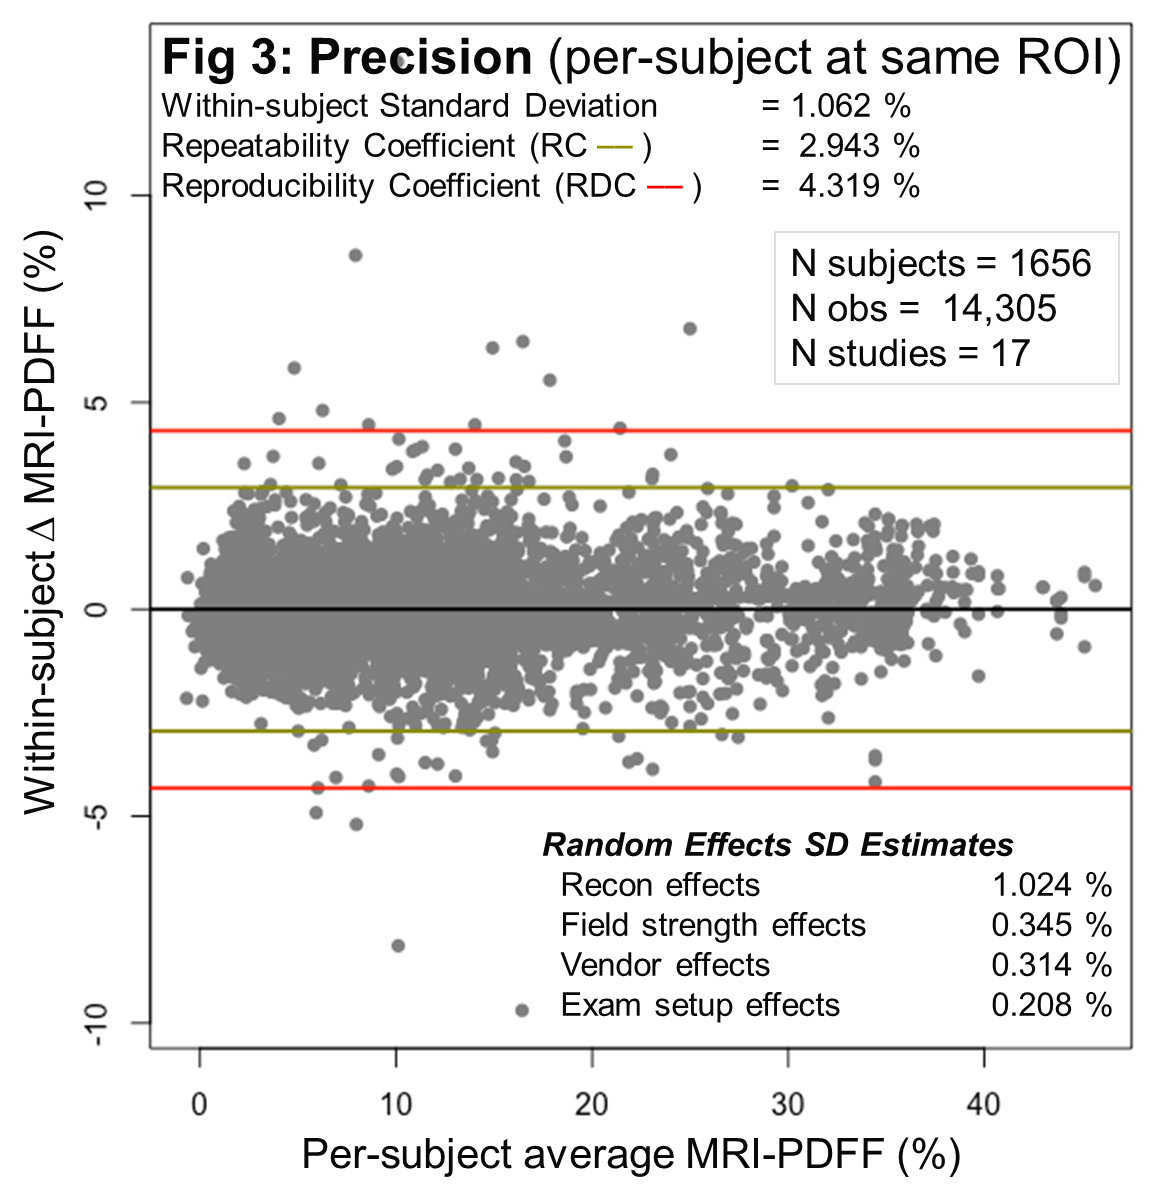
Out of 74 and 54 articles meeting the initial search criteria for the linearity/bias and precision studies, respectively, a total 23 articles were selected. All corresponding authors agreed to submit the original data sets, 21 of which were available at the time of this interim analysis [2-22]. A total of 1,470 subjects from 18 different studies were included in the linearity and bias analyses, and 1,656 subjects from 17 studies were included in the precision analysis. Figure 1 demonstrates linearity of MRI-PDFF across the entire observed MRS-PDFF range (0.0 - 46.2%); the regression intercept deviated from 0 by -0.190%, and the regression slope was smaller than unity by 0.025. Figure 2 demonstrates agreement of MRI-PDFF with MRS-PDFF with a mean bias of -0.057%. Overall limits of agreement were about ±4%. The vendor, field strength and reconstruction algorithms demonstrated a relative bias of mostly < 2%. Figure 3 demonstrates precision of MRI-PDFF across the observed PDFF range with a repeatability coefficient of 2.9%. The reproducibility coefficient, which incorporates additional sources of variability (field strength, vendor, reconstruction, and exam-setup effects), was 4.3%.Discussion
In this meta-analysis, liver PDFF measured by MRI demonstrated excellent linearity with respect to MRS across the entire observed PDFF range. The observed slight deviation from the identity line (slope = 1, intercept = 0) in the regression analysis is unlikely to be meaningful clinically or in research studies. MRI-PDFF agreed closely with MRS-PDFF with negligible mean bias; vendor, field strength and reconstruction algorithms had only a small impact on bias. These MRI-PDFF data also demonstrate excellent repeatability and reproducibility across the observed PDFF range.Conclusion
This interim meta-analysis of liver MRI-PDFF data from multiple published studies demonstrates excellent linearity, negligible bias, and high precision across different field strengths, vendors, and reconstruction algorithms.Acknowledgements
QIBA Projects and activities have been funded in whole or in part with Federal funds from the National Institute of Biomedical Imaging and Bioengineering, National Institutes of Health, Department of Health and Human Services, under Contract Nos: HHSN 268201000050C, HHSN 268201300071C.References
1. Hamilton, G., et al., In vivo characterization of the liver fat (1)H MR spectrum. NMR Biomed, 2011. 24(7): p. 784-90.
2. Zand, K.A., et al., Accuracy of multiecho magnitude-based MRI (M-MRI) for estimation of hepatic proton density fat fraction (PDFF) in children. J Magn Reson Imaging, 2015. 42(5): p. 1223-32.
3. Yokoo, T., et al., Estimation of hepatic proton-density fat fraction by using MR imaging at 3.0 T. Radiology, 2011. 258(3): p. 749-59.
4. Vu, K.N., et al., MRI-determined liver proton density fat fraction, with MRS validation: Comparison of regions of interest sampling methods in patients with type 2 diabetes. J Magn Reson Imaging, 2016. 43(5): p. 1090-9.
5. Tyagi, A., et al., Intra- and inter-examination repeatability of magnetic resonance spectroscopy, magnitude-based MRI, and complex-based MRI for estimation of hepatic proton density fat fraction in overweight and obese children and adults. Abdom Imaging, 2015. 40(8): p. 3070-7.
6. Sofue, K., et al., Interexamination repeatability and spatial heterogeneity of liver iron and fat quantification using MRI-based multistep adaptive fitting algorithm. J Magn Reson Imaging, 2015. 42(5): p. 1281-90.
7. Rehm, J.L., et al., Proton density fat-fraction is an accurate biomarker of hepatic steatosis in adolescent girls and young women. Eur Radiol, 2015. 25(10): p. 2921-30.
8. Negrete, L.M., et al., Inter-examination precision of magnitude-based MRI for estimation of segmental hepatic proton density fat fraction in obese subjects. J Magn Reson Imaging, 2014. 39(5): p. 1265-71.
9. Motosugi, U., et al., Quantification of liver fat with respiratory-gated quantitative chemical shift encoded MRI. J Magn Reson Imaging, 2015. 42(5): p. 1241-8.
10. Meisamy, S., et al., Quantification of hepatic steatosis with T1-independent, T2-corrected MR imaging with spectral modeling of fat: blinded comparison with MR spectroscopy. Radiology, 2011. 258(3): p. 767-75.
11. Mashhood, A., et al., Reproducibility of hepatic fat fraction measurement by magnetic resonance imaging. J Magn Reson Imaging, 2013. 37(6): p. 1359-70.
12. Levin, Y.S., et al., Effect of echo-sampling strategy on the accuracy of out-of-phase and in-phase multiecho gradient-echo MRI hepatic fat fraction estimation. J Magn Reson Imaging, 2014. 39(3): p. 567-75.
13. Kukuk, G.M., et al., Comparison between modified Dixon MRI techniques, MR spectroscopic relaxometry, and different histologic quantification methods in the assessment of hepatic steatosis. Eur Radiol, 2015. 25(10): p. 2869-79.
14. Kuhn, J.P., et al., T1 bias in chemical shift-encoded liver fat-fraction: role of the flip angle. J Magn Reson Imaging, 2014. 40(4): p. 875-83.
15. Kuhn, J.P., et al., Quantitative chemical shift-encoded MRI is an accurate method to quantify hepatic steatosis. J Magn Reson Imaging, 2014. 39(6): p. 1494-501.
16. Kim, K.Y., et al., Hepatic fat quantification using the proton density fat fraction (PDFF): utility of free-drawn-PDFF with a large coverage area. Radiol Med, 2015. 120(12): p. 1083-93.
17. Kang, G.H., et al., Reproducibility of MRI-determined proton density fat fraction across two different MR scanner platforms. J Magn Reson Imaging, 2011. 34(4): p. 928-34.
18. Johnson, B.L., et al., Effect of flip angle on the accuracy and repeatability of hepatic proton density fat fraction estimation by complex data-based, T1-independent, T2*-corrected, spectrum-modeled MRI. J Magn Reson Imaging, 2014. 39(2): p. 440-7.
19. Hines, C.D., et al., T(1) independent, T(2) (*) corrected chemical shift based fat-water separation with multi-peak fat spectral modeling is an accurate and precise measure of hepatic steatosis. J Magn Reson Imaging, 2011. 33(4): p. 873-81.
20. Hetterich, H., et al., Feasibility of a three-step magnetic resonance imaging approach for the assessment of hepatic steatosis in an asymptomatic study population. Eur Radiol, 2016. 26(6): p. 1895-904.
21. Bashir, M.R., et al., Quantification of hepatic steatosis with a multistep adaptive fitting MRI approach: prospective validation against MR spectroscopy. AJR Am J Roentgenol, 2015. 204(2): p. 297-306.
22. Artz, N.S., et al., Reproducibility of MR-based liver fat quantification across field strength: Same-day comparison between 1.5T and 3T in obese subjects. J Magn Reson Imaging, 2015. 42(3): p. 811-7.
Figures