0363
Free-breathing Fat Quantification in the Liver Using a Multiecho 3D Stack-of-Radial Technique: Investigation of Motion Compensation and Quantification Accuracy1Radiological Sciences, University of California Los Angeles, Los Angeles, CA, United States, 2Physics and Biology in Medicine, University of California Los Angeles, Los Angeles, CA, United States, 3Siemens Healthcare GmbH, Erlangen, Germany, 4Bioengineering, University of California Los Angeles, Los Angeles, CA, United States, 5Siemens Healthcare, Los Angeles, CA, United States
Synopsis
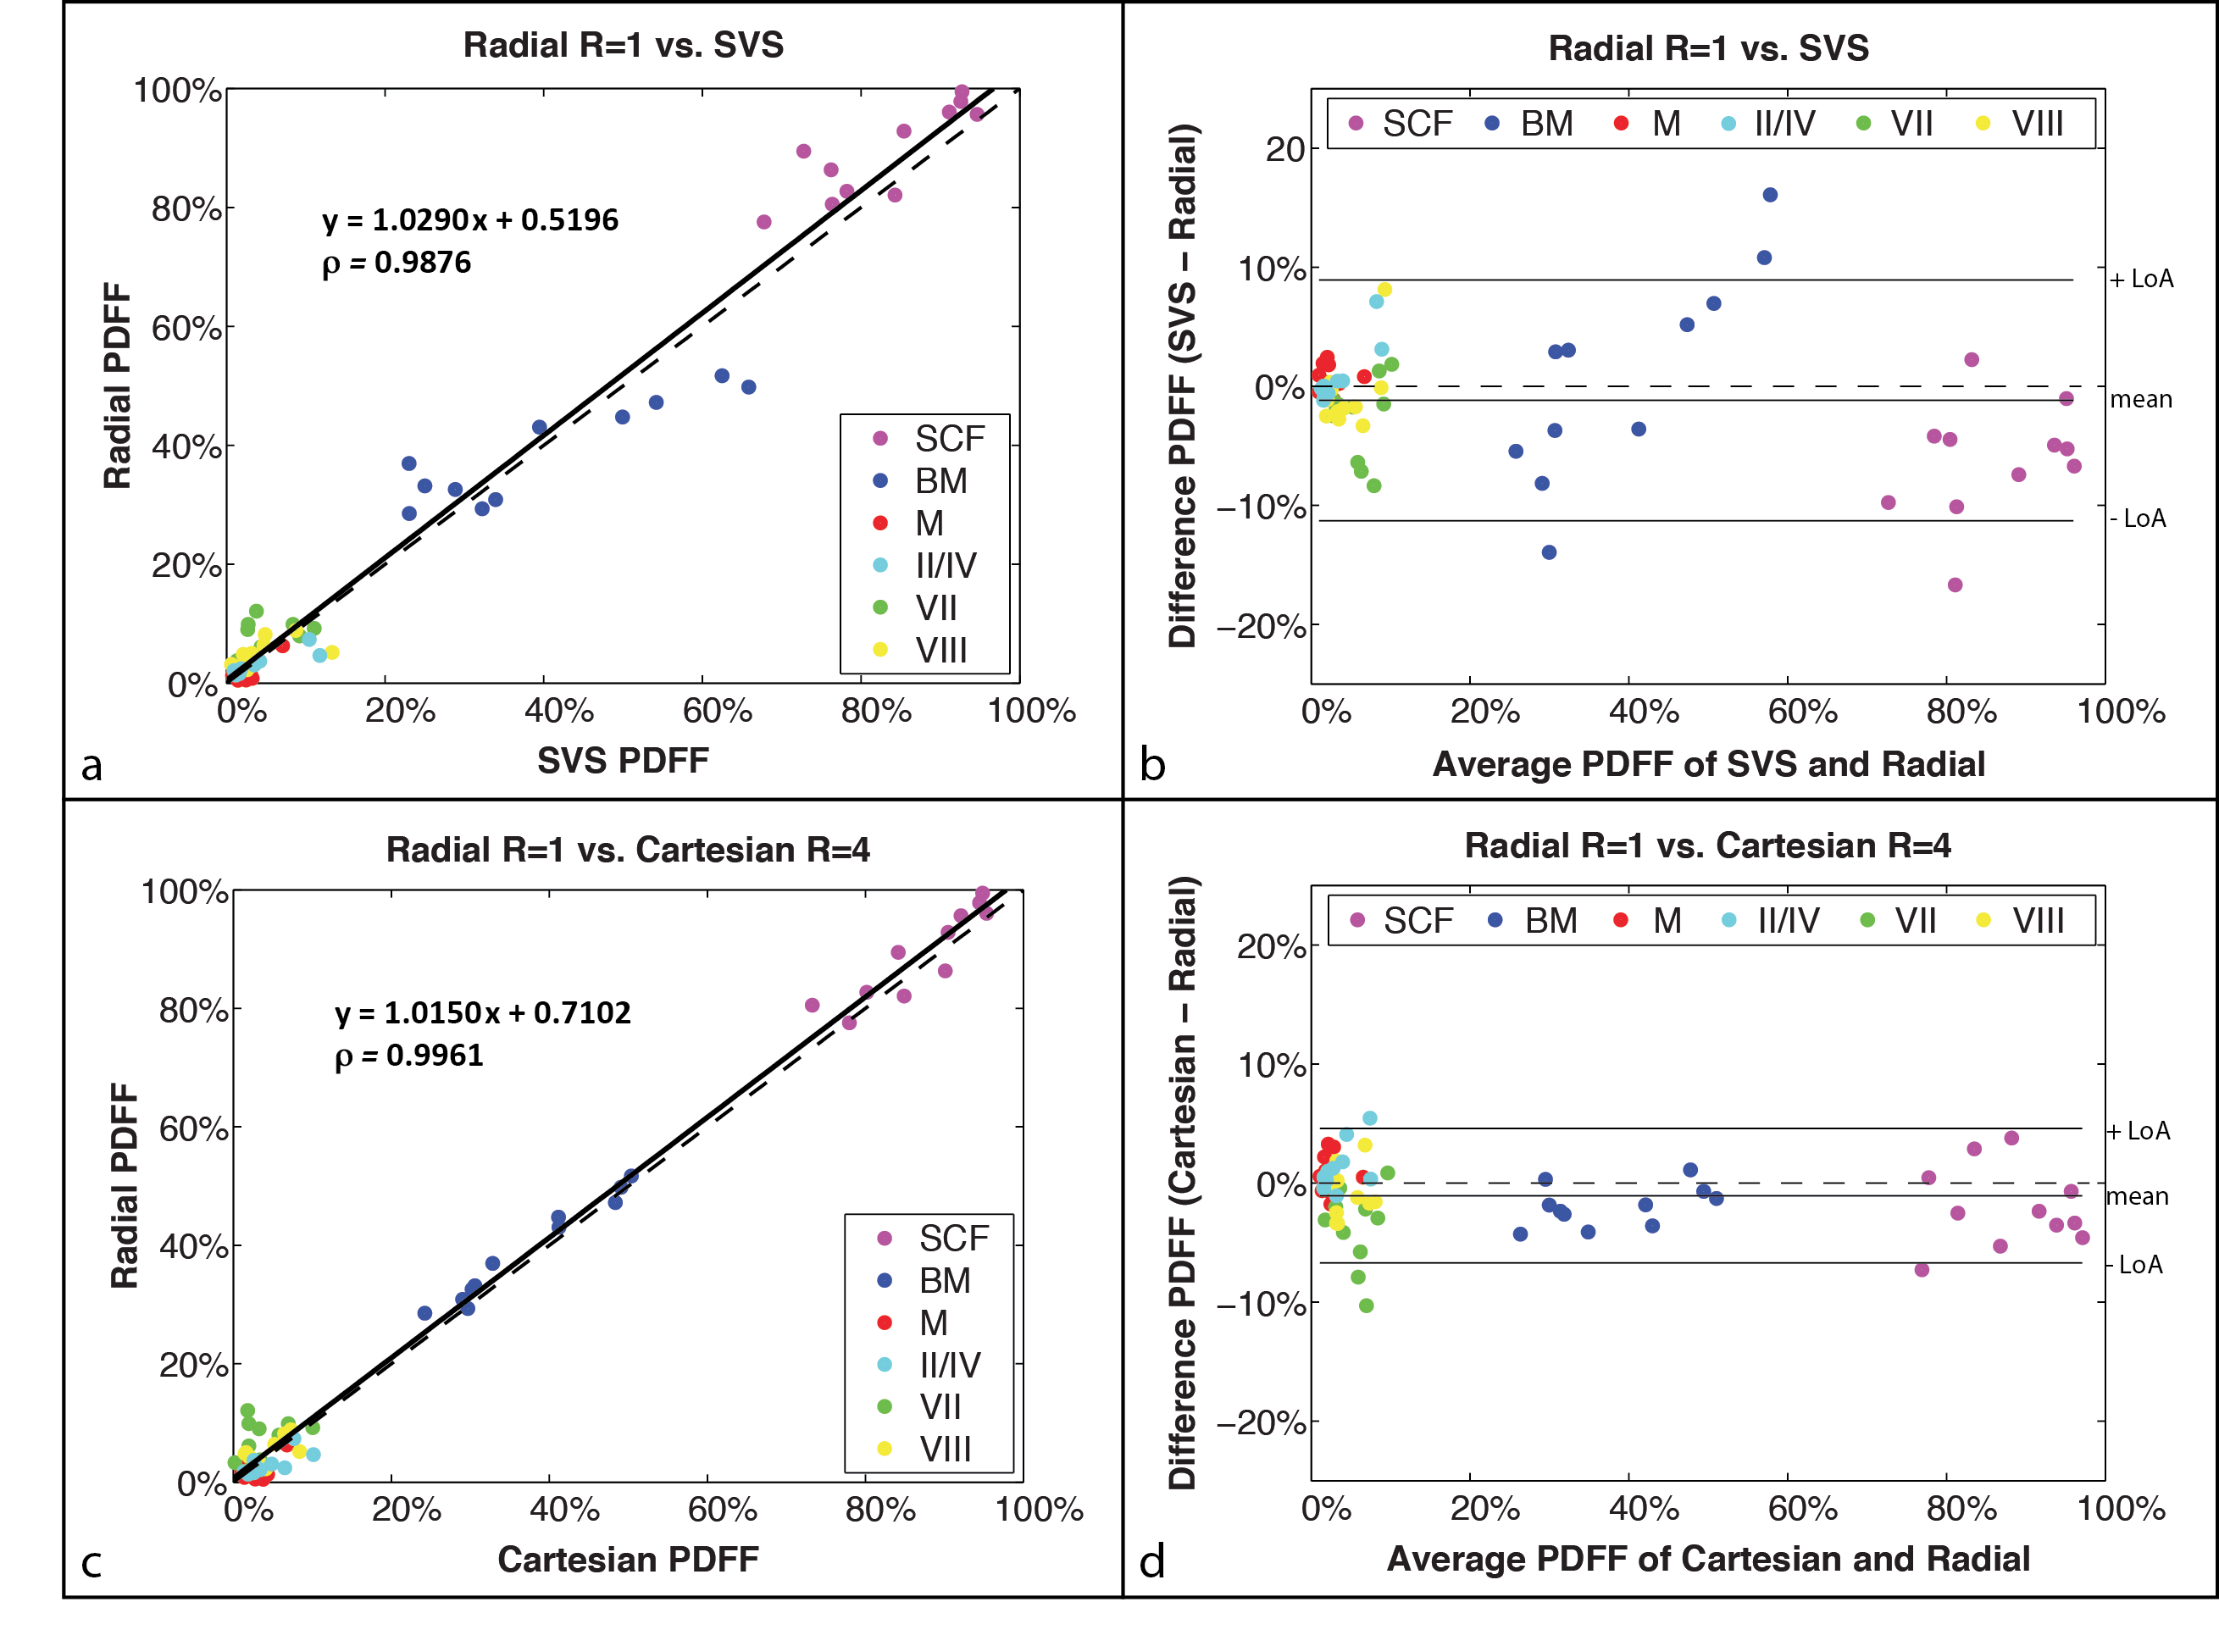
Multiecho Cartesian MRI methods can non-invasively quantify liver fat, but are susceptible to motion artifacts and limited by breath-hold (BH) imaging. We have developed a new free-breathing (FB) liver fat quantification technique using 3D stack-of-radial imaging (Radial). In this work, we further investigate motion compensation and quantification accuracy for FB Radial. In n=11 healthy volunteers, FB Radial fat quantification demonstrated significant correlation (ρ > 0.9876) and low mean difference (< -1.19%) compared to BH Cartesian and BH single-voxel spectroscopy. FB Radial can potentially achieve accurate whole-liver fat quantification with either a fast 1-2 minute scan or a 3-minute self-navigated scan.
Introduction
Non-alcoholic fatty liver disease (NAFLD) is the most prevalent chronic liver disease1–3 and can progress to cirrhosis, fibrosis, and liver failure1. The gold standard for diagnosing and monitoring NAFLD is an invasive biopsy; however, biopsy has associated morbidity and suffers from spatial sampling bias1–5. Cartesian chemical-shift-encoded MRI (CSE-MRI) methods6–8 are the non-invasive standard for 3D fat quantification in the liver; however, they are susceptible to respiratory-motion-induced coherent aliasing artifacts. Therefore, scans are performed during a breath hold (BH) and face challenges achieving full volumetric coverage, high spatial resolution, desirable echo times and artifact-free images. To overcome these limitations, a novel free-breathing (FB) multiecho 3D stack-of-radial (FB Radial) technique for fat quantification has been recently proposed9,10. In this work, we further investigate motion compensation strategies and evaluate fat quantification accuracy for FB Radial.Methods
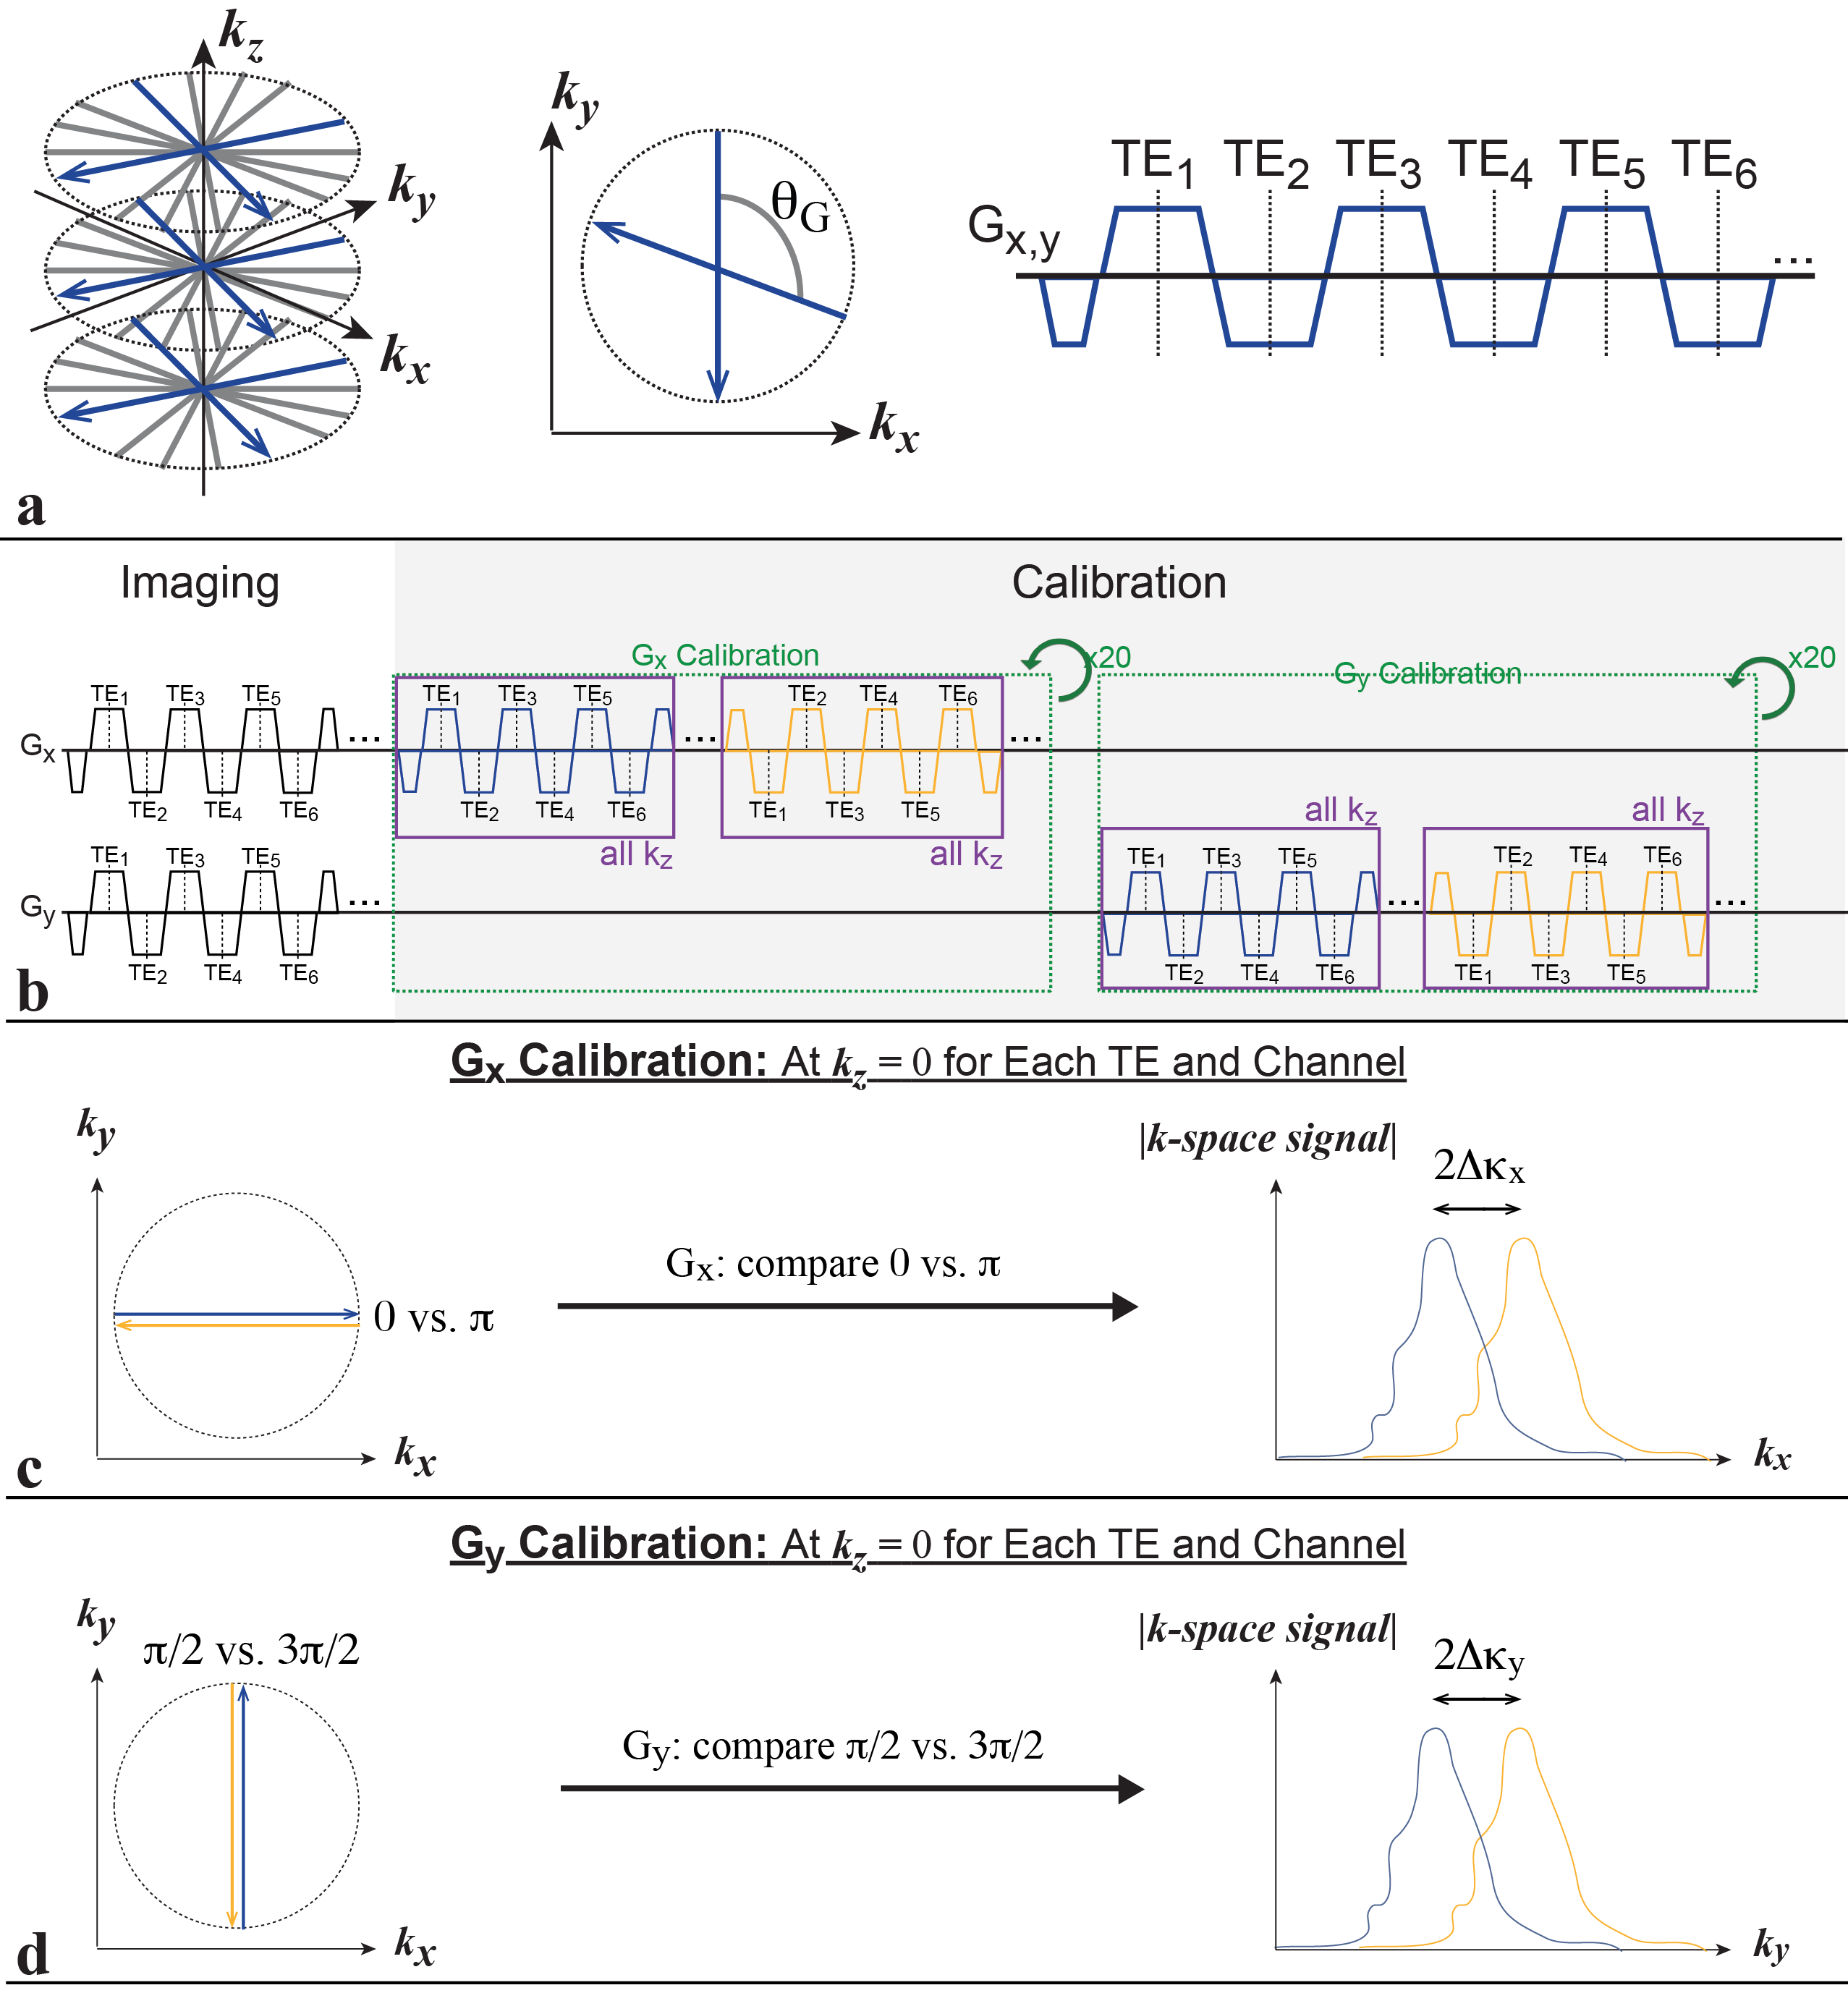
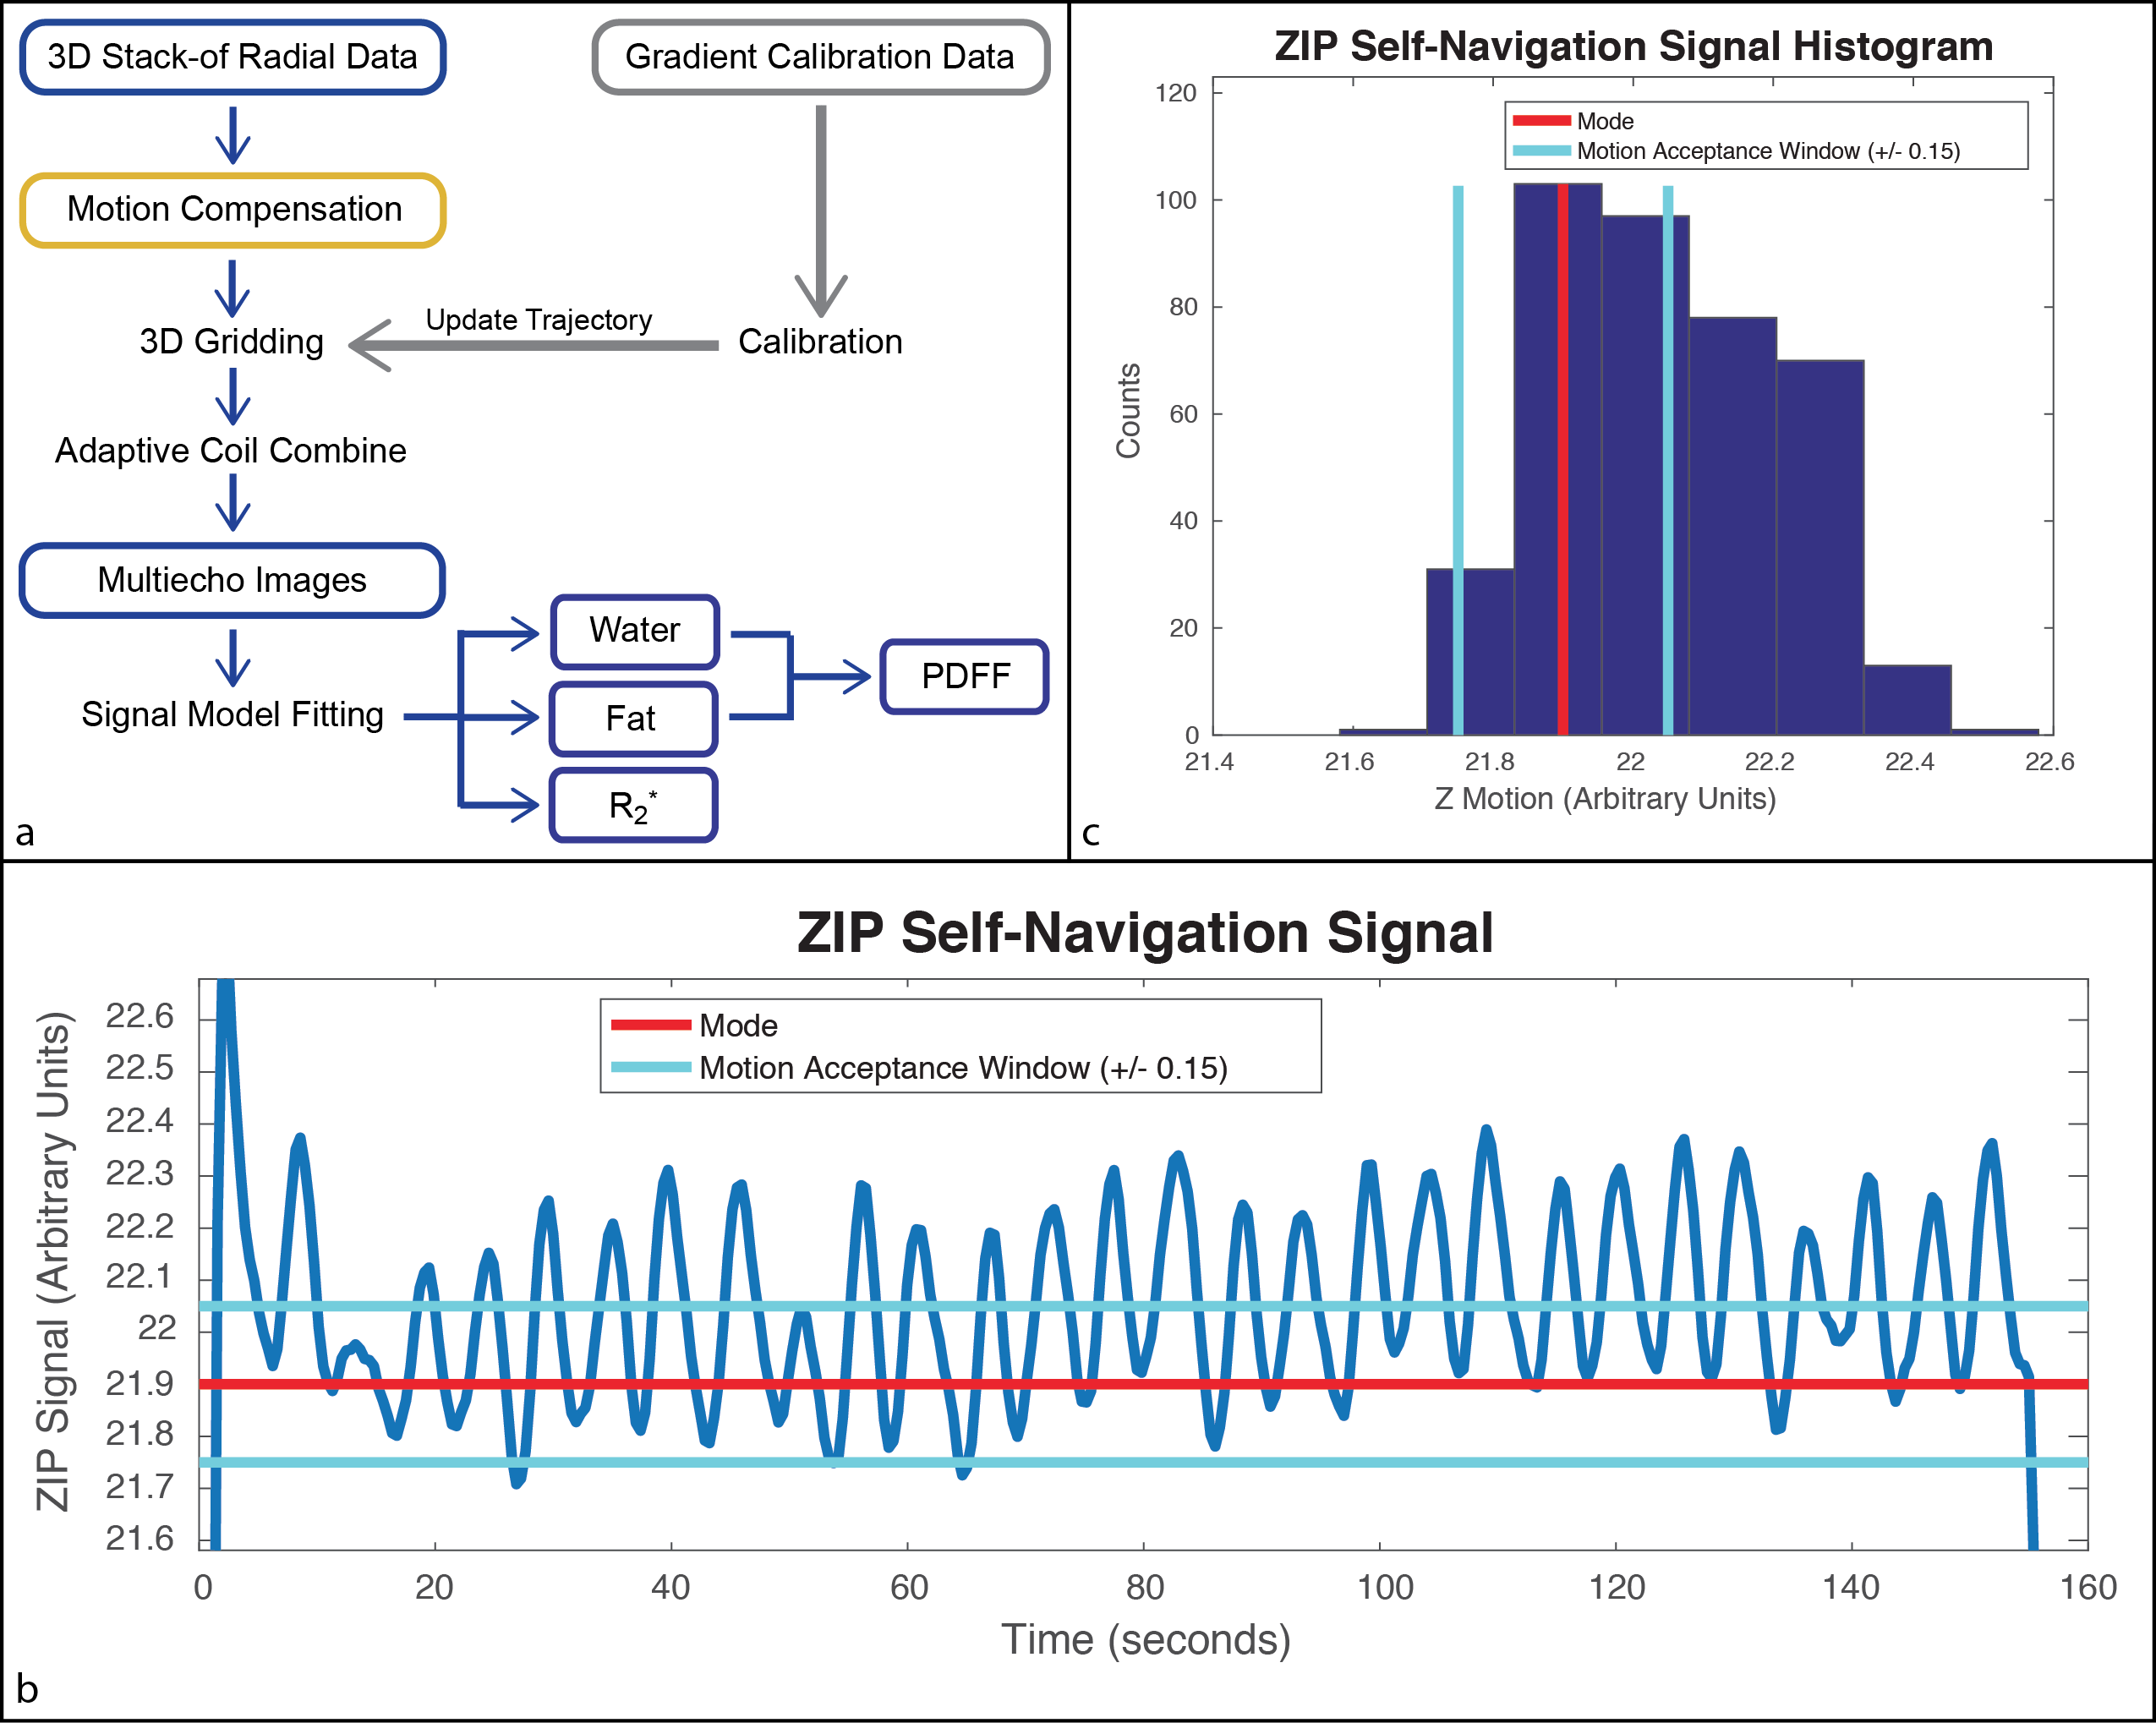
FB Radial A bipolar multiecho RF-spoiled GRE sequence using the golden-angle-ordered11 3D stack-of-radial trajectory was developed (Fig. 1a). Bipolar and radial gradient errors were measured10,12 with calibration spokes (40 for each Gx and Gy) (Fig. 1b). Motion Compensation Two strategies were explored: 1) scan acceleration to limit the degree of motion and 2) self navigation to remove motion-inconsistent data. Since golden-angle ordering allows flexible reconstruction of subsets of radial spokes, retrospective undersampling was performed to emulate acceleration factors (R) of 2- and 3-fold. Additionally, the periodically-sampled center-of-k-space line was used to calculate a self-navigation signal (Self-Nav) with Z Intensity-weighted Projection (ZIP)13. The mode of the Self-Nav was used to center a window that accepted 50% of the data from the fully-sampled scan (FB Radial Self-Nav 50%).
Reconstruction FB Radial images were reconstructed offline in Matlab (MathWorks, USA) using gradient correction10, 3D gridding, and adaptive coil combination14. Signal model fitting was performed using complex-fitting15–17, a 7-peak fat model18, and a single effective R2* per voxel19–21. Proton density fat fraction was calculated as PDFF(%)=100% x Fat/(Fat + Water) with magnitude discrimination to minimize noise bias22.
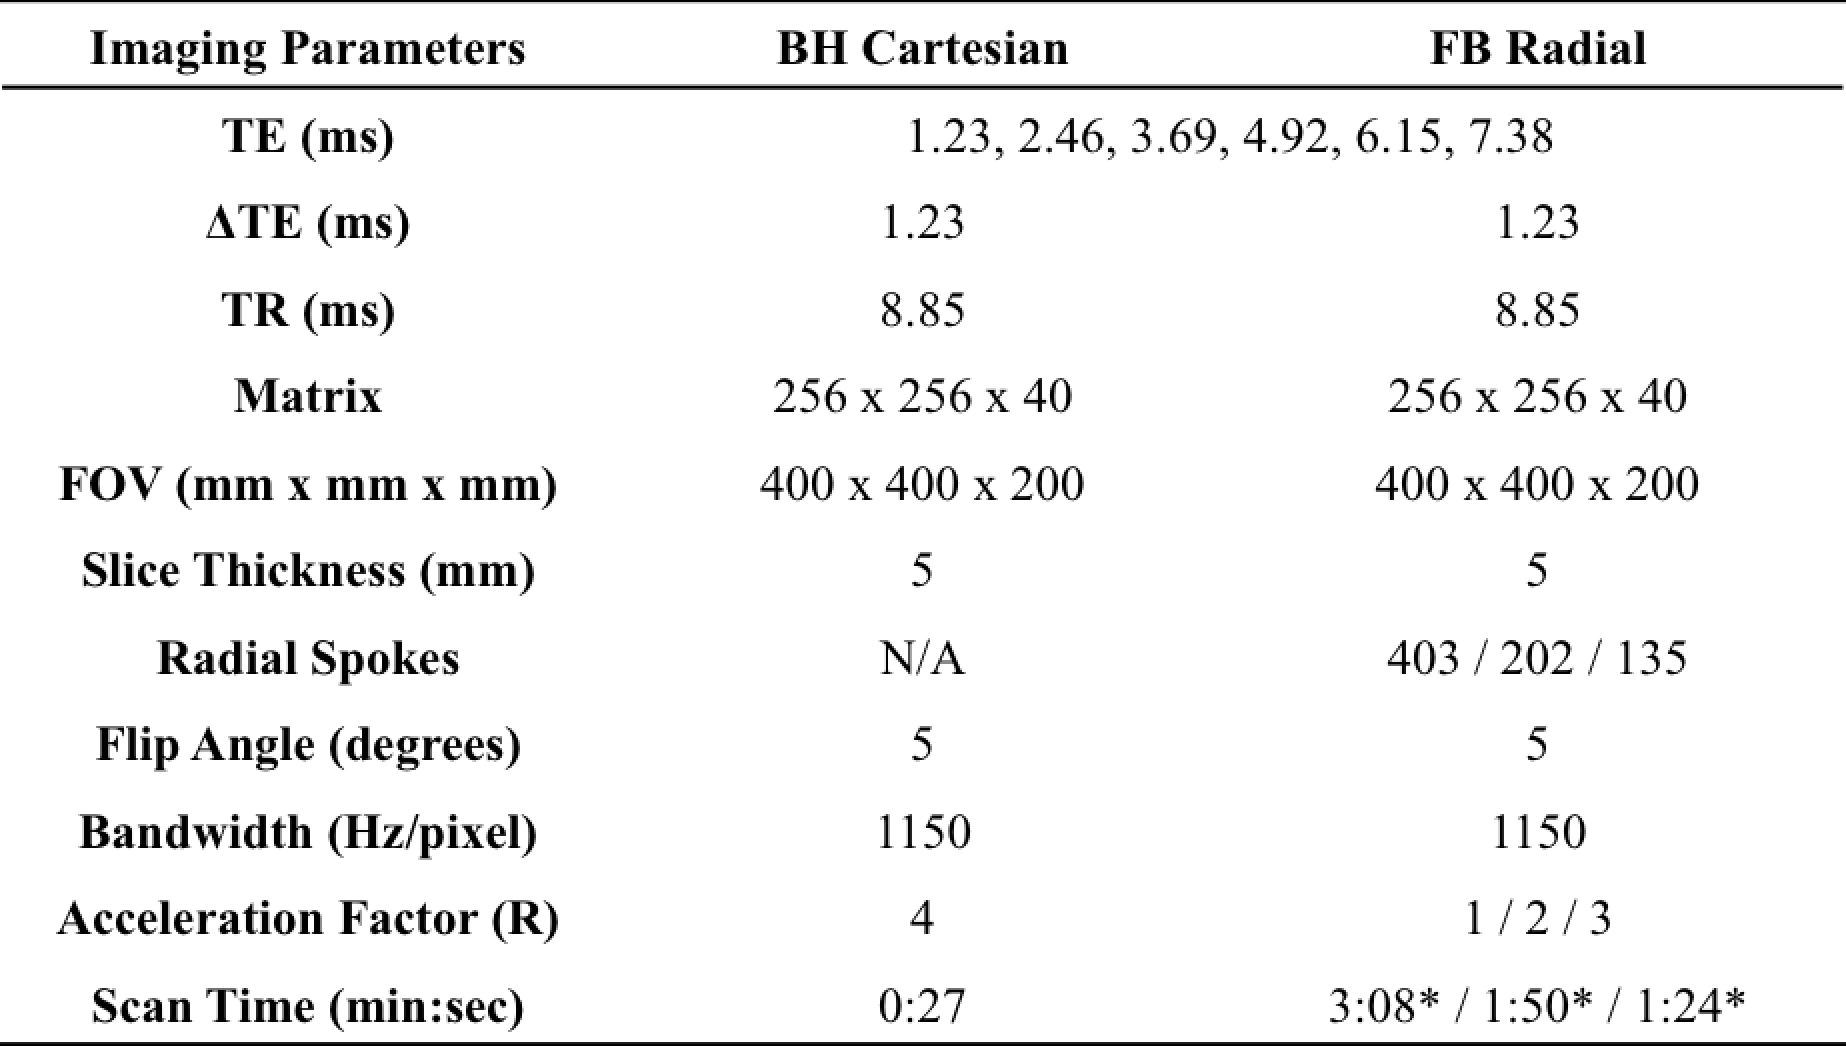
Experimental Design IRB approval and informed consent was obtained for this study. Liver scans were acquired on a 3T scanner (MAGNETOM Skyra, Siemens, Germany) using the FB Radial sequence in n=11 healthy volunteers (7 male, age 26.09 ± 2.84, BMI 23.17 ± 4.21 kg/m2). A BH 3D Cartesian sequence23 with R=4 and CAIPIRINHA17 reconstruction (BH Cartesian) and stimulated-echo acquisition mode single-voxel MR spectroscopy25 (SVS) with a 10mm x 10mm x 15mm region of interest (ROI) in the muscle, bone marrow, subcutaneous fat and in the liver26,27, were also acquired (Table 1). A body array coil was used for all acquisitions. T1 bias in PDFF was minimized using a low flip angle(22). PDFF for the BH Cartesian acquisitions were calculated by scanner software with the same signal model as FB Radial28.
Analysis ROIs were drawn on the PDFF maps to correspond to SVS ROIs using OsiriX 6.0 (Pixmeo, Switzerland). Linear correlation and Bland-Altman analysis were performed between BH SVS, BH Cartesian, and FB Radial. An ANOVA was performed to assess differences in PDFF among FB Radial R=1,2,3 and Self-Nav 50%.
Results
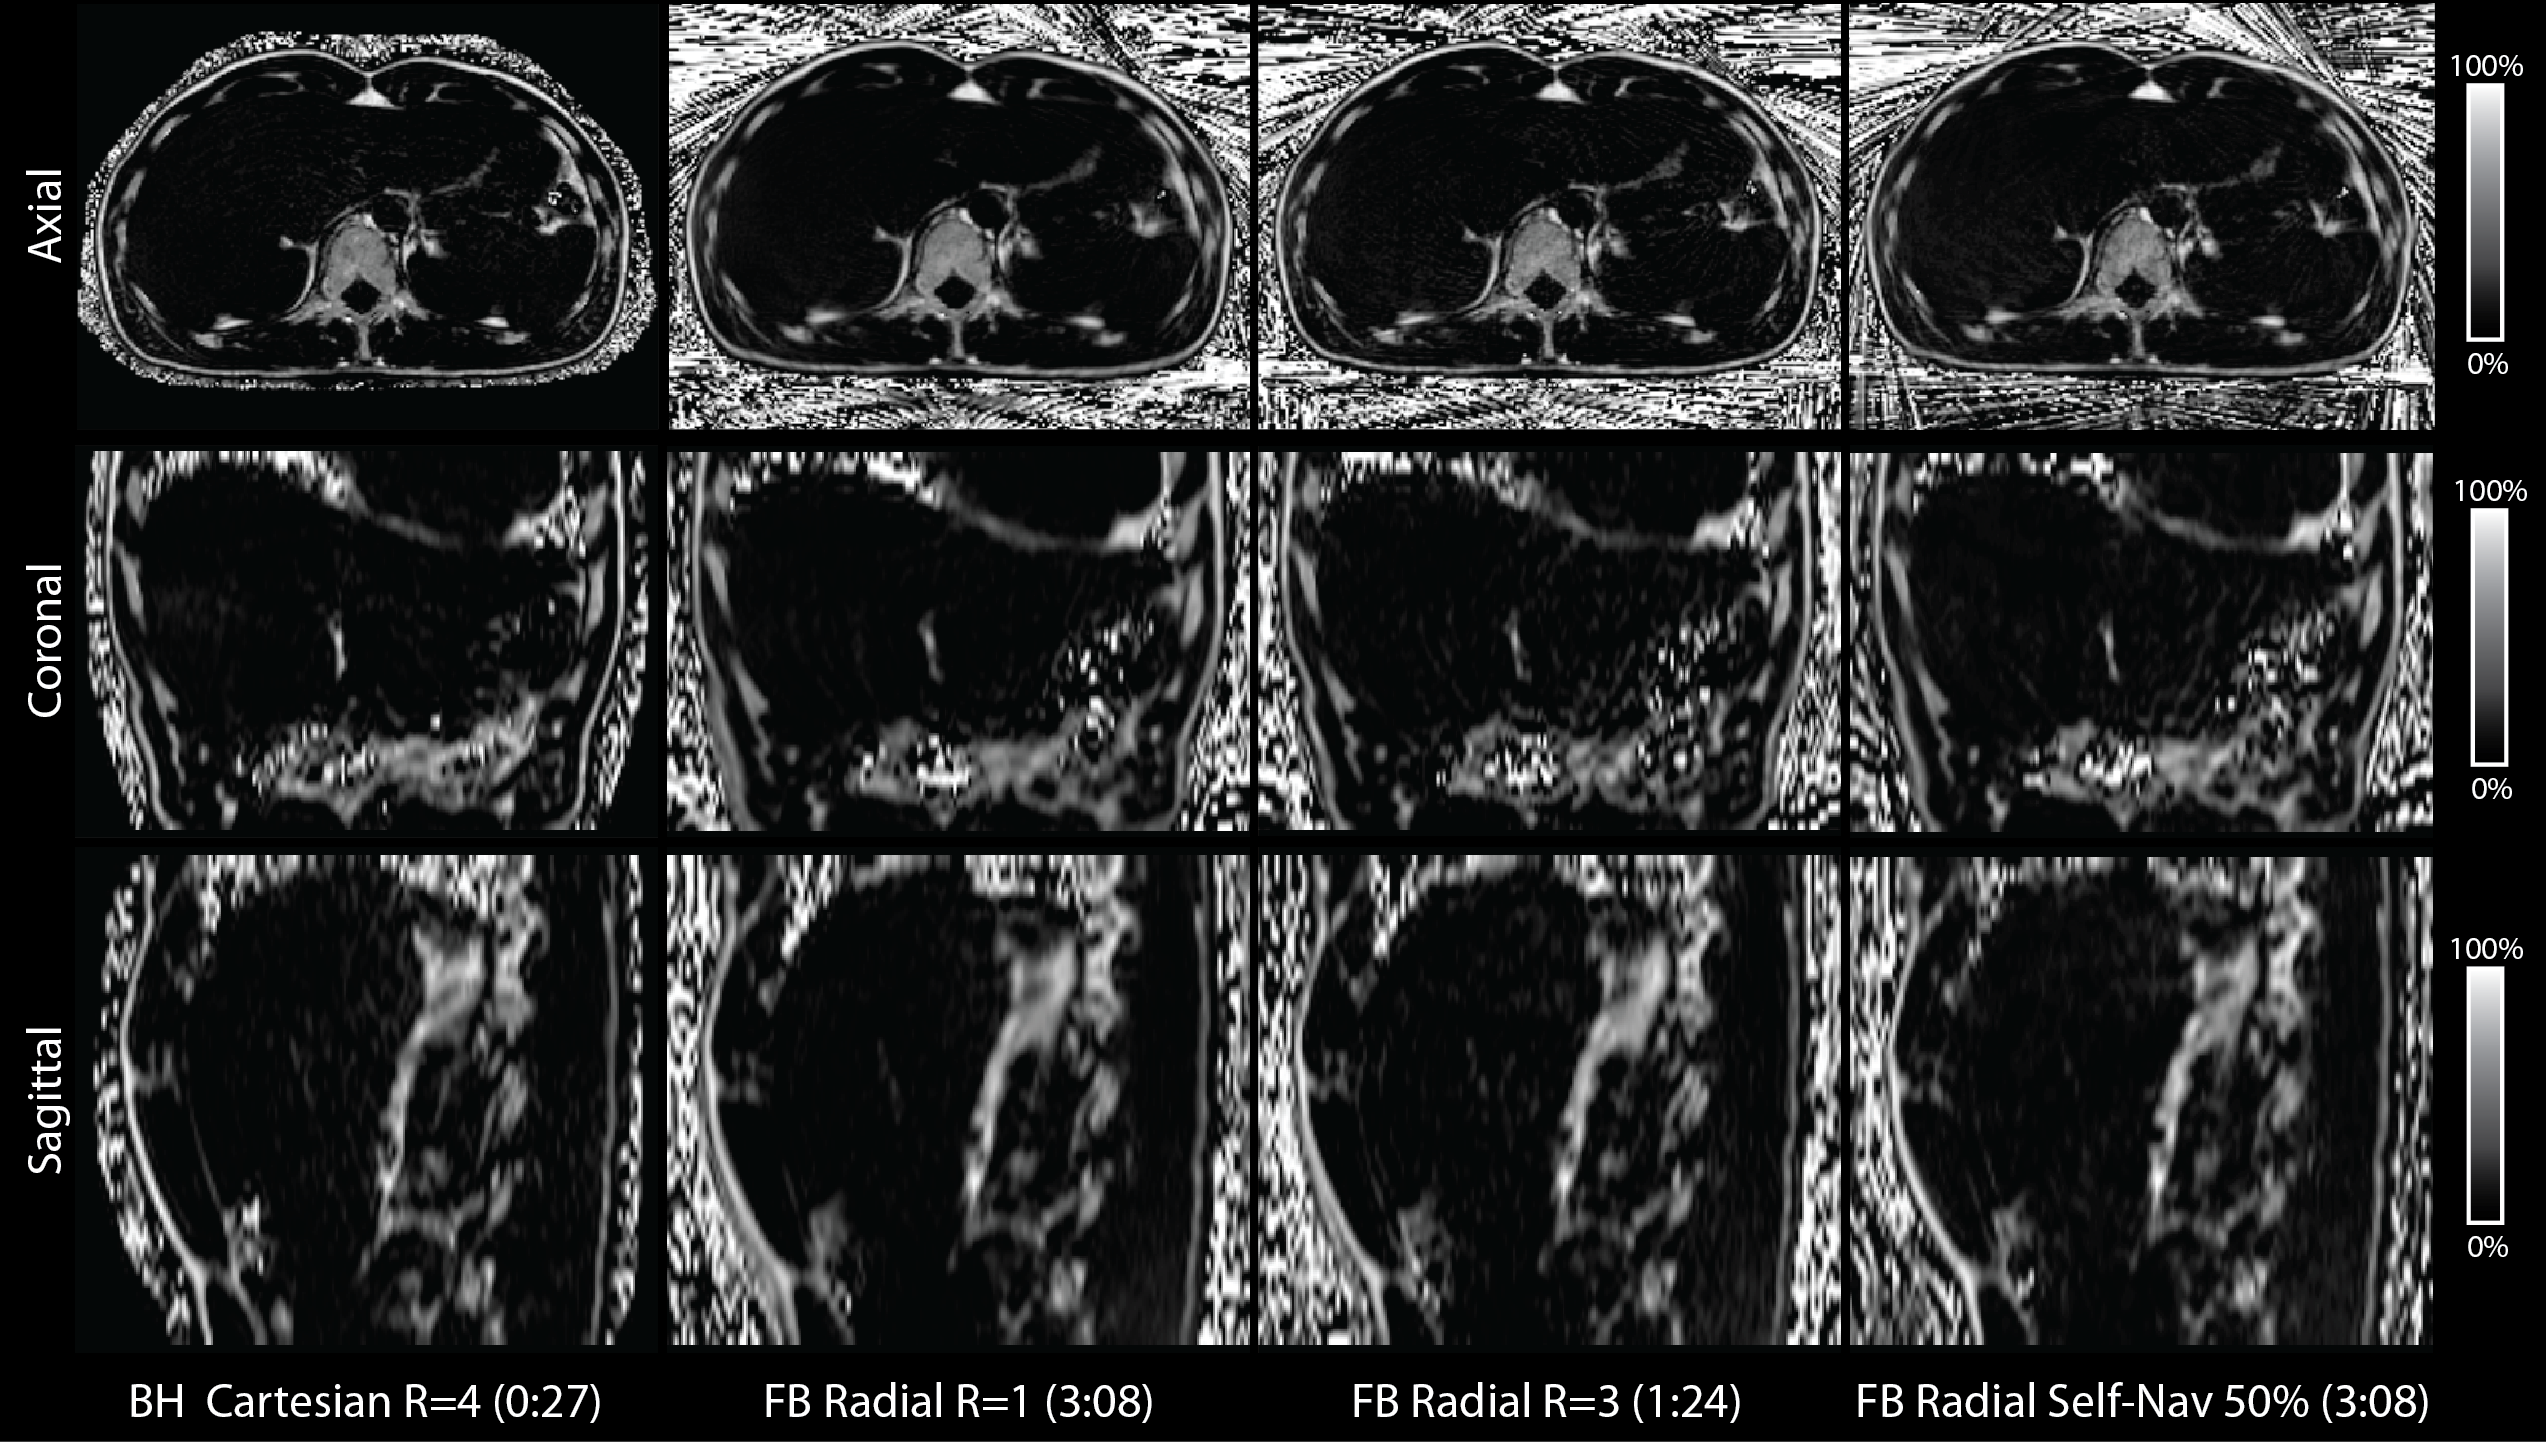
Representative PDFF maps are shown in Figure 3. There are minor differences in slice position due to changes in BH and FB positions. There was a significant linear correlation in PDFF between FB Radial R=1 versus BH SVS and BH Cartesian R=4. The Bland-Altman Analysis showed very small mean differences in PDFF between FB Radial versus BH SVS and BH Cartesian (Fig. 4). The mean PDFF among FB Radial R=1,2,3 and FB Radial Self-Nav 50% is not significantly different (ANOVA P = 0.8367).Discussion
The ANOVA analysis showed no differences in mean PDFF between FB Radial R=1,2,3 and Self-Nav 50%, therefore, each method can provide accurate fat quantification. For applications that require rapid scanning to improve patient comfort and limit motion, FB Radial R=2,3 can provide fat quantification in a one- to two-minute scan. If motion artifacts cannot be overcome with scan acceleration, the scan time can be lengthened to >3 minutes and reconstructed with self navigation. The healthy volunteers in this pilot study had regular breathing patterns and both motion compensation strategies achieved equivalent accuracy. In patients with irregular breathing patterns, self navigation may demonstrate an advantage. Further work will combine acceleration with self navigation and evaluate fat quantification accuracy in patients.Conclusion
We have demonstrated 3D fat quantification of the entire liver using a new FB Radial technique with motion compensation. This technique achieves significant quantitative agreement to the conventional BH Cartesian CSE-MRI and BH SVS techniques, and may improve patient compliance and fat quantification for NAFLD.Acknowledgements
The authors thank Drs. Gehard Laub, Stephan Kannengiesser, Berthold Kiefer, and Dominik Nickel at Siemens Healthcare for helpful discussions. The authors also thank Dr. Peng Hu, Ziwu Zhou, Aaron Scheffler, and Andres Saucedo at UCLA for helpful discussions. This work acknowledges the use of the ISMRM Fat-Water Toolbox (http://ismrm.org/workshops/FatWater12/data.htm). This work was supported in part by Siemens Healthcare.References
1. Rinella ME. Nonalcoholic fatty liver disease: a systematic review. JAMA 2015;313:2263–73.
2. Bellentani S, Marino M. Epidemiology and natural history of non-alcoholic fatty liver disease (NAFLD). Ann. Hepatol. 2009;8:s4–s8.
3. Vernon G, Baranova A, Younossi ZM. Systematic review: the epidemiology and natural history of non-alcoholic fatty liver disease and non-alcoholic steatohepatitis in adults. Aliment. Pharmacol. Ther. 2011;34:274–285.
4. Than NN, Newsome PN. A concise review of non-alcoholic fatty liver disease. Atherosclerosis 2015;239:192–202.
5. Ratziu V, Charlotte F, Heurtier A, Gombert S, Giral P, Bruckert E, Grimaldi A, Capron F, Poynard T. Sampling variability of liver biopsy in nonalcoholic fatty liver disease. Gastroenterology 2005;128:1898–1906.
6. Bydder M, Yokoo T, Hamilton G, Middleton MS, Chavez AD, Schwimmer JB, Lavine JE, Sirlin CB. Relaxation effects in the quantification of fat using gradient echo imaging. Magn. Reson. Imaging 2008;26:347–359.
7. Ma J. Dixon techniques for water and fat imaging. J. Magn. Reson. Imaging 2008;28:543–58.
8. Yu H, McKenzie CA, Shimakawa A, Vu AT, Brau ACS, Beatty PJ, Pineda AR, Brittain JH, Reeder SB. Multiecho reconstruction for simultaneous water-fat decomposition and T2* estimation. J. Magn. Reson. Imaging 2007;26:1153–61.
9. Armstrong T, Dregely I, Han F, Zhou Z, Sung K, Peng H, Wu H. Free-breathing fat-water-separated liver MRI using a multi-echo 3D stack-of-stars technique. In: Proc. ISMRM Toronto, Canada, 2015. p. 0143.
10. Armstrong T, Stemmer A, Natsuaki Y, Wu HH. Free-breathing liver fat quantification using an undersampled multi-echo 3D stack-of-radial technique. In: Proc. ISMRM Suntec City, Singapore, 2016. p. 3837.
11. Winkelmann S, Schaeffter T, Koehler T, Eggers H, Doessel O. An optimal radial profile order based on the golden ratio for time-resolved MRI. IEEE Trans. Med. Imaging 2007;26:68–76.
12. Block K, Uecker M. Simple method for adaptive gradient-delay compensation in radial MRI. Proc. Int. Soc. Magn. Reson. Imaging 2011;19:2816.
13. Spincemaille P, Liu J, Nguyen T, Prince MR, Wang Y. Z intensity-weighted position self-respiratory gating method for free-breathing 3D cardiac CINE imaging. Magn. Reson. Imaging 2011;29:861–868.
14. Walsh DO, Gmitro AF, Marcellin MW. Adaptive reconstruction of phased array MR imagery. Magn. Reson. Med. 2000;43:682–690.
15. Hernando D, Kellman P, Haldar JP, Liang Z-P. Robust water/fat separation in the presence of large field inhomogeneities using a graph cut algorithm. Magn. Reson. Med. 2010;63:79–90.
16. ISMRM Fat Water Toolbox. 2012.
17. Gleich DF. Models and Algorithms for PageRank Sensitivity. Stanford University; 2009.
18. Ren J, Dimitrov I, Sherry AD, Malloy CR. Composition of adipose tissue and marrow fat in humans by 1H NMR at 7 Tesla. J. Lipid Res. 2008;49:2055–2062.
19. Horng DE, Hernando D, Hines CDG, Reeder SB. Comparison of R2* correction methods for accurate fat quantification in fatty liver. J. Magn. Reson. Imaging 2013;37:414–22.
20. Horng DE, Hernando D, Reeder SB. Quantification of liver fat in the presence of iron overload. J. Magn. Reson. Imaging 2016.
21. Yu H, Shimakawa A, McKenzie CA, Brodsky E, Brittain JH, Reeder SB. Multiecho water-fat separation and simultaneous R2* estimation with multifrequency fat spectrum modeling. Magn. Reson. Med. 2008;60:1122–34.
22. Liu C-Y, McKenzie C a, Yu H, Brittain JH, Reeder SB. Fat quantification with IDEAL gradient echo imaging: correction of bias from T1 and noise. Magn. Reson. Med. 2007;58:354–364.
23. Zhong X, Nickel MD, Kannengiesser SAR, Dale BM, Kiefer B, Bashir MR. Liver fat quantification using a multi-step adaptive fitting approach with multi-echo GRE imaging. Magn. Reson. Med. 2014;72:1353–1365.
24. Breuer FA, Blaimer M, Heidemann RM, Mueller MF, Griswold MA, Jakob PM. Controlled aliasing in parallel imaging results in higher acceleration (CAIPIRINHA) for multi-slice imaging. Magn. Reson. Med. 2005;53:1–8.
25. Pineda N, Sharma P, Xu Q, Hu X, Vos M, Martin DR. Measurement of hepatic lipid: high-speed T2-corrected multiecho acquisition at 1H MR spectroscopy--a rapid and accurate technique. Radiology 2009;252:568–576.
26. Bismuth H. Surgical anatomy and anatomical surgery of the liver. World J. Surg. 1982;6:3–9.
27. Couinaud C, Delmas A, Patel J. Le foie: E´tudes anatomiques et chirurgicales. Paris: Masson & Cie; 1957.
28. Zhong X, Nickel MD, Kannengiesser SAR, Dale BM, Kiefer B, Bashir MR. Liver fat quantification using a multi-step adaptive fitting approach with multi-echo GRE imaging. Magn. Reson. Med. 2014;72:1353–1365.
Figures