0362
Robust agreement between MRI and MRS hepatic proton density fat fraction despite biologically plausible variability in fat spectra in patients with nonalcoholic steatohepatitis1Liver Imaging Group, Department of Radiology, University of California, San Diego, San Diego, CA, United States, 2Computational and Applied Statistics Laboratory, University of California, San Diego, San Diego, CA, United States, 3Departments of Radiology, Medical Physics, Biomedical Engineering, Medicine, and Emergency Medicine, University of Wisconsin, Madison, Madison, WI, United States, 4NAFLD Research Center, Division of Gastroenterology, Department of Medicine, University of California, San Diego, San Diego, CA, United States
Synopsis
MRI- and MRS-based proton density fat fraction (PDFF) techniques require accurate modeling of the multi-peak spectrum of triglycerides (TG) in order to achieve accurate hepatic fat quantification. However, variations in TG spectrum may lead to quantification variability. We performed a secondary analysis of adults with biopsy-confirmed nonalcoholic steatohepatitis undergoing confounder-corrected chemical-shift-encoded 3T MRI and MRS, and calculated variant PDFF values using a range of biologically plausible spectral models. Within the range of fat fractions seen in the liver, PDFF estimation using MRI and MRS was robust to variability in the TG spectrum. Greater bias was seen when the baseline fat fraction was higher, but remained low.
Introduction
MRI-based proton density fat fraction (PDFF) is the leading imaging biomarker for noninvasive quantification of hepatic triglyceride (TG) concentration 1,2. Accurate PDFF estimation requires application of a multi-peak spectral model 3–6 derived from the TG molecular structure such as one defined by Hamilton et al. 7 This structure is characterized by three parameters: the chain length (CL), number of double bonds (NDB), and number of methylene-interrupted double bonds (NMIDB) 7. Currently, all PDFF estimation methods apply the same spectral model, implicitly assuming that the TG chemical structure is identical in all human livers. Since the TG structure may conceivably vary across individuals, with disease stage and/or over time, deviations in the actual hepatic TG spectrum compared to the pre-calibrated standard model may lead to quantification variability. The purpose of this study was to investigate the effect of varying TG spectral models on estimated hepatic PDFF values.Methods
We performed a secondary analysis of adults with biopsy-confirmed nonalcoholic steatohepatitis 8. Demographics were recorded. Enrolled patients underwent confounder-corrected chemical-shift-encoded 3T MRI and MR spectroscopy for hepatic PDFF quantification. Three regions-of-interest (ROIs) were placed on MRI source images co-localized to the MRS voxel location. PDFF values were estimated from source images using a custom algorithm with magnitude-data reconstruction. Additionally, 60 variant PDFF values were calculated from source images using alternate 6-peak spectral models that systematically varied the TG CL, NDB, and NMIDB across their biologically plausible ranges (CL from 17.35 – 17.55 in increments of 0.1, NDB from 1.9 – 2.7 in increments of 0.2, NMIDB from 0.3 – 0.7 in increments of 0.2) 9. Composite MRI-PDFF values were calculated by averaging the PDFF values in the three ROIs. A Bland-Altman analysis was performed to assess the dependency of the variation in estimated PDFF using the variant spectral models on baseline PDFF. MRS-PDFF values were corrected for each variant model by adjusting for the relative amplitudes of the 5.3 ppm and 4.2 ppm fat peaks that coincide with the water peak on MRS. The agreement between corrected MRS-PDFF and co-localized variant MRI-PDFF was assessed using linear regression over all spectral models.Results
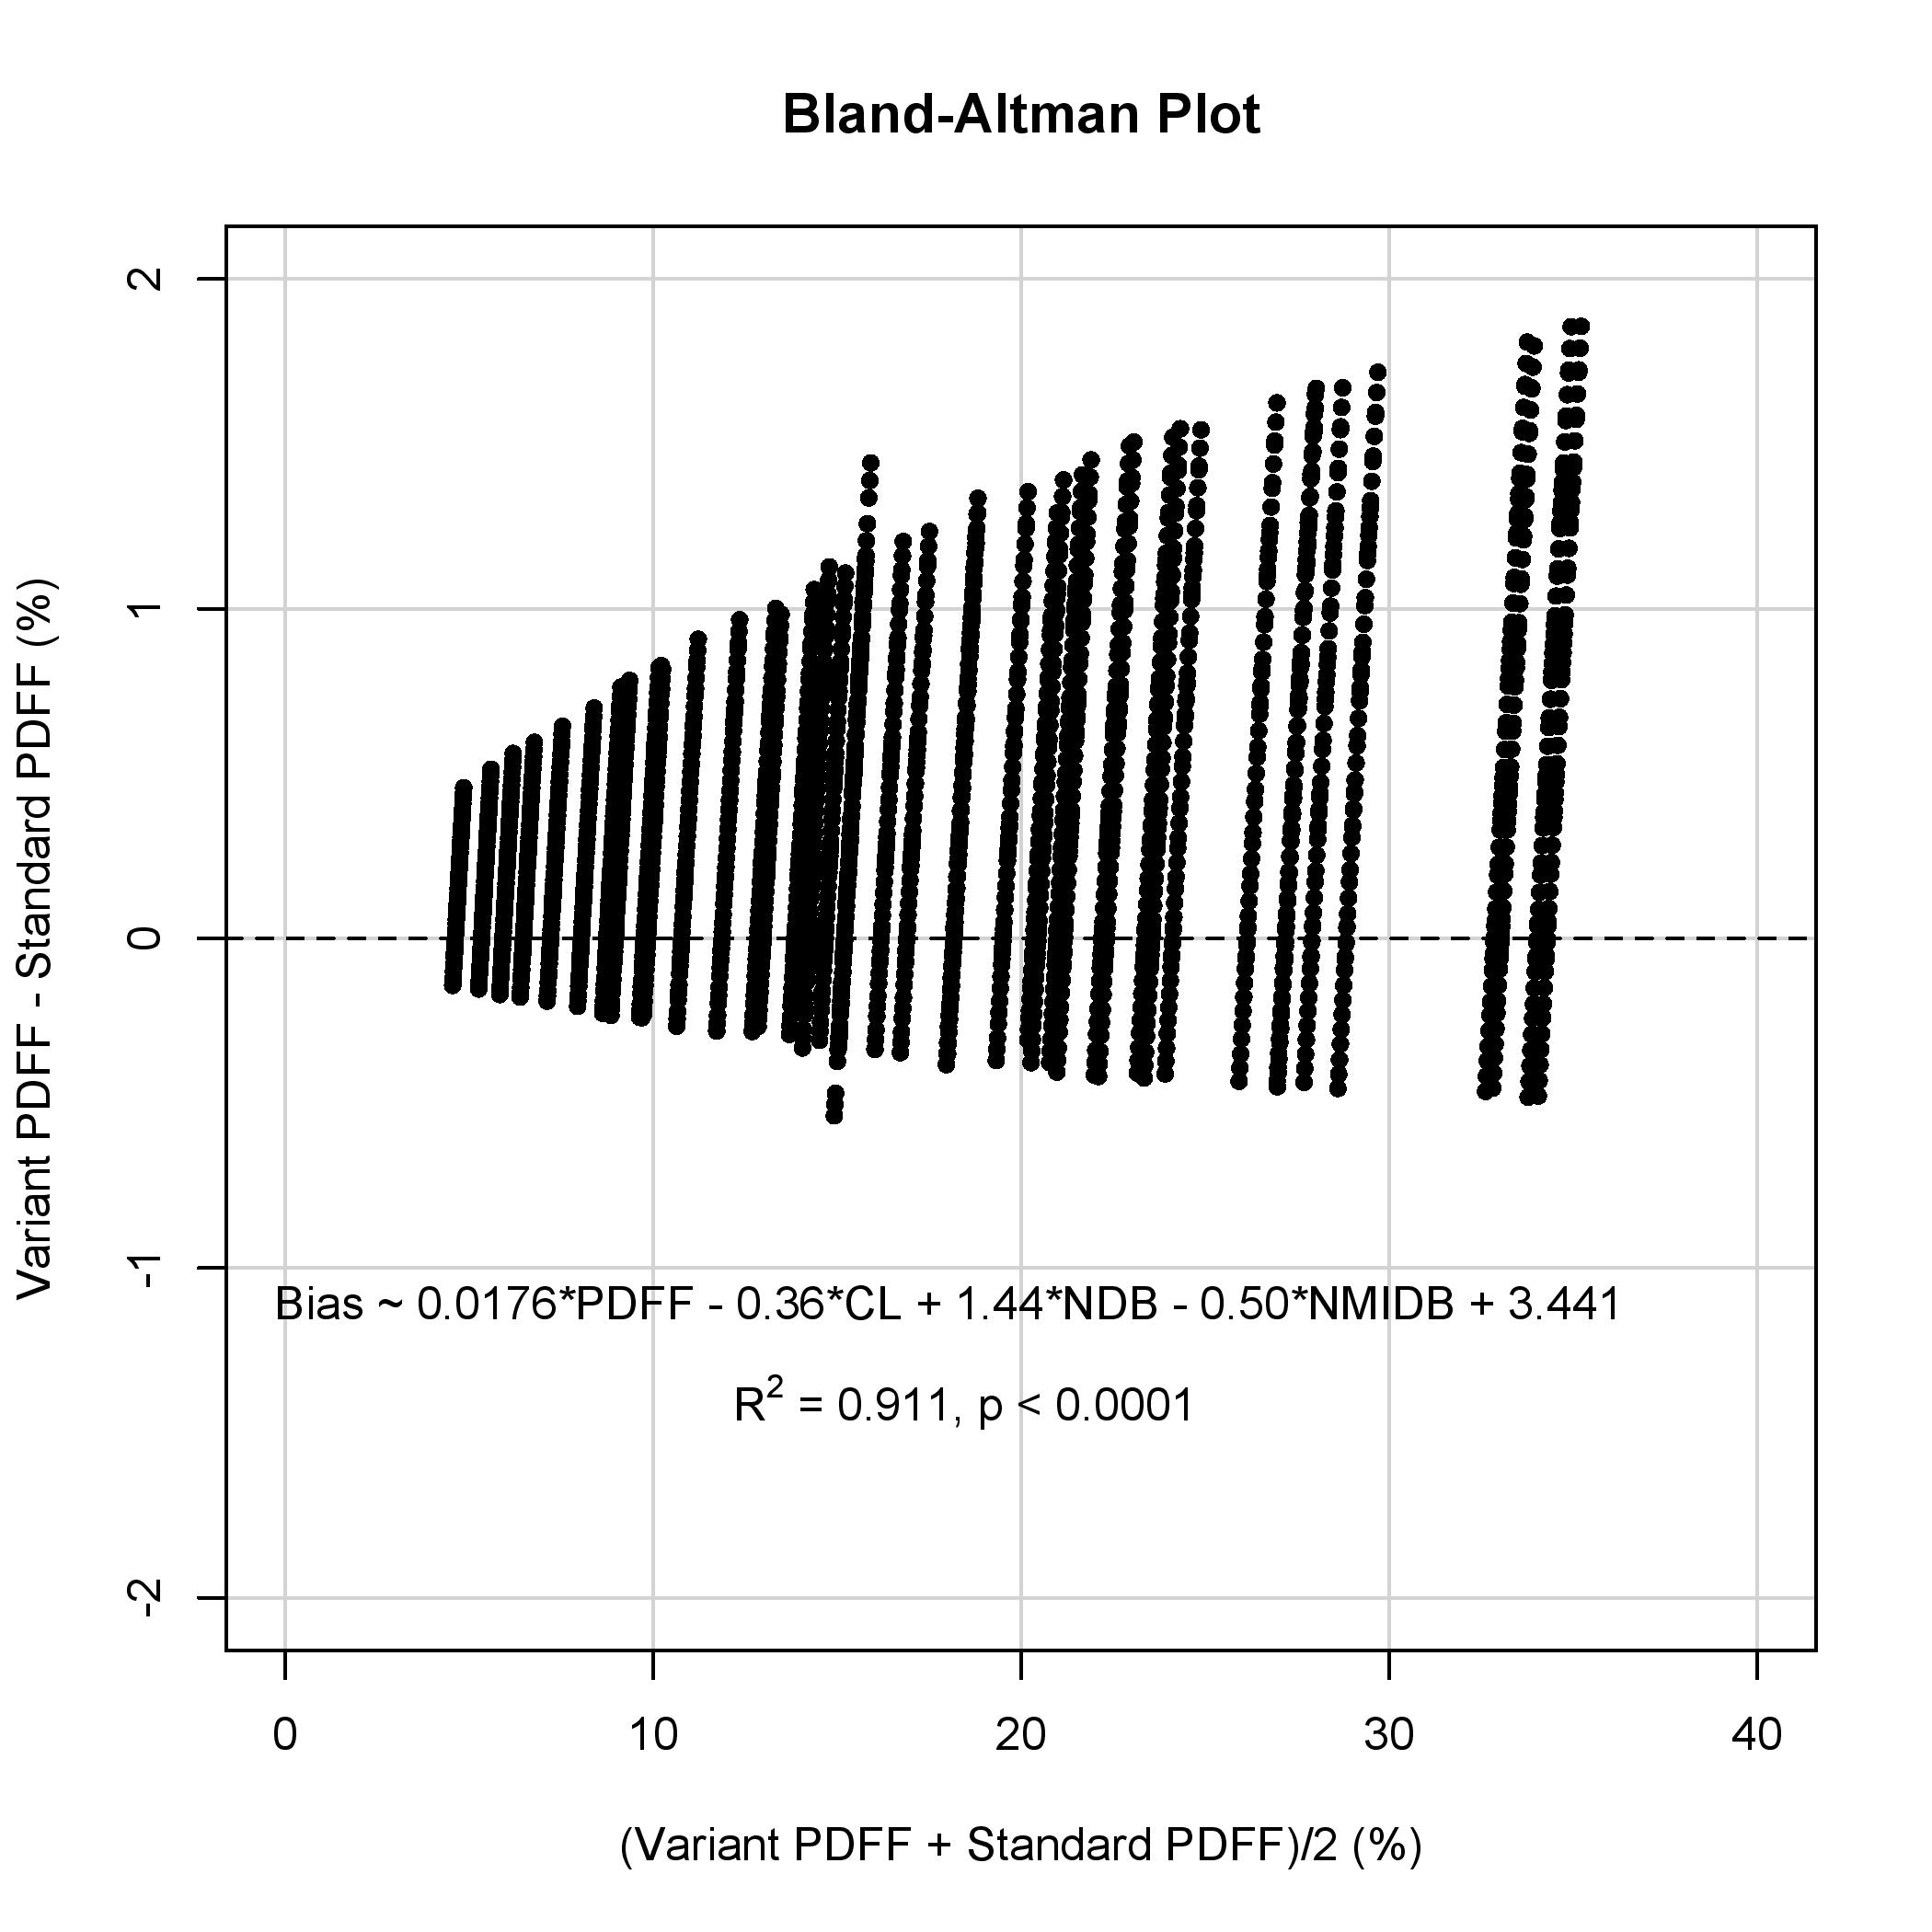
45 patients were included in the analysis (27 female, 18 male; mean age 49 years, range 19 – 75; mean MRS-PDFF 17.9 ± 8.0%, range: 4.1% – 34.3%). Variant MRI-PDFF increased with increasing NDB, but decreased with increasing CL and NMIDB. The highest and lowest mean variant MRI-PDFF values calculated over all spectral models differed by 1.5% (18.7% and 17.2% respectively). The model with the highest bias relative to the standard model had a bias of +1.2% (LOA: +0.4% to +2.0%). A Bland-Altman analysis with a linear regression using the mean of the variant and standard MRI-PDFF values, as well as model parameters, to predict the bias demonstrated that the bias increased with increasing baseline PDFF (Figure 1, R2 = 0.911, p < 0.001).
As with MRI, correction of MRS PDFF increased with increasing NDB, but decreased with increasing CL. Correction of MRS-PDFF was independent of NMIDB, as NMIDB does not affect the amplitudes of the 5.3 ppm and 4.2 ppm peaks. Mean corrected MRS-PDFF values obtained from each models ranged from 17.9% - 18.2%. For each spectral model, the mean difference between MRI-PDFF and MRS-PDFF was computed, and the range of mean differences was -0.68% to 0.50%. Linear regression between corrected MRS-PDFF and co-localized variant MRI-PDFF demonstrated very high agreement over all models (Figure 2, R2 = 0.973, p < 0.001).
Discussion
The effect of specific triglyceride spectral model on hepatic PDFF estimation using MRI and MRS is small. Over all spectral models that were generated over the biologically plausible ranges of TG parameters, the difference between the highest and lowest mean values estimated by the models was only 1.5%. The effect of varying spectral models is even smaller for MRS than for MRI. Greater bias is seen when the baseline fat fraction is higher, but remains low. Very high agreement between MRI-PDFF and MRS-PDFF was achieved regardless of the spectral model used.Conclusion
Within the range of PDFF values observed in the liver, PDFF estimation is robust to biologically plausible variability in TG spectra.Acknowledgements
No acknowledgement found.References
1. Reeder SB, Cruite I, Hamilton G, Sirlin CB. Quantitative assessment of liver fat with magnetic resonance imaging and spectroscopy. J Magn Reson Imaging 2011;34(4):729–49.
2. Reeder SB, Sirlin CB. Quantification of liver fat with magnetic resonance imaging. Magn Reson Imaging Clin N Am 2010;18(3):337–57, ix.
3. Hines CDG, Frydrychowicz A, Hamilton G, et al. T(1) independent, T(2) (*) corrected chemical shift based fat-water separation with multi-peak fat spectral modeling is an accurate and precise measure of hepatic steatosis. J Magn Reson Imaging 2011;33(4):873–81.
4. Meisamy S, Hines CDG, Hamilton G, et al. Quantification of hepatic steatosis with T1-independent, T2-corrected MR imaging with spectral modeling of fat: blinded comparison with MR spectroscopy. Radiology 2011;258(3):767–75.
5. Kühn J-P, Hernando D, Muñoz del Rio A, et al. Effect of multipeak spectral modeling of fat for liver iron and fat quantification: correlation of biopsy with MR imaging results. Radiology 2012;265(1):133–42.
6. Wang X, Hernando D, Reeder SB. Sensitivity of chemical shift-encoded fat quantification to calibration of fat MR spectrum. Magn Reson Med 2016;75(2):845–51.
7. Hamilton G, Yokoo T, Bydder M, et al. In vivo characterization of the liver fat 1H MR spectrum. NMR Biomed 2011;24(7):784–90.
8. Loomba R, Sirlin CB, Ang B, et al. Ezetimibe for the treatment of nonalcoholic steatohepatitis: assessment by novel magnetic resonance imaging and magnetic resonance elastography in a randomized trial (MOZART trial). Hepatology 2015;61(4):1239–50.
9. Hamilton G, Schlein AN, Middleton MS, et al. In vivo triglyceride composition of abdominal adipose tissue measured by (1) H MRS at 3T. J Magn Reson Imaging 2016;
Figures