0360
A Method for Quantitative Cerebrovascular Reserve1Northwestern University, Evanston, IL, United States, 2University of Chicago, 3Northwestern University
Synopsis
In the occurrence of damage to the hemodynamic system of the brain, a response is elicited by changes in the supply of blood and oxygen to the tissue. Depending on these different changes, the severity of the hemodynamic impairment can be defined. In this study, we propose a method of accurately measuring quantitative cerebrovascular reserve. This is achieved by applying water correction factors to multiple contrast-agent injection cerebral blood flow measurements. In multiple studies involving volunteers, animal model, and patients, we confirm the correction factors and compare against microsphere perfusion.
Introduction
The severity of hemodynamic compromise in the brain is modeled by 3-stage models independently developed by Derdeyn1 and Nemoto2. These stages of severity are reflected by changes in the cerebral blood volume (CBV), cerebral blood flow (CBF), oxygen extraction fraction (OEF) and cerebrovascular reserve (CVR). Quantitatively measuring these values provides better information in determining the stage and the severity. In this study, we develop a method to calculate absolute quantitative CVR maps in a clinical setting using Dynamic Susceptibility Contrast (DSC) MR perfusion scans and Acetazolamide (ACZ) challenge. Further, we show the different stages of hemodynamic compromise reflected by the changes in measured local CVR.Methods
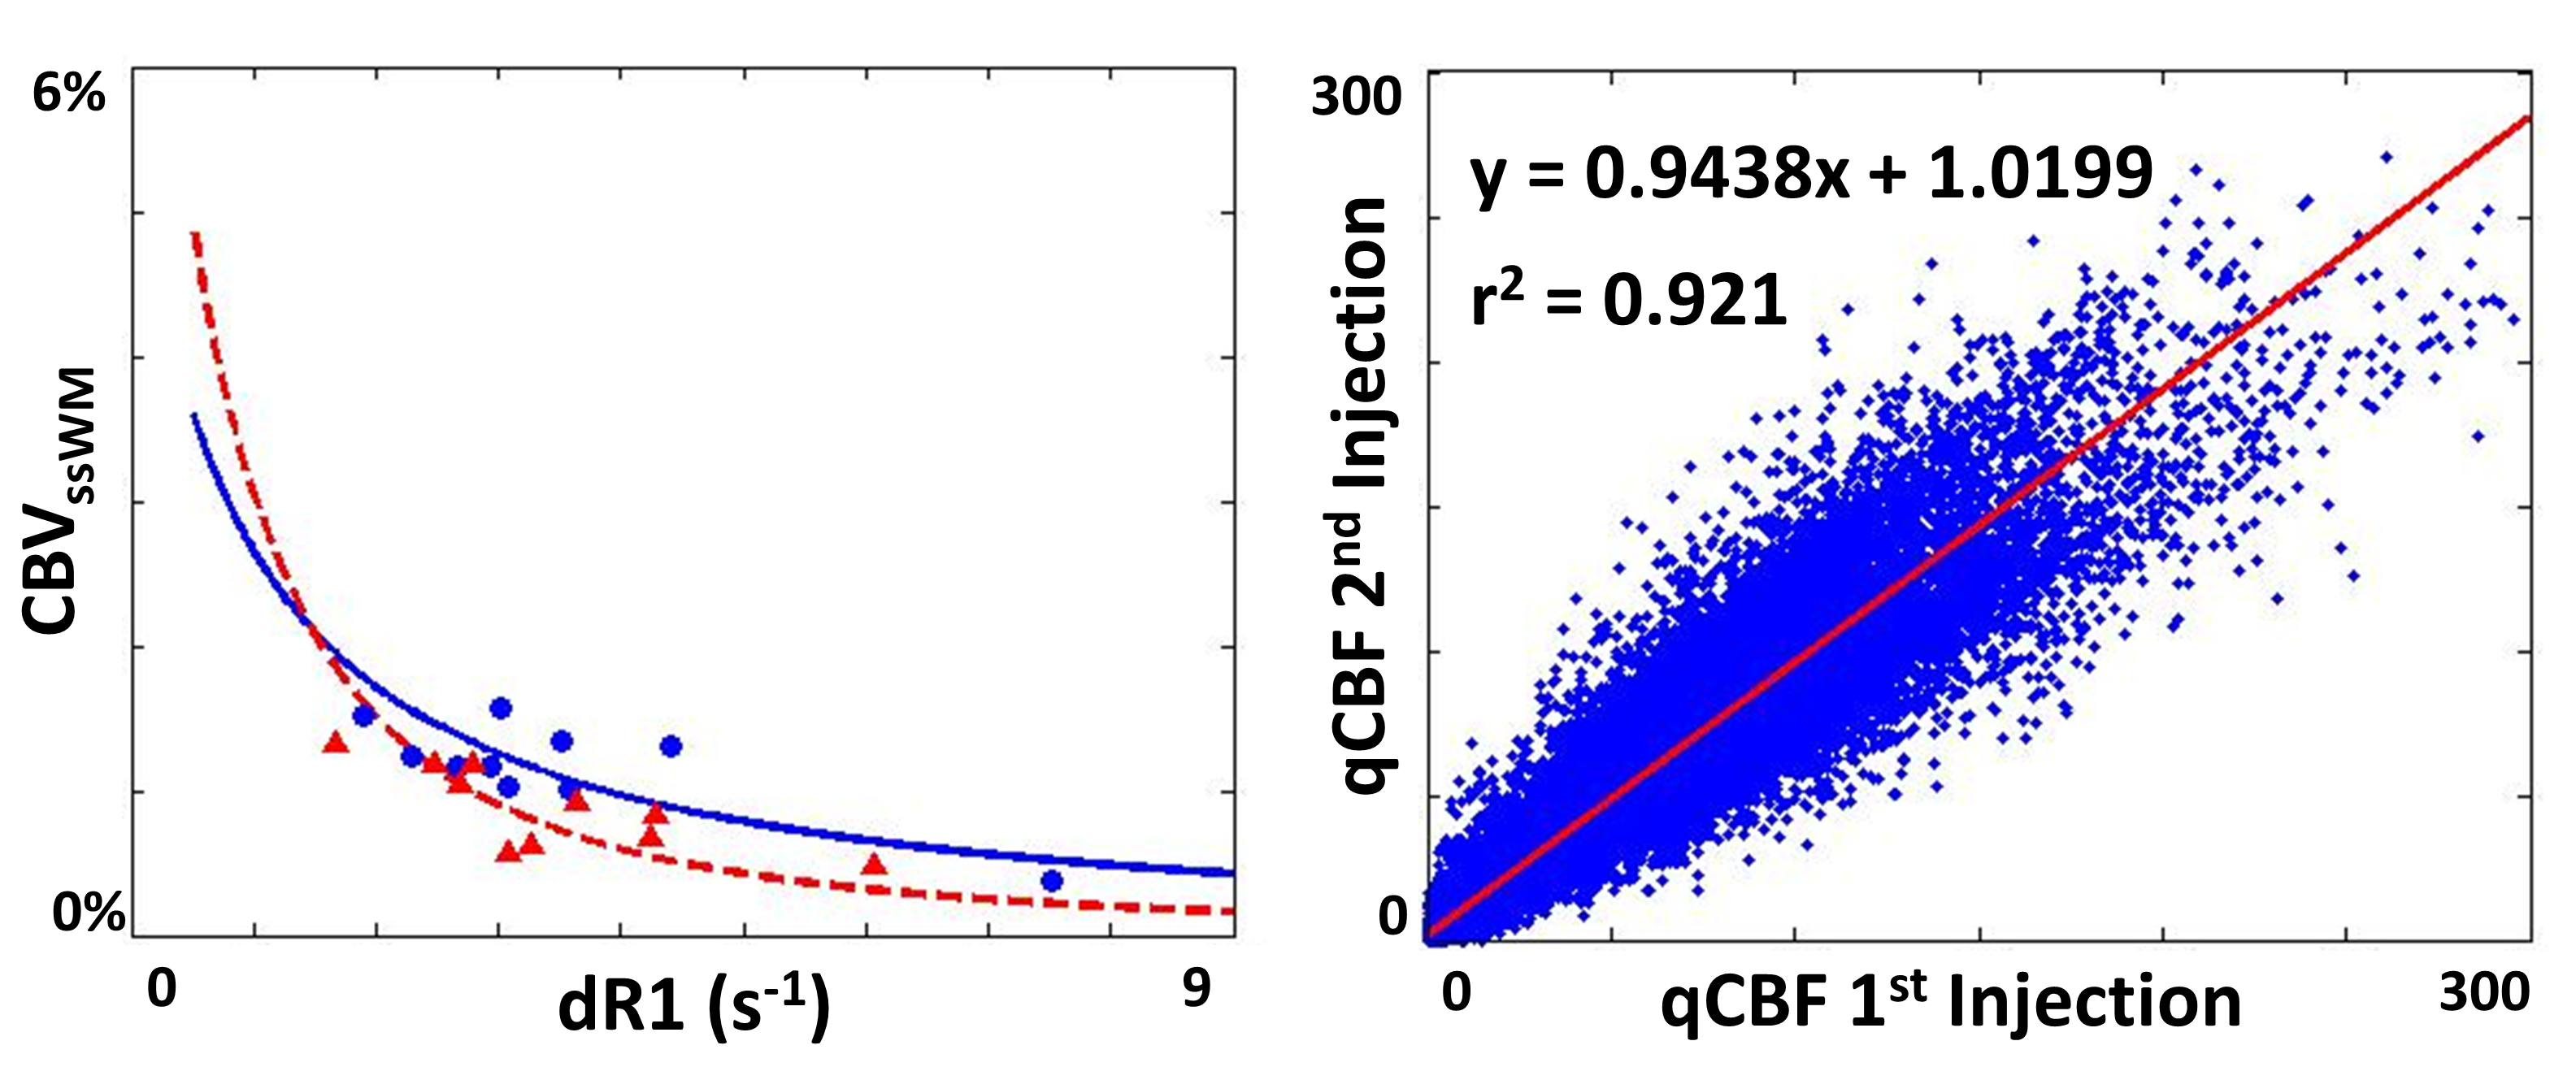
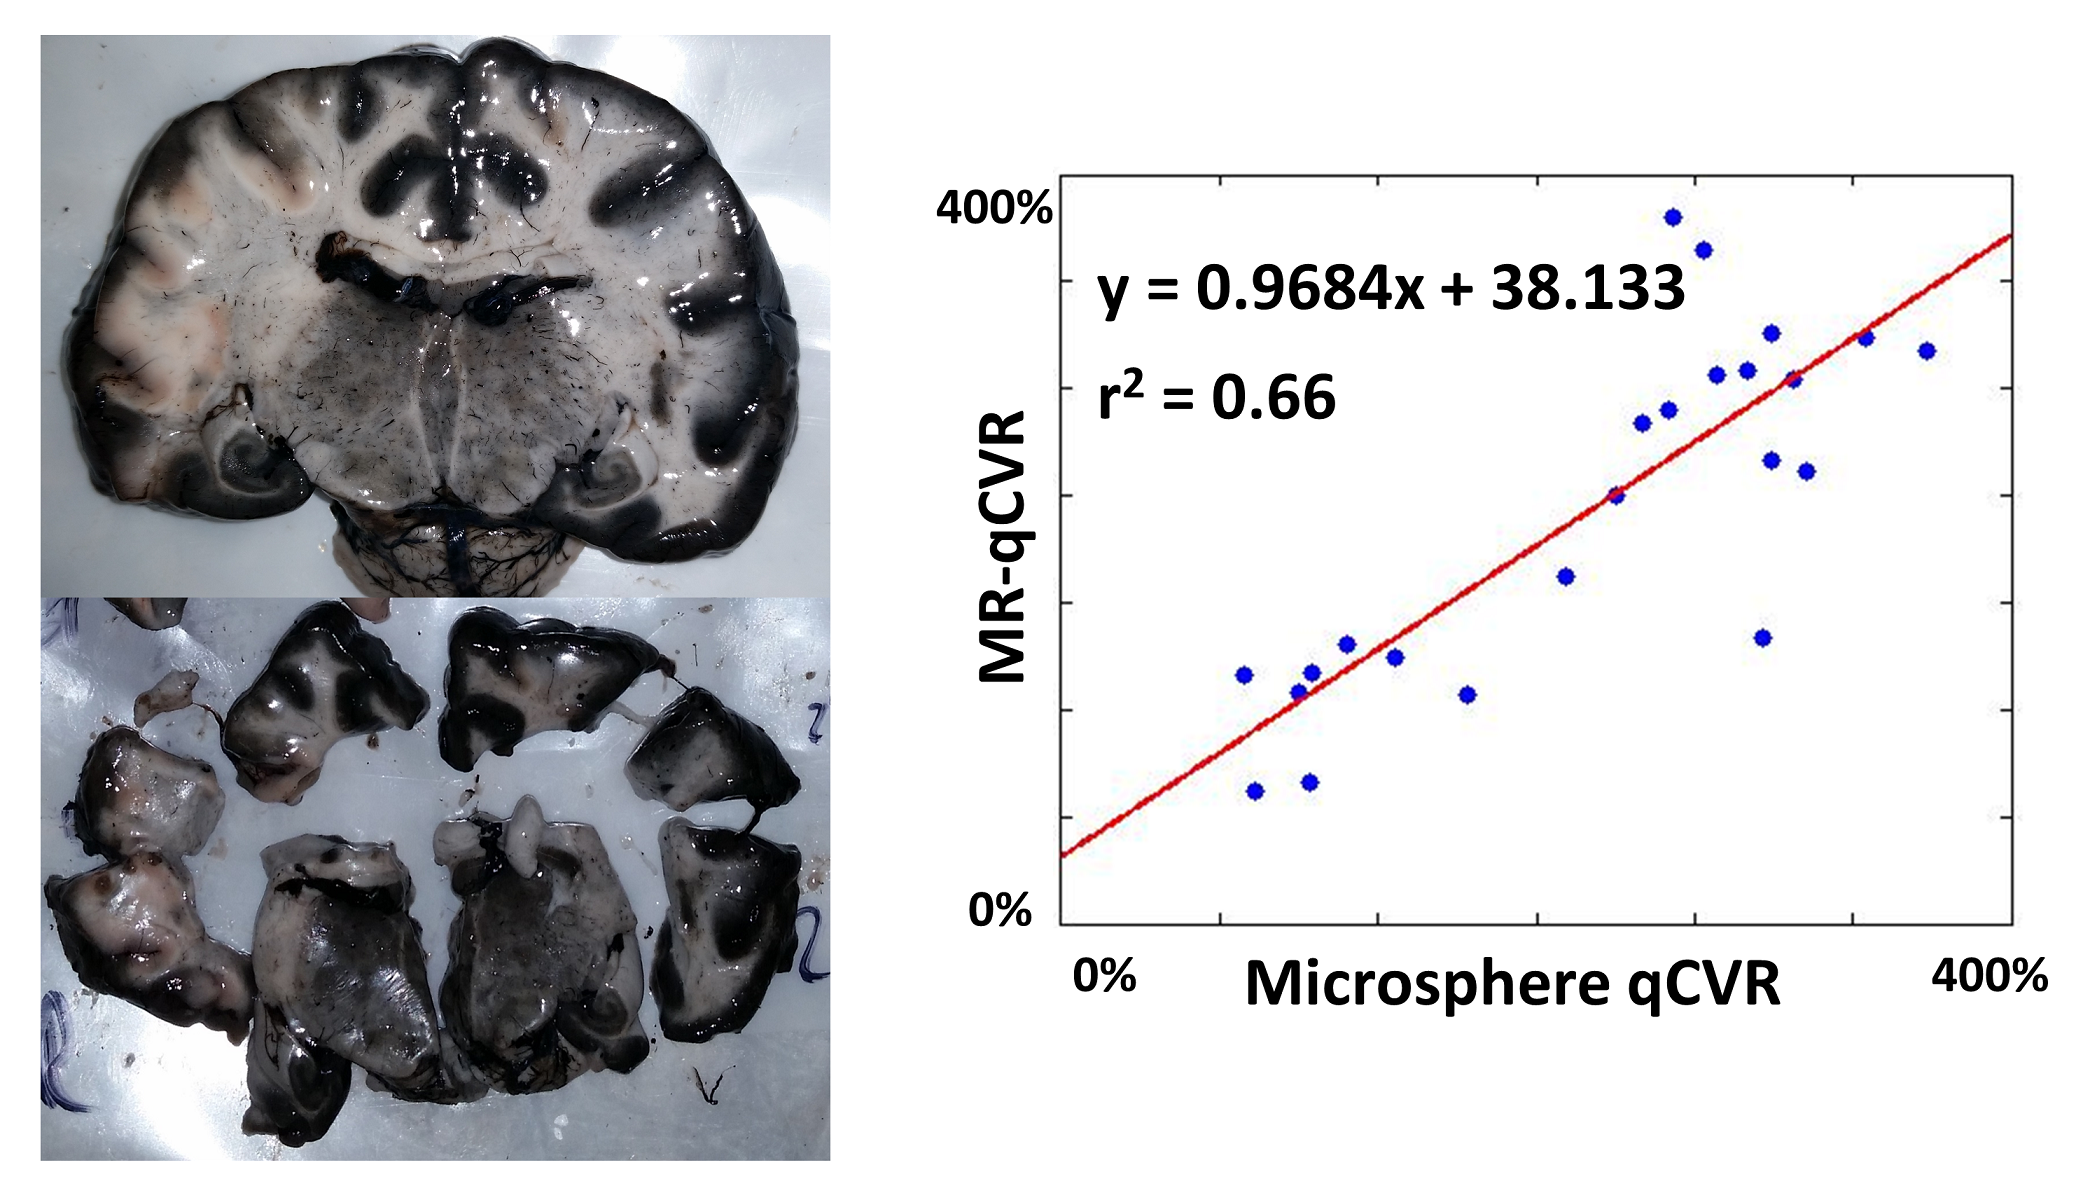
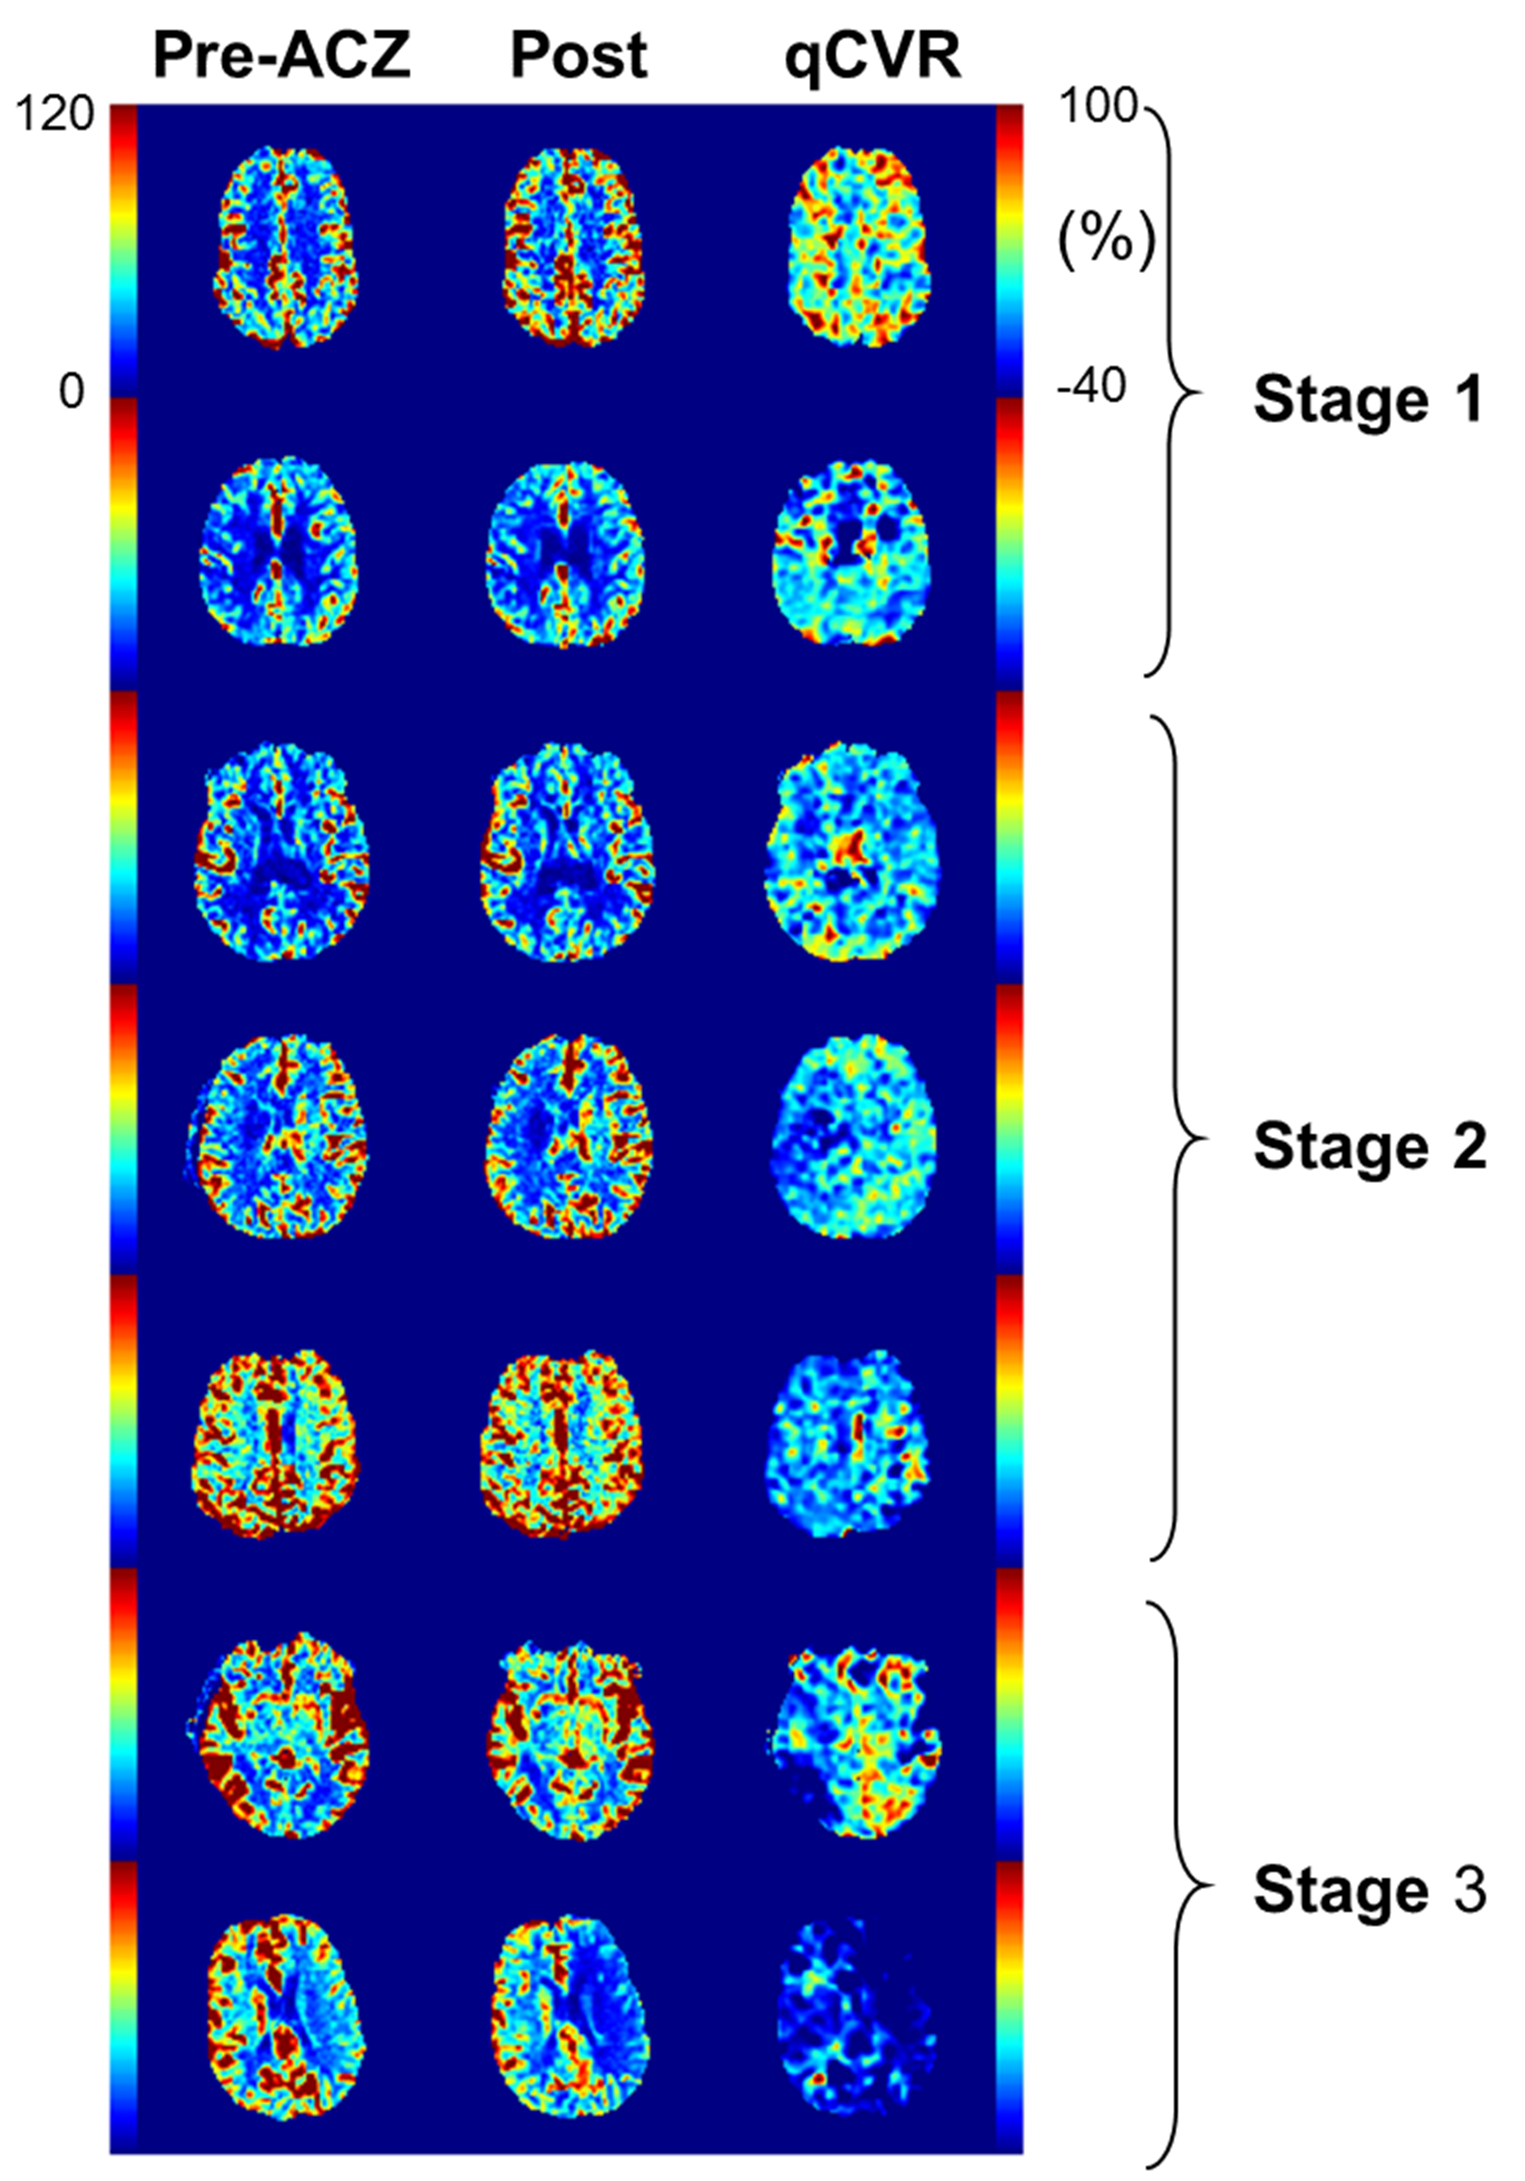
First, we performed back to back perfusion scans on a cohort of 10 volunteers, to examine the effect of a second contrast-agent injection on perfusion quantification. We then compared MR-qCVR against the perfusion gold standard—microspheres. Finally, we performed an IRB approved, retrospective review of patients undergoing an MRI perfusion with ACZ challenge exam at our institution. Volunteer Study: To examine the effects of a second injection of gadolinium, ten volunteers were imaged twice using a quantitative DSC perfusion MRI (SCALE-PWI)3. The injection procedure was as follows: for each DSC scan a single dose injection (0.1 mmol/kg body weight) of Gd-DTPA followed by a 15 mL saline flush, at 4 mL/s was used. The second DSC scan was taken five minutes after the completion of the first. A different water correction factor (WCF) was fit using the ratio of T1s for the first and second injection. Canine Experiment: Following successful demonstration of quantitative perfusion values for both first and second injections, a canine experiment was performed to compare MR-qCBF and MR-qCVR values against microspheres. Five canines were examined under resting state and CO2 elevation. Patient Data: A series of consecutive patients with angiographically confirmed cerebral vascular disease who underwent an ACZ-challenge MRI perfusion study as part of their standard of care were retrospectively selected. Cerebral perfusion was quantified using a previously reported DSC perfusion MRI pulse sequence (SCALE-PWI)3 that produces images of qCBF (in ml/100g/min), qCBV (in ml/100g) and Mean Transit Time (MTT in seconds) as part of the in-line image reconstruction. Patients were then given a 1000 mg injection of ACZ between scans. The final scan with the second Gd-DTPA injection measures perfusion changes in response to ACZ.Results
In the volunteer study, we were able to see a high agreement of qCBF between the two injections by fitting a different water correction factor for the first injection of gadolinium and for the second injection of gadolinium (Figure 1). The r2 value of the correlation plot was 0.921. Following this study, the animal experiment comparing MR-qCBF and MR-qCVR against microspheres showed a correlation r2 value of 0.66 (Figure 2). There was a bit of variability in the effect, but showed a good correlation. The qCBF maps before and after ACZ challenge and the resulting qCVR maps were calculated from the patient study data (Figure 3). Across the different stages of hemodynamic compromise, qCBF showed some changes, but qCVR correlated directly with the severity and showed a more distinct change.Conclusion
We presented the first evidence of a method to accurately quantity CVR using current MRI-protocols. We showed that the use of a different WCF specific to the second injection allows for accurate quantification of CBF and validated this in a canine model. Finally, we showed that qCVR can clearly distinguish between stages of hemodynamic compromise.Acknowledgements
R01NS093908; R21EB01792; AHA 16PRE27530023
References
1. Derdeyn CP, Videen TO, Yundt KD, Fritsch SM, Carpenter DA, Grubb RL, et al. Variability of cerebral blood volume and oxygen extraction: stages of cerebral haemodynamic impairment revisited. Brain. 2002;125(Pt 3):595-607.
2. Nemoto EM, Yonas H, Kuwabara H, Pindzola RR, Sashin D, Meltzer CC, et al. Identification of hemodynamic compromise by cerebrovascular reserve and oxygen extraction fraction in occlusive vascular disease. J Cereb Blood Flow Metab. 2004;24(10):1081-9.
3. Srour JM, Shin W, Shah S, Sen A, Carroll TJ. SCALE-PWI: A pulse sequence for absolute quantitative cerebral perfusion imaging. Journal of Cerebral Blood Flow & Metabolism. 2011;31:1272-82.
Figures