0359
Simultaneous acquisition of oxygen extraction fraction and cerebral blood flow during brain activation1Center for MRI Research, Peking University, Beijing, People's Republic of China, 2MR Research China, GE Healthcare, Beijing, People's Republic of China
Synopsis
The development of neuroimaging methods to obtain oxygen extraction fraction (OEF) and cerebral metabolic rate of oxygen (CMRO2) is crucial for understanding mechanisms underlying physiological function and neuronal activity. In the present study, a novel technique termed FAIR-MGESSE combined flow sensitive alternating inversion recovery (FAIR) and multiecho gradient echo sampling of the spin echo (MGESSE) techniques. It is proposed for acquiring OEF and ASL maps in a single repetition time to determine the relative change in CMRO2 in human subjects. Relative changes in CBF, OEF and CMRO2 were measured during the visual task and the results agree well with expectations.
Purpose
According to the Fick’s first law, the amplitude of the cerebral metabolic rate of oxygen (CMRO2) response to task-based stimulation is determined by changes in cerebral blood flow (CBF) and oxygen extraction fraction (OEF). From a neuroscience perspective, measuring CMRO2 in response to task-based stimulation should enable new advances in understanding functional architecture and connectivity, due to its close relationship to underlying neuronal activity. Current methods in obtaining relative changes in CMRO2 require the inhalation of gas1-3. It is not ideal for task-based functional studies. Another alternative approach to estimate the CMRO2 is by obtaining the OEF and CBF without gas inhalation. However, no MRI technique has been developed which can simultaneously measure CBF and OEF. In this work, a novel method named FAIR-MGESSE is proposed to fill this gap. A distinctive benefit of this effective technique is that relative CBF and OEF can be measured simultaneously voxel by voxel in a single repetition time (TR), which subsequently leads to the derivation of CMRO2. A visual stimulus fMRI study was carried out for its verification.Methods
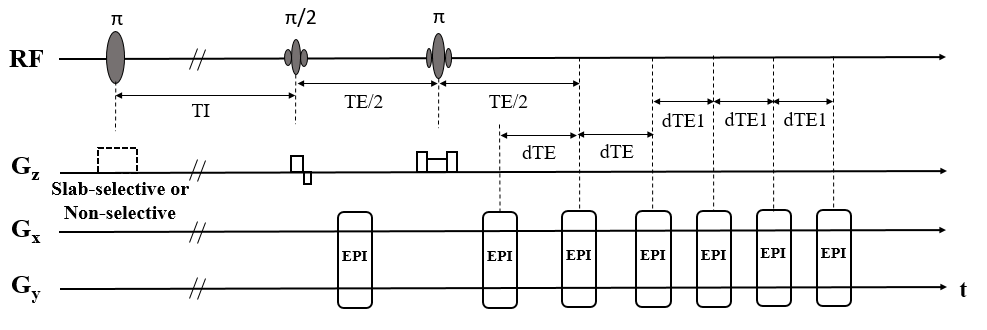
The
pulse sequence diagram of FAIR-MGESSE is shown in Fig. 1: after an inversion
recovery, arterial spin labeling perfusion contrast will be obtained in the
first EPI readout; and the following series of EPI readouts were used to
measure OEF after a nonselective inversion pulse. FAIR-MGESSE was implemented
on a 3T GE MR750 MRI scanner. Five healthy adult subjects (24-27 y) were
recruited for a visual stimulus study. The stimulus consisted of two minute presentations
of an 8Hz flashing radial checkerboard (with central fixation point),
interleaved with two minutes of the fixation point alone (2 OFF epochs and 1 ON
epoch) and the scan parameters used were: inversion slab thickness=78mm,
TI=1000ms, TR=3000ms, 11 slices without space, 4x4x6mm3. TE=66ms,
dTE=20.6ms, dTE1 was as short as possible. 3D T1-weighted images for
TR/TE/alpha=6.6ms/2.9ms/12°, 1x1x1mm3. 1mm isotropic 3D T1-weighted
images were also obtained. The
acquired FAIR-MGESSE data was corrected for motion, co-registered to the 3D T1
anatomical image, all images were spatially normalized to standard MNI space
and the normalized FAIR-MGESSE images were smoothed. The perfusion image was
obtained by subtracting the adjacent slab-selective and nonselective images
from the first echo in the sequence.R2 was estimated from one pair of the gradient echo images (the
2th and 4th gradient echoes) that were acquired symmetrically about the spin
echo as:$$R_{2}=ln\left(\frac{S(TE-dTE)}{S(TE+dTE)}\right)/2dTE$$ Similarly,
the reversible relaxation rate,R2′, can be estimated from the last four gradient echo images
by: $$S(t)=S_{0}\cdot exp(-R_{2}\cdot t)\cdot exp(-R_{2}^{'}\cdot |TE-t|)$$
Furthermore,λ (the fractional cerebral venous blood volume) can be obtained
from the real spin echo signaland S0(TE) and extrapolated spin echo signals S(TE) from above equation by: $$\lambda=\ln(S(TE))-\ln(S_{0}(TE))$$
then
OEF can be calculated by:$$R_{2}^{'}=\lambda\cdot 4/3\pi\cdot\gamma\cdot \triangle\chi_{0}\cdot Hct\cdot B_{0}\cdot OEF$$ where
γ is the gyromagnetic ratio; Hct is the fractional hematocrit, a constant Hct
of 0.42 was employed for all subjects and a small vessel Hct to large vessel
Hct ratio of 0.854; Δχ0is the susceptibility difference between the fully oxygenated
and fully deoxygenated blood, which has been measured to be 0.18 ppm per unit
Hct5. Maps of the t-statistics for ASL and OEF were thresholded at voxel-level
P < 0.001 with cluster-level FWE correction of P < 0.05. Only common
activation areas that passed the statistically significant threshold for ASL
and OEF maps was used for calculating the average values of the $$$\triangle OEF/OEF^{base}$$$ and $$$\triangle CBF/CBF^{base}$$$, respectively. Under conditions of constant arterial oxygen
content, $$$\triangle CMRO_{2}/CMRO_{2}^{base}$$$ was calculated by: $$\frac{\triangle CMRO_{2}}{CMRO_{2}^{base}}=(1+\frac{\triangle CBF}{CBF^{base}})\cdot (1+\frac{\triangle OEF}{OEF^{base}})-1$$
Results
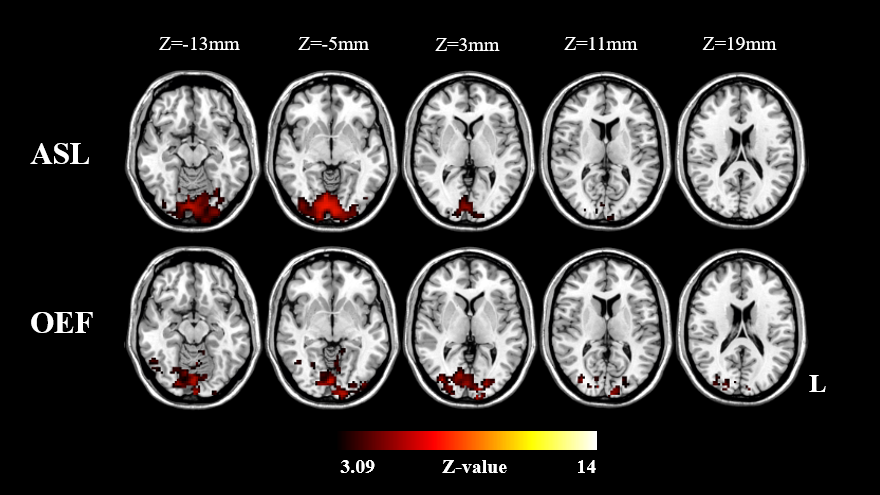
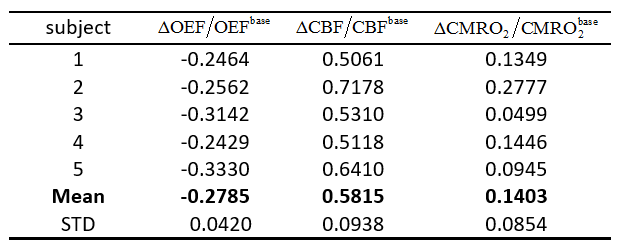
The activation maps for the ASL and OEF revealed significant changes during the visual stimulus, and the activation maps of a typical subject is shown in Fig.2 (five primary slices are shown). The measured relative OEF, CBF and CMRO2 of all the subjects are summarized in Table 1. From five subjects the $$$\triangle OEF/OEF^{base}$$$,$$$\triangle CBF/CBF^{base}$$$ and $$$\triangle CMRO_{2}/CMRO_{2}^{base}$$$ were (mean±s.d.) -0.2785±0.042, 0.5815±0.0938 and 0.1403±0.0854, respectively.Discussion and conclusion
In this work, a new method named FAIR-MGESSE that acquires relative CBF, OEF and CMRO2 of multislices of the brain voxel by voxel during functional challenges was proposed and tested in a fMRI study. Our estimates of relative changes in CBF, OEF and CMRO2 fell within the expected physiological range and were comparable with previous reports6,7. Due to its short scan time, relatively high spatial and temporal resolution and simultaneous measurement of multiple physiological parameters, it is might be a highly potential method to effectively assess CMRO2 in future functional studies.Acknowledgements
References
1. Davis TL, Kwong KK, Weisskoff RM, Rosen BR. Calibrated functional MRI: mapping the dynamics of oxidative metabolism. Proceedings of the National Academy of Sciences. 1998; 95:1834 –1839.
2. Chiarelli, P. A., Bulte, D. P., Wise, R., Gallichan, D., & Jezzard, P. A calibration method for quantitative BOLD fMRI based on hyperoxia. Neuroimage. 2007; 37(3):808-820.
3. Bulte, Daniel P., et al. "Quantitative measurement of cerebral physiology using respiratory-calibrated MRI." Neuroimage. 2012; 60(1):582-591.
4. Eichling JO, Raichle ME, Grubb RL Jr, Larson KB, Ter-Pogossian MM. In vivo determination of cerebral blood volume with radioactive oxygen-15 in the monkey. Circulation Research. 1975; 37:707–714.
5. Weisskoff RM, Kiihne S. MRI susceptometry: image-based measurement of absolute susceptibility of MR contrast agents and human blood. Magnetic Resonance in Medicine. 1992; 24:375–383.
6. Donahue M J, Blicher J U, Østergaard L, et al. Cerebral blood flow, blood volume, and oxygen metabolism dynamics in human visual and motor cortex as measured by whole-brain multi-modal magnetic resonance imaging. Journal of Cerebral Blood Flow & Metabolism. 2009; 29(11): 1856-1866.
7. Lin A L, Fox P T, Yang Y, et al. Evaluation of MRI models in the measurement of CMRO2 and its relationship with CBF. Magnetic Resonance in Medicine. 2008; 60(2): 380-389.
Figures