0357
Measuring Blood Oxygenation and Hematocrit with a Combined T2 and T1 Approach: Initial Experience in Humans1Radiology, Stanford University, Palo Alto, CA, United States
Synopsis
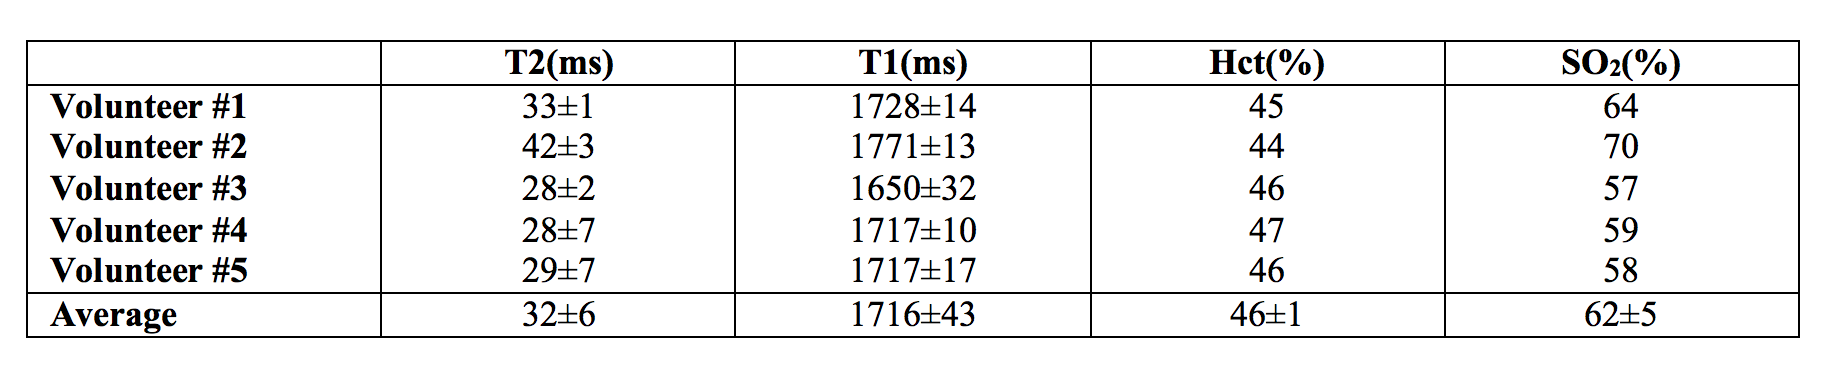
In this study, we propose to obtain simultaneous measurements of blood oxygen saturation (SO2) and hematocrit (Hct) by combining two or more in vivo measurements of blood MR relaxation times. We tested our approach in 5 healthy human subjects using T2+T1 values and calibration curves obtained in vitro. The results found in the superior sagittal sinus vein (SO2=62±5% and Hct=46±1%) are in good agreement with literature values and suggest great potential of the approach once it is further validated.
Introduction:
Measuring blood oxygenation would help the management of many pathophysiological situations, including brain neoplasms, neurodegenerative disease, and chronic and acute ischemia1-2. It is well known that MRI relaxation times are sensitive to blood oxygen saturation. T1, T2, T2*, and phase contrast MR measurements have all been shown to correlate with blood gas analyses of SO23 and these findings have led to the development of several MR blood oximetry methods4. Yet, all of these approaches suffer from a major issue: they all assume a uniform hematocrit (Hct) in the vascular system while it is known that Hct can change with blood vessel size and be significantly altered in pathological tissues5. In this study, we hypothesized that it is possible to measure SO2 and Hct simultaneously by combining two or more measurements of MR relaxation times. We tested our approach in healthy human volunteers using T2 and T1 estimates and calibration curves obtained in vitro.Materials and Methods:
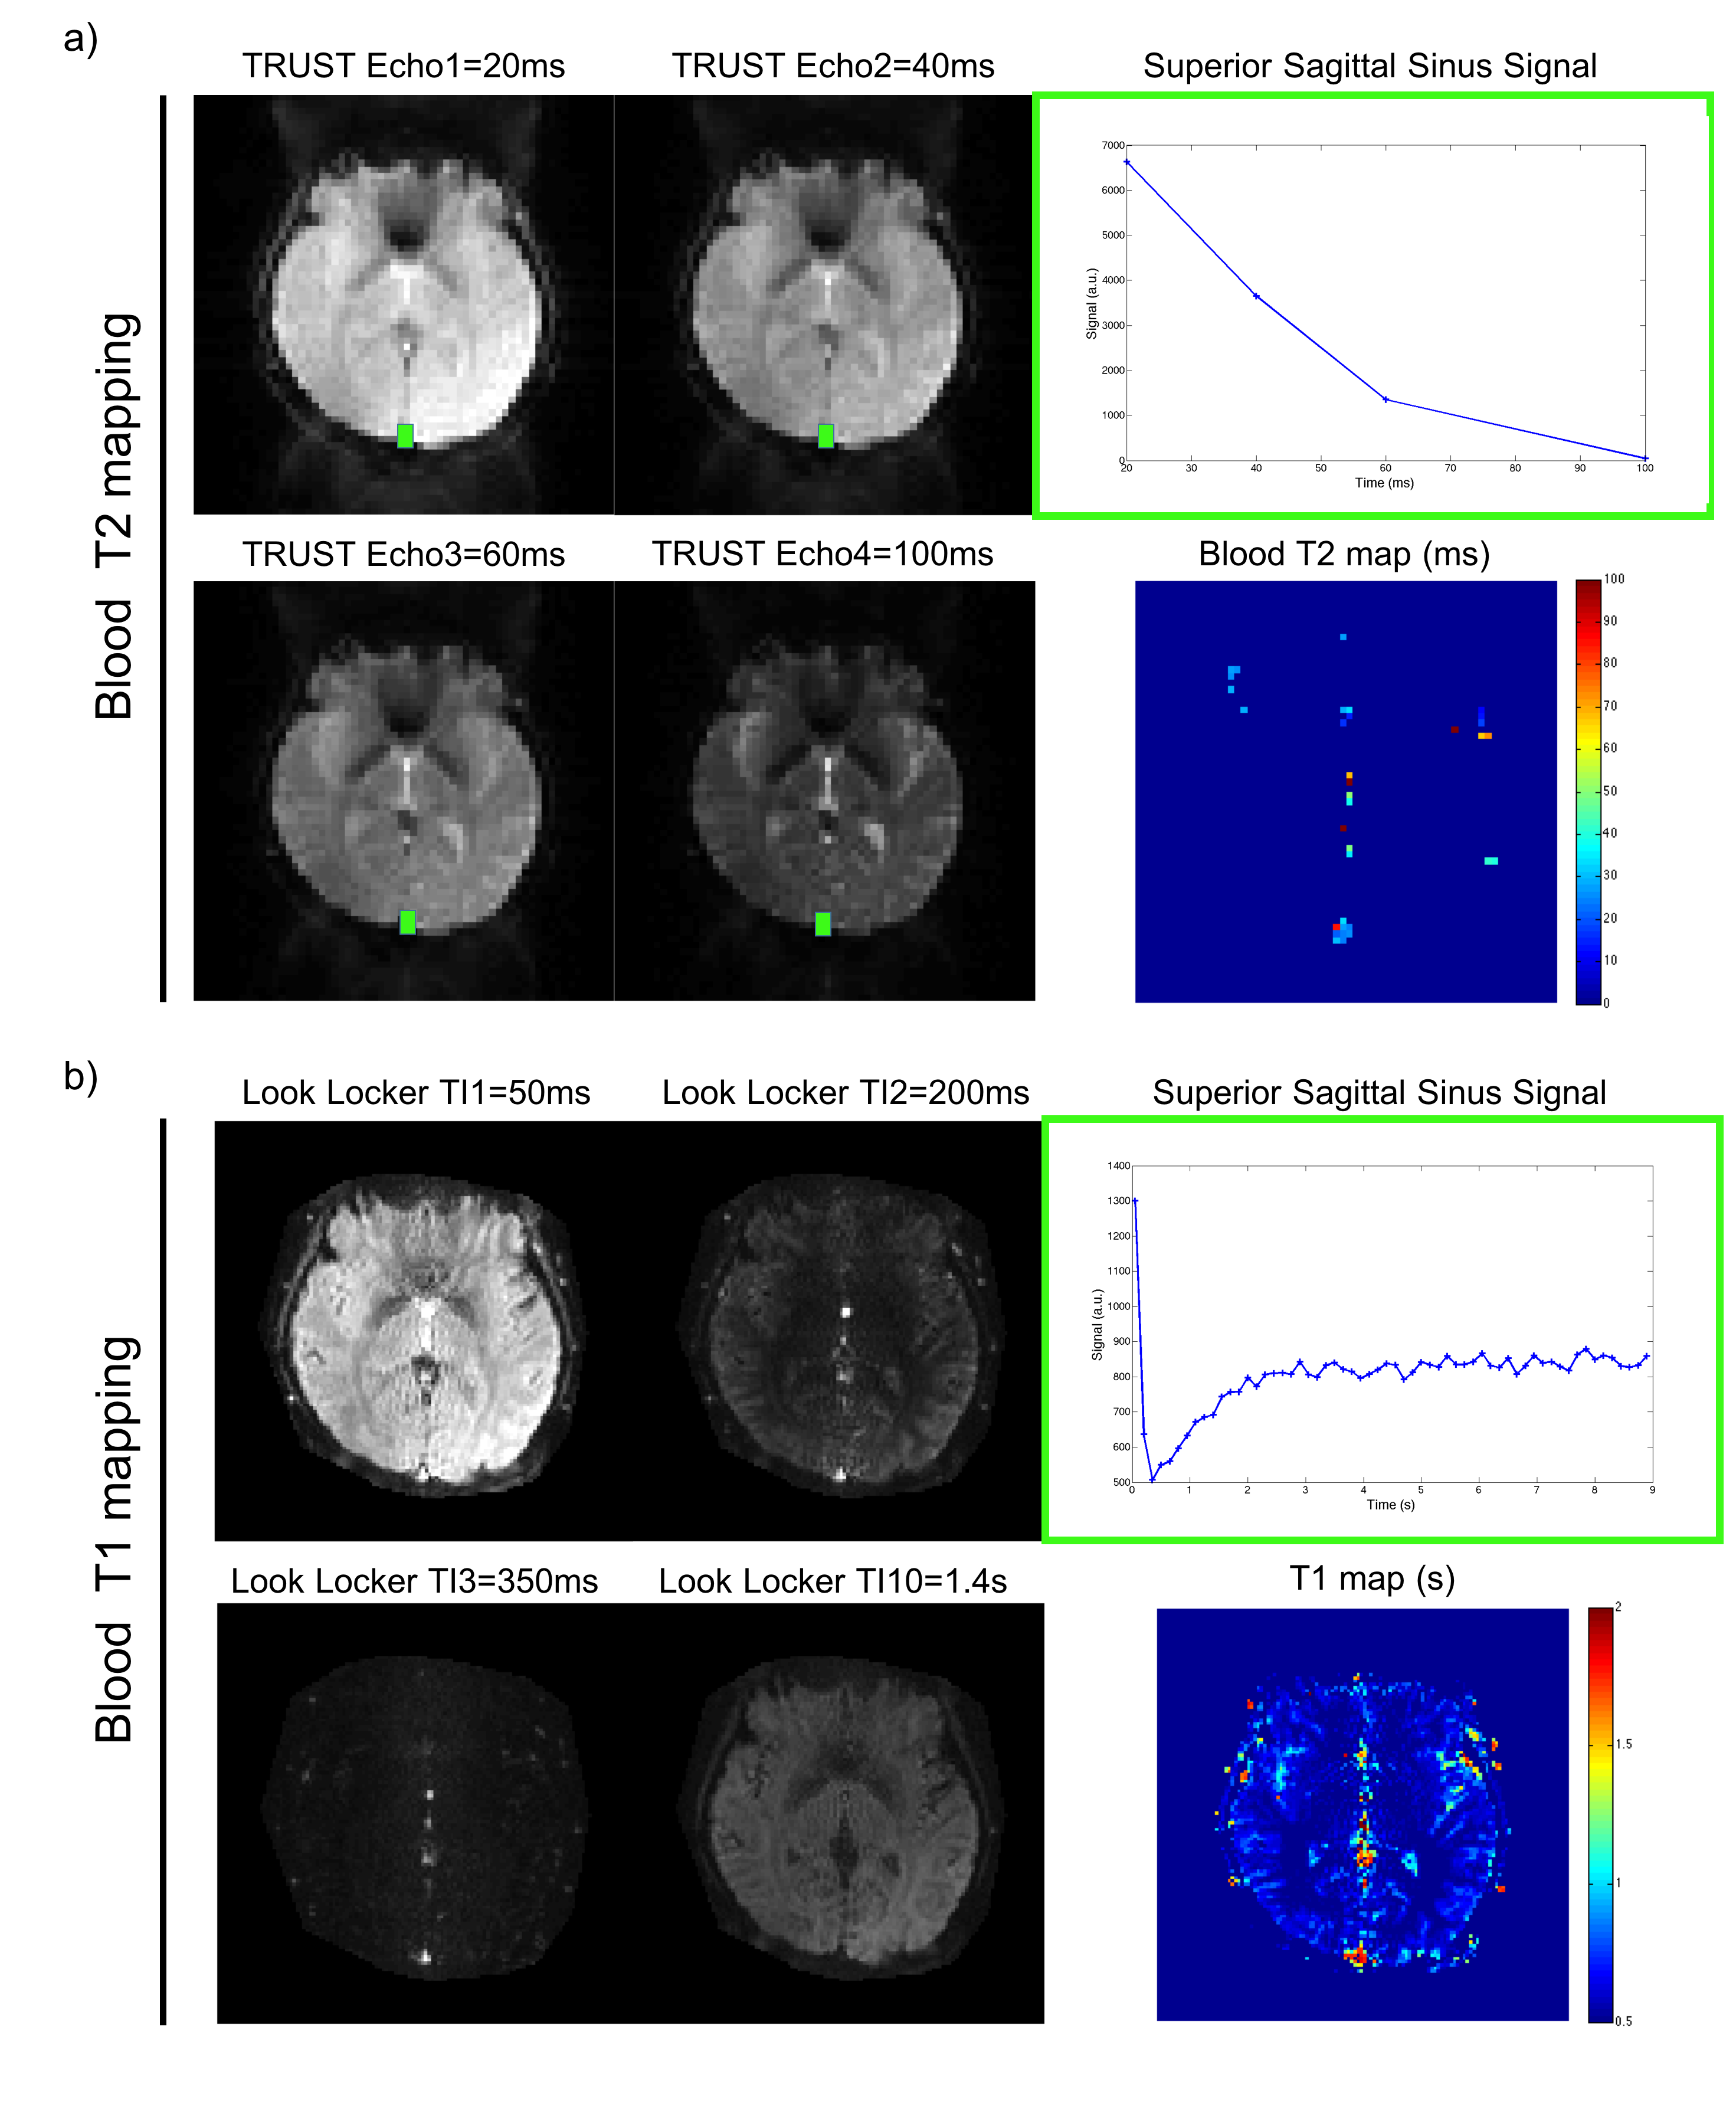
The local IRB committee approved all studies. 5 volunteers (2 women; age range 30-35yrs) were scanned at 3T (GE Healthcare Systems, Waukesha, WI) with an 8-channel GE head coil. The MR acquisition protocol included: (1) a blood T2 mapping sequence based on the TRUST approach6 (acq matrix=64x64, FOV=22x22cm2, NA=4, TR=10s, TEs=20-40-60-100ms, Acq time=264s). Monoexponential fitting procedure was performed only in voxels that showed at least 10% of the maximum signal intensity in the control-tag image in order to obtain T2 maps of the blood (T2b). (2) a blood T1 mapping sequence proposed by Valera et.al7-8 using an adiabatic nonselective 180 global inversion pulse, followed by a slice selective Look-Locker echo-planar imaging (acq matrix=96x96, FOV=22x22cm2, NA=6, TR=10s, first inversion time TI=50ms, ∆TI=150ms, 60 TI values, Acq time=70s).
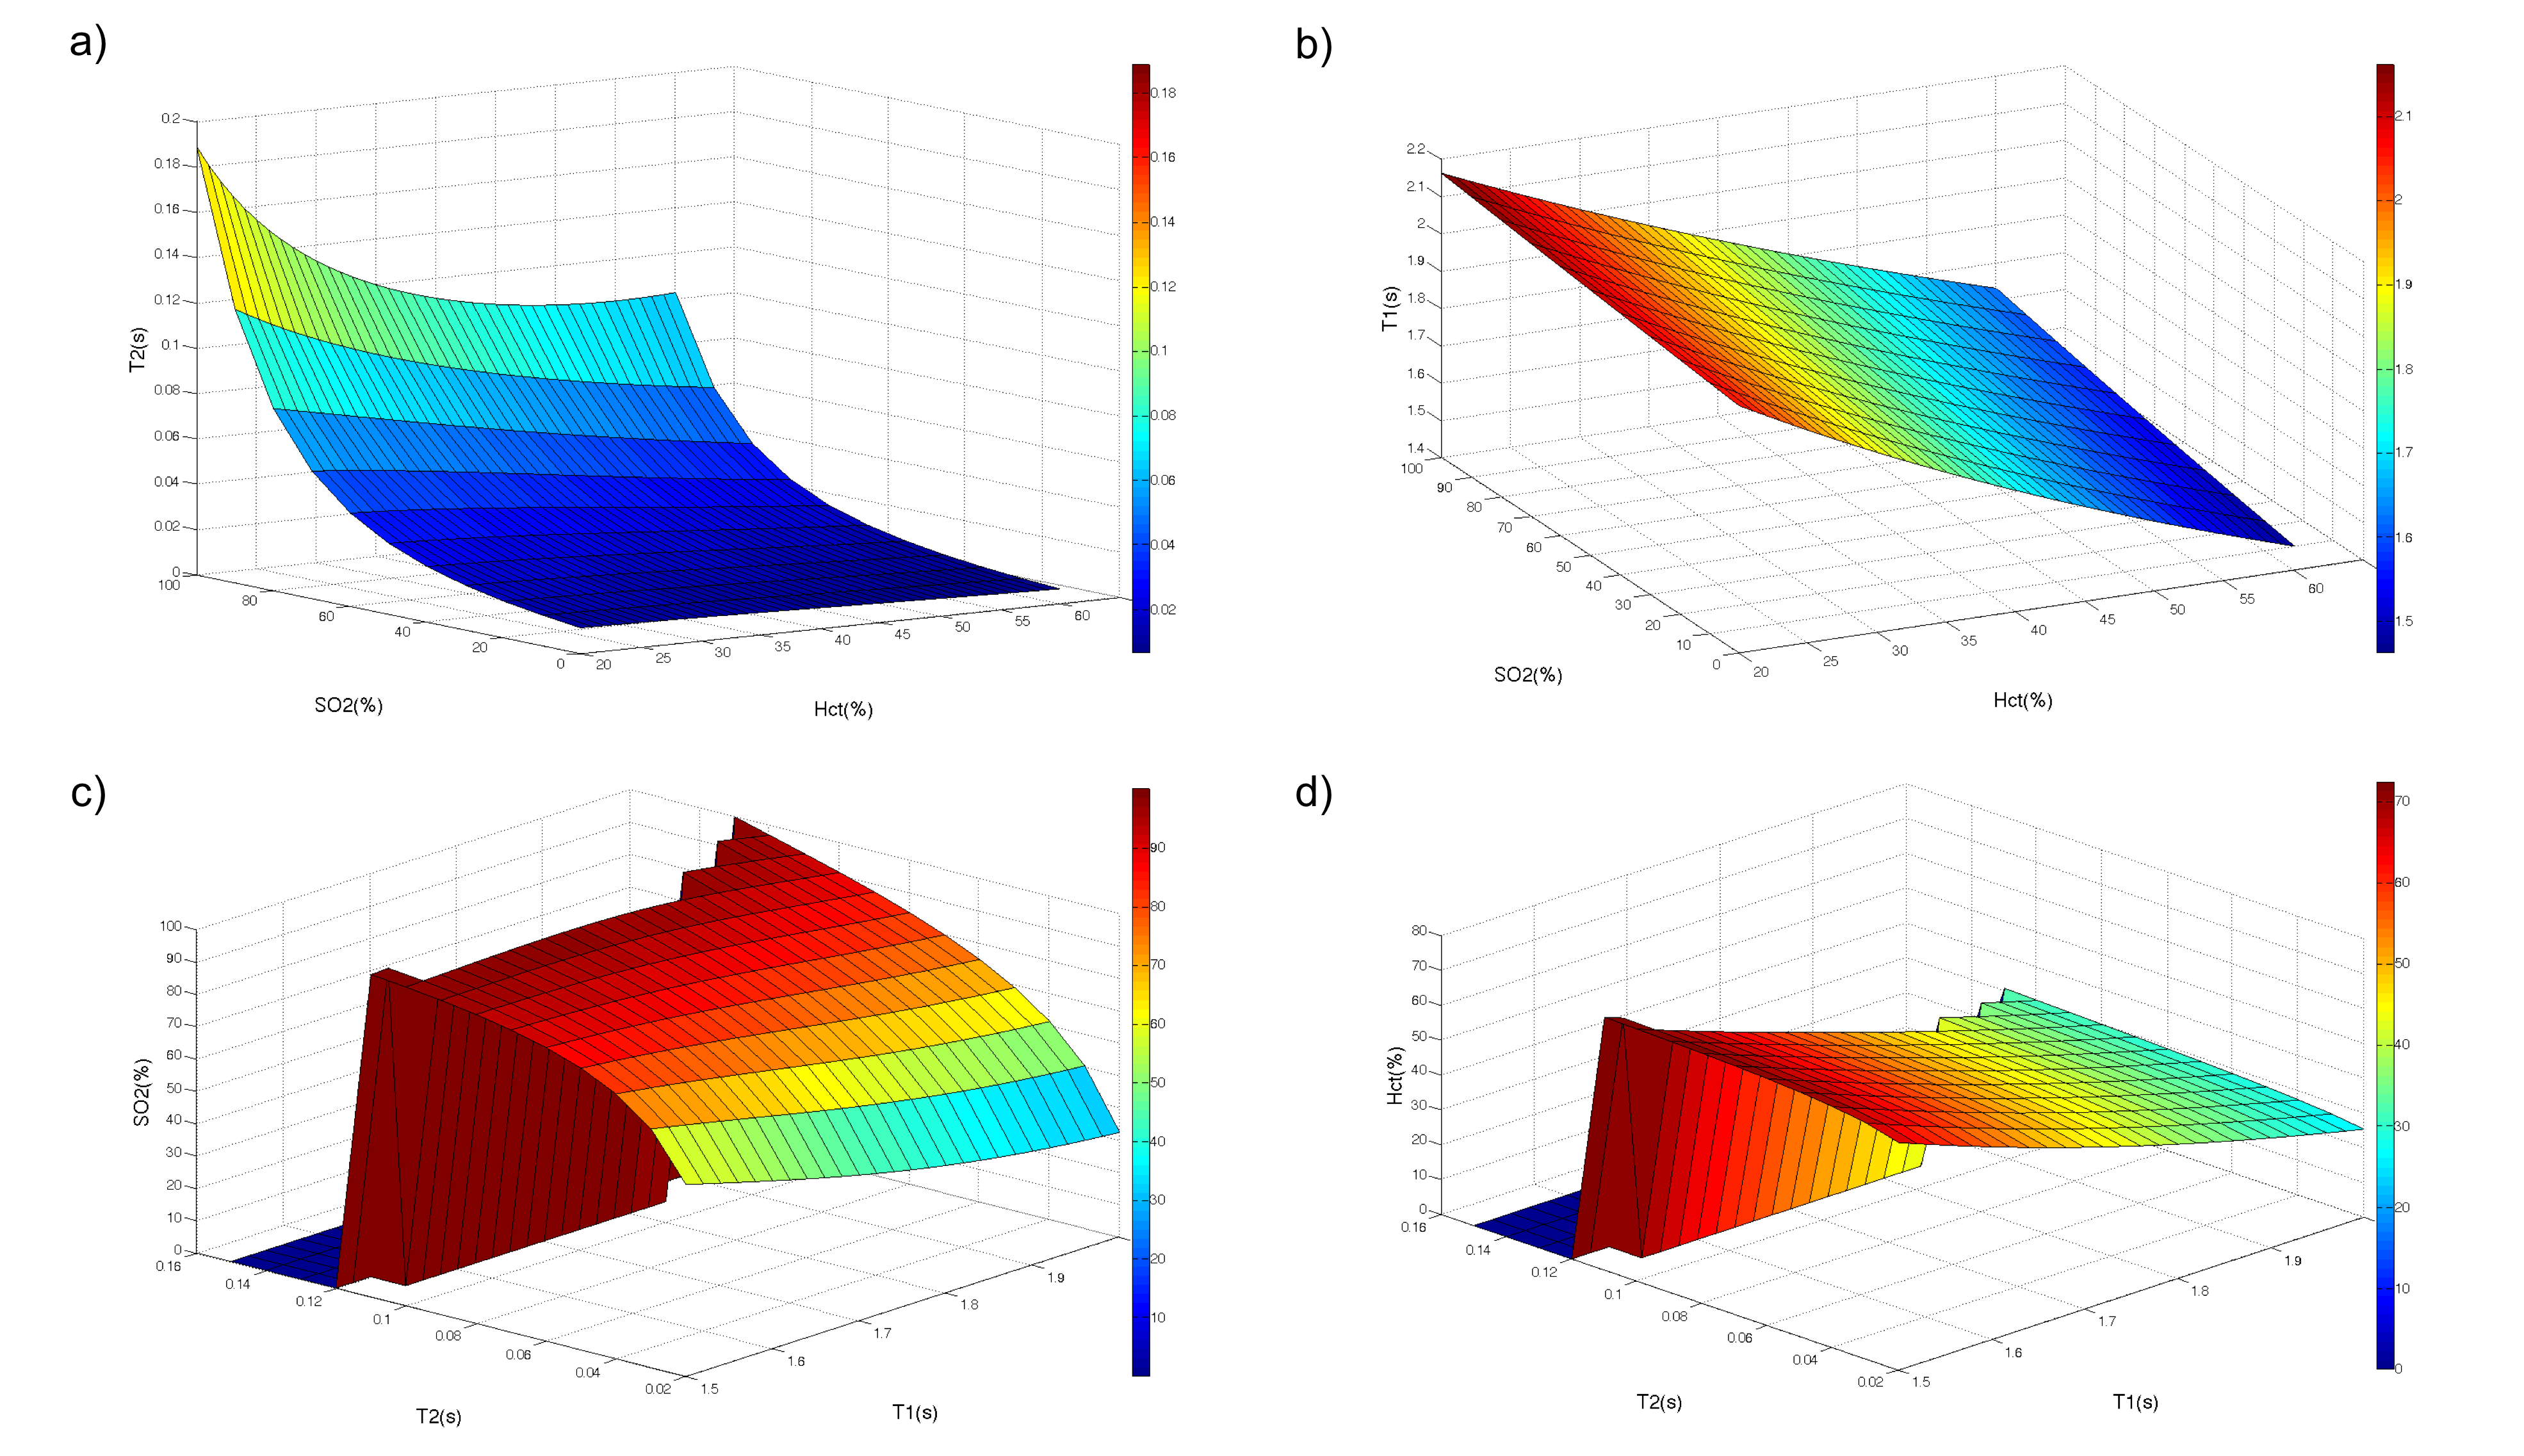
For the models and calibration curves, we brought together the results from previous studies that have looked at the relationships occurring between (T1, Hct, SO2)9-11 and (T2, Hct, SO2)12-15 separately. The general conclusions were found to be independent of the mathematical models and the 2 calibration curves used for our final estimates were eventually chosen based on the consistency with our experimental approach. For the T1 equation we used the model described in Hales20169 for B0=3T: 1/T1b=fe[1.099-(0.057*B0)+((0.17)*(1- SO2))]+[(91-fe)*(0.496-0.023*B0)], where fe depends on the hematocrit fraction. For the T2 equation, we used the equation presented in Zhao200713: 1/T2b=A+B*(1- SO2)+C*(1- SO2)2 originally measured at Hct=0.21,0.44,0.57 and interpolated here in the Hct axis. T1 and T2 values were measured manually in the superior sagittal sinus of each volunteer and a custom Matlab script was used to solve the system of 2 equations to estimate SO2 and Hct.
Results:
The analysis of the different models showed consistently that blood T2 was correlated to both Hct and SO2 with a stronger dependence to SO2. Blood T1 was also found to be correlated to both Hct and SO2 but with a stronger dependence to Hct. These relationships are monotonic for values comprised between [Hct=0.2:0.8] [SO2=0:100%] which suggests that unique solutions of the system ((T1(Hct, SO2),T2(Hct, SO2)) exist on these intervals. Surface plots representing the models used in our study are shown in Figure 1. Images obtained in one volunteer at different echo times or inversion times are presented in Figure 2. Temporal signals obtained in the superior sagittal sinus vein and corresponding T2 and T1 parametric maps are also shown. The values obtained in all volunteers are summarized in Table 1. On average we found T2=32±6ms and T1=1716±43ms which gave estimates of SO2=62±5% and Hct=0.46±0.01 after solving the system of 2 equations.Conclusion:
This study suggests that it is possible to use at least two measurements of MR relaxation rates in blood vessels to estimate simultaneously Hct and SO2 in vivo. The values found with our preliminary approach in the SSS of 5 volunteers are in good agreement with previous blood gas estimates16-17 (Hctvenous=45±5% (n=20) and SO2_SSS=64±4% (n=8)). Several technical improvements can be foreseen (fast whole brain acquisition with a fingerprinting approach, custom calibration models, combination of 3 or more estimates, etc.) and further validation steps are required (use of gas challenges, independent measurements of Hct, analysis of sensitivity and repeatability). Yet, this approach seems promising for non-invasive detection of hypoxic tissues in several pathologies.Acknowledgements
Supported in part by (GRSL15, NIH 5R01NS066506, NIH 2RO1NS047607, NCRR 5P41RR09784) and GE Healthcare.References
[1] Brown et.al, Nat Rev Cancer, 2004. [2] Kidwell et.al, Stroke 2003. [3] Spees et.al, MRM 2001. [4] Christen et.al, AJNR 2012. [5] Kamoun et.al, Nature Methods 2010. [6] Lu and Ge, MRM, 2008. [7] Varela et.al, NMR Biomed 2011. [8] Zhang et.al, MRM 2013. [9] Hales et.al, JCBFM 2016. [10] Grac et.al, MRM 2013. [11] Silvennoinen et.al, MRM 2003. [12] Bush et.al, MRM 2016. [13] Zhao et.al, MRM 2007. [14] Lu et.al, MRM 2012. [15] Liu et.al, MRM 2016.Figures