0355
Measurements of Oxygen Delivery and Consumption Using Hematocrit Derived from Blood T1 Quantification1F.M. Kirby Center for Functional Brain Imaging, Kennedy Krieger Institute, Baltimore, MD, United States, 2The Russell H. Morgan Department of Radiology and Radiology Science, Johns Hopkins University, Baltimore, MD, United States, 3Developing Brain Research Laboratory, Children's National Medical Center, Washington DC, DC, United States, 4Department of Medicine, Duke University, Durham, NC, United States
Synopsis
We verified that venous blood T1 quantified in vivo in humans using fast and non-invasive MRI can be used to derive hematocrit (Hct) values reliably. This Hct information can be used for a more individual estimation of oxygen extraction fraction (OEF) from venous blood T2 measurements. Furthermore, inverse correlation between Hct and baseline cerebral blood flow (CBF) was observed across subjects. Measurement of Hct, OEF and CBF allowed determination of oxygen delivery (OD~CBF∙Hct) and consumption (cerebral metabolic rate of oxygen, CMRO2~CBF∙Hct∙OEF). When compared to CBF, OD and CMRO2 showed less inter-subject variations among normal volunteers.
Purpose:
MRI-based measurements of baseline cerebral blood flow (CBF) and oxygen extraction fraction (OEF) have been pursued for neuro applications 1,2. Combining with hematocrit (Hct) information, additional physiological parameters such as oxygen delivery (OD~CBF∙Hct) and consumption (cerebral metabolic rate of oxygen, CMRO2~OD∙OEF) 3,4 can be derived to assess brain homeostasis with more thorough aspects. Furthermore, knowledge of Hct can help determine OEF with blood T2 oximetry using Hct-specific calibration curves 5,6. Recently, we showed that blood T1 values measured using a fast and non-invasive MR sequence 7 correlated with individual Hct 8. Here, we propose to obtain Hct values measured by venous blood T1 (T1v) quantification through comparison with those from pathology lab test, and used these for estimating OD and CMRO2. This simple procedure removes the need for invasive blood draw or assuming a population-averaged number for determining these parameters in situ.Methods:
Thirteen healthy volunteers (35±7yr, 6F, 7M) were enrolled with consent and studied on a 3T Philips scanner. T1v was measured at the internal jugular vein (IJV) using a modified Look-Locker sequence with an adiabatic inversion pulse followed by multiple imaging acquisition blocks of short time intervals 8. The first inversion time (TI) was sampled at 160 ms and others at intervals of 285 ms. Segmented turbo field echo (TFE) acquisition with FOV = 140×169 mm2, acquisition matrix = 176×204, slice thickness = 5 mm, TR/TE/FA = 13ms/7.6ms/50°, scan time=1 min. A linear calibration model is calculated between the measured longitudinal relaxation rate of venous blood (1000/T1v) and the Hct values provided by the pathology lab test on individually sampled blood, Hct(lab). Blood venous T2 (T2v) was also measured at IJV using a T2prep module with effective echo times of 20,40,80,160 ms. The MR protocol followed an earlier study5 and acquisition parameters were identical to those used for T1v measurements. Total scan time was also about 1 min. Based on previously reported Hct-dependent calibration curves 6, venous blood oxygenation fractions (Yv) were determined from T2v using either assumed Hct=0.42, Hct(lab) or Hct(T1v). Assuming Ya = 1, OEF was calculated as OEF=1-Yv. Blood flow velocity at bilateral internal carotid arteries (ICA) and vertebral arteries (VA) were measured using phase-contrast (PC) MRI. MPRAGE was performed for brain volume estimation. The total flux of the arterial blood supplying the brain normalized by parenchyma volume was used to determine CBF. Mean, standard deviation (STD), and coefficient of variance (CoV= STD/Mean) across subjects were calculated for the different parameters.Results and Discussion:
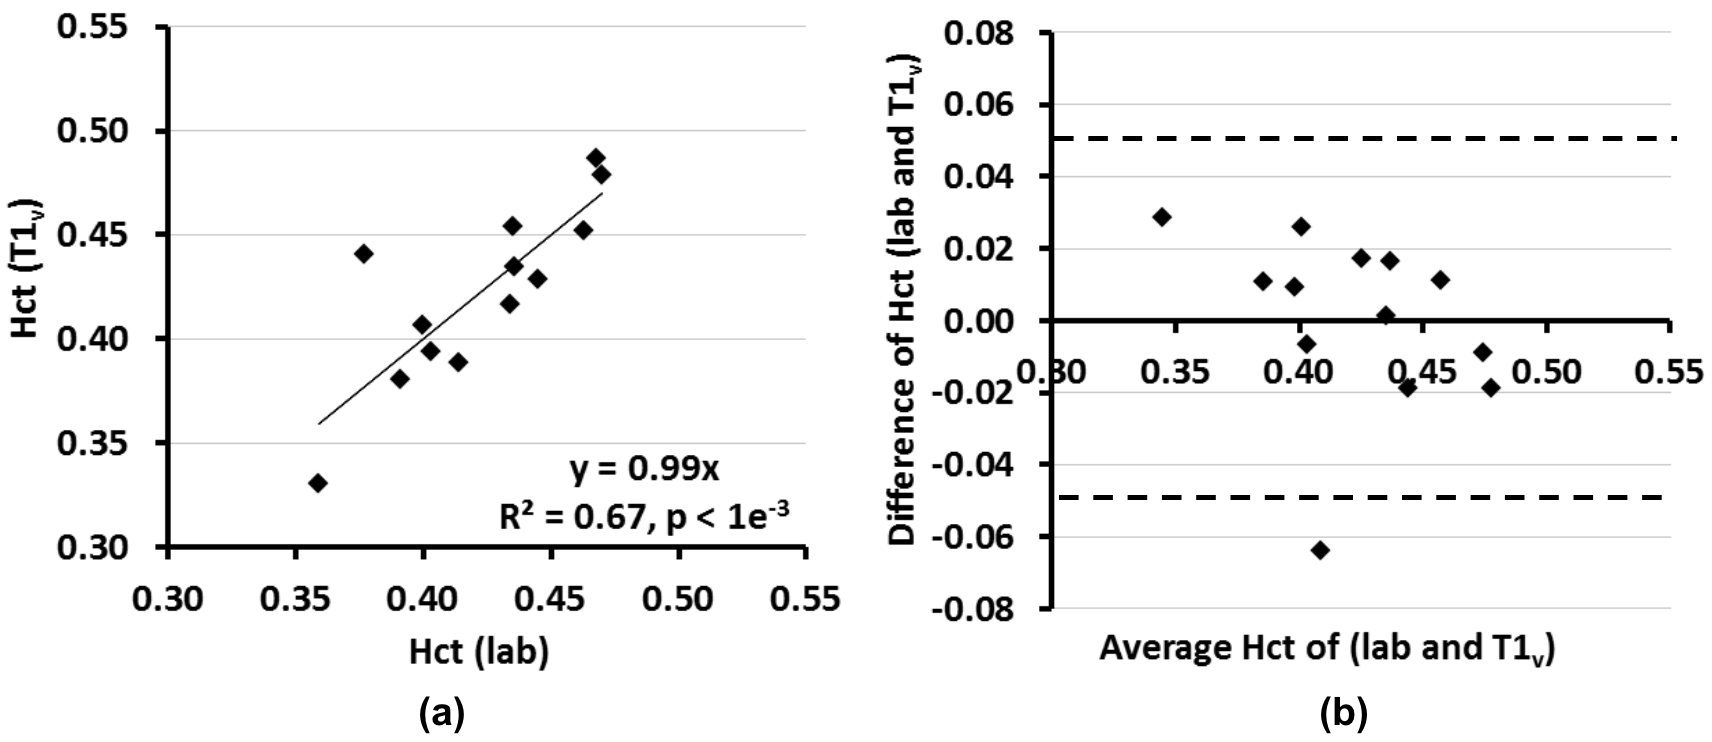
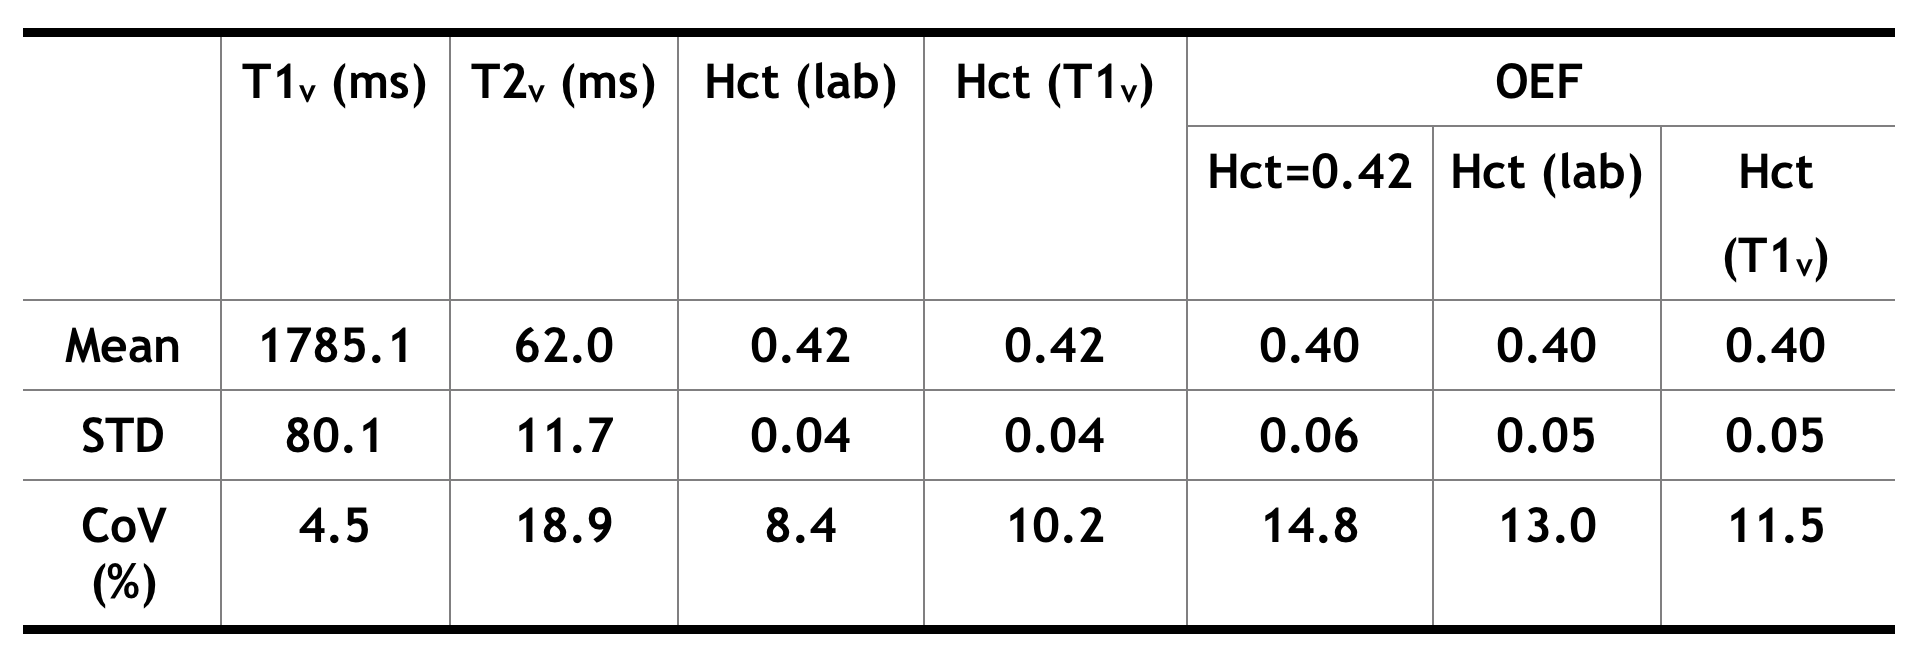
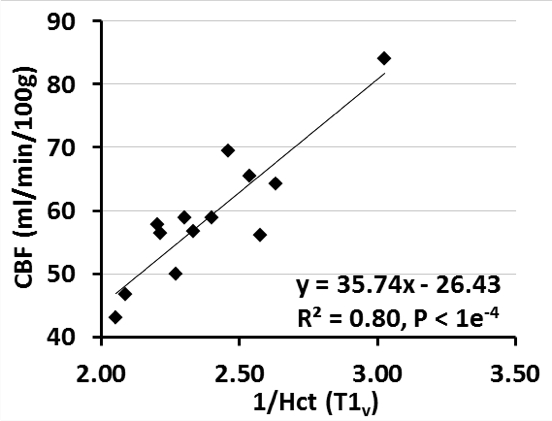
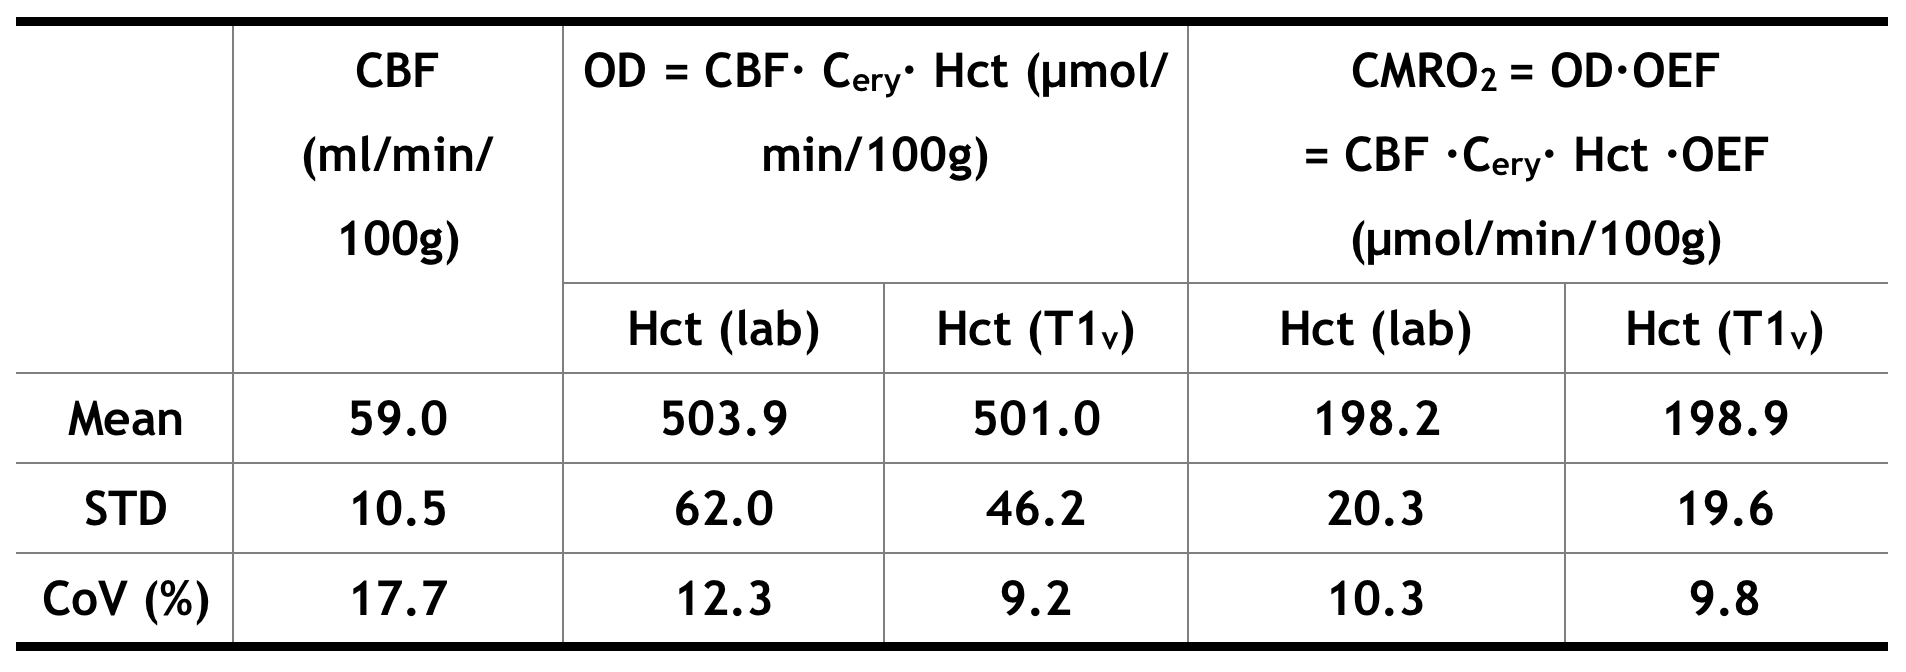
T1v derived Hct values were calibrated as Hct(T1v) = 1.75×(1000/T1v)-0.56. Linear regression (Fig. 1a) and Bland-Altman analysis (Fig. 1b) show significant correlation (P<1e-3) and strong agreement, respectively, between Hct values provided from lab tests and from T1vs. The group averaged Hct(lab) and Hct(T1v) values were both 0.42±0.04 (Table 1). The group OEF values are 0.40±0.06 when calibrated using Hct=0.42, and 0.40±0.05 when using Hct(lab) and Hct(T1v). OEF values based on Hct(lab) and Hct(T1v) have smaller CoV (13.0% and 11.5%) than OEF obtained from assumed Hct=0.42 (14.8%) (P <0.05, t test on subsamples) (Table 1). The result that CBF, among subjects with normal hemodynamic regulation and without neurovascular impairment, is inversely correlated with Hct (Fig.2), agrees well with basic physiological understanding and with results from perfusion imaging modalities other than MRI 9,10. CoV of CBF was 17.7% and that of OD and CMRO2 were reduced to be lower than 12% (P < 0.01) (Table 2). This confirmed previous understanding that, in healthy brain, inter-subject variations of CBF can be partially explained by their variance of Hct 10,11.Conclusion:
The MR quantification of blood T1v (1 min) offers quick and noninvasive estimation of Hct. Combined with T2v measurement, this technique enables individual determination of various hemodynamic parameters for OEF, OD and CMRO2. When compared to CBF, OD and CMRO2 showed less inter-subject variations among normal volunteers.Acknowledgements
No acknowledgement found.References
1. Detre JA, Leigh JS, Williams DS, et al. Perfusion imaging. Magnetic resonance in medicine. 1992; 23:37–45.
2. Lu H, Ge Y. Quantitative evaluation of oxygenation in venous vessels using T2-Relaxation-Under-Spin-Tagging MRI. Magnetic resonance in medicine. 2008; 60(2): 357-363.
3. Xu F, Ge Y, Lu H. Noninvasive quantification of whole-brain cerebral metabolic rate of oxygen (CMRO2) by MRI. Magnetic resonance in medicine 2009; 62(1): 141-148.
4. Ibaraki M, Shinohara Y, Nakamura K, et al. Interindividual variations of cerebral blood flow, oxygen delivery, and metabolism in relation to hemoglobin concentration measured by positron emission tomography in humans, Journal of Cerebral Blood Flow & Metabolism (2010); 30, 1296–1305.
5. Qin Q, Grgac K, van Zijl PC. Determination of whole-brain oxygen extraction fractions by fast measurement of blood T(2) in the jugular vein. Magnetic resonance in medicine. 2011; 65(2): 471-479.
6. Lu H, Xu F, Grgac K, et al. Calibration and validation of TRUST MRI for the estimation of cerebral blood oxygenation. Magnetic resonance in medicine. 2012; 67(1): 42-49.
7. Qin Q, Strouse JJ, van Zijl PC. Fast measurement of blood T1 in the human jugular vein at 3 Tesla. Magnetic resonance in medicine. 2011; 65(5): 1297-304.
8. Li W, Liu P, Lu H, et al. Fast measurement of blood T1 in the human carotid artery at 3T: Accuracy, precision, and reproducibility. Magnetic resonance in medicine. 2016, Epub ahead of print.
9. Brown MM, Wade JP, Marshall J. Fundamental importance of arterial oxygen content in the regulation of cerebral blood flow in man. Brain : a journal of neurology. 1985;108 ( Pt 1):81-93.
10. Massik J, Tang YL, Hudak ML, et al. Effect of hematocrit on cerebral blood flow with induced polycythemia. J Appl Physiol. 1987; 62(3): 1090-1096.
11. Hino A, Ueda S, Mizukawa N, et al. Effect of hemodilution on cerebral hemodynamics and oxygen metabolism. Stroke. 1992;23(3):423-426.
12. Guyton AC, Hall JE. Textbook of Medical Physiology,Unit VII Respiration, Chapter 40 Transport of Oxygen and Carbon Dioxide in Blood and Tissue Fluids, p508. 11th edition. Philadelphia: Saunders/Elsevier; 2005.
Figures