0353
Changes in cerebral blood flow and default mode network connectivity following mTBI observed with pulsed arterial spin labeling1Department of Psychiatry and Behavioral Neurosciences, Wayne State University, Detroit, MI, United States, 2Department of Biomedical Engineering, Wayne State University, Detroit, MI, United States, 3Department of Radiology, Wayne State University, Detroit, MI, United States
Synopsis
Mild traumatic brain injury (mTBI) or concussion disturbs both cerebral blood flow (CBF) and functional connectivity in intrinsic connectivity networks (ICNs). Using pulsed arterial spin labeling (PASL), we derived both CBF and ICNs in mTBI patients and investigated brain CBF responses to network disruptions. We observed that mTBI patients have decreased connectivity within the default mode network (DMN) in two regions as well as increased CBF in a third region which overlaps the DMN. The mismatch of these regions suggests potential repair or compensation for injury.
Purpose
Mild traumatic brain injury (mTBI) or concussion acutely disturbs both functional connectivity in intrinsic connectivity networks (ICNs) and cerebral blood flow (CBF). However, the relationship between these, and their relationship to brain recovery, a still unknown. While ICNs are usually studied with blood-oxygen-level dependent (BOLD)-based resting state functional magnetic resonance imaging (rsfMRI), recent work has shown that they can be identified with arterial spin labeling (ASL),1, 2 a quantitative method usually performed to measure CBF. This allows us to assess brain hemodynamics in a way that BOLD does not.3, 4 By using a single ASL sequence, we can assess both ICNs and CBF together to better identify the relationship between changes in network connectivity and CBF supply in mTBI patients.Methods
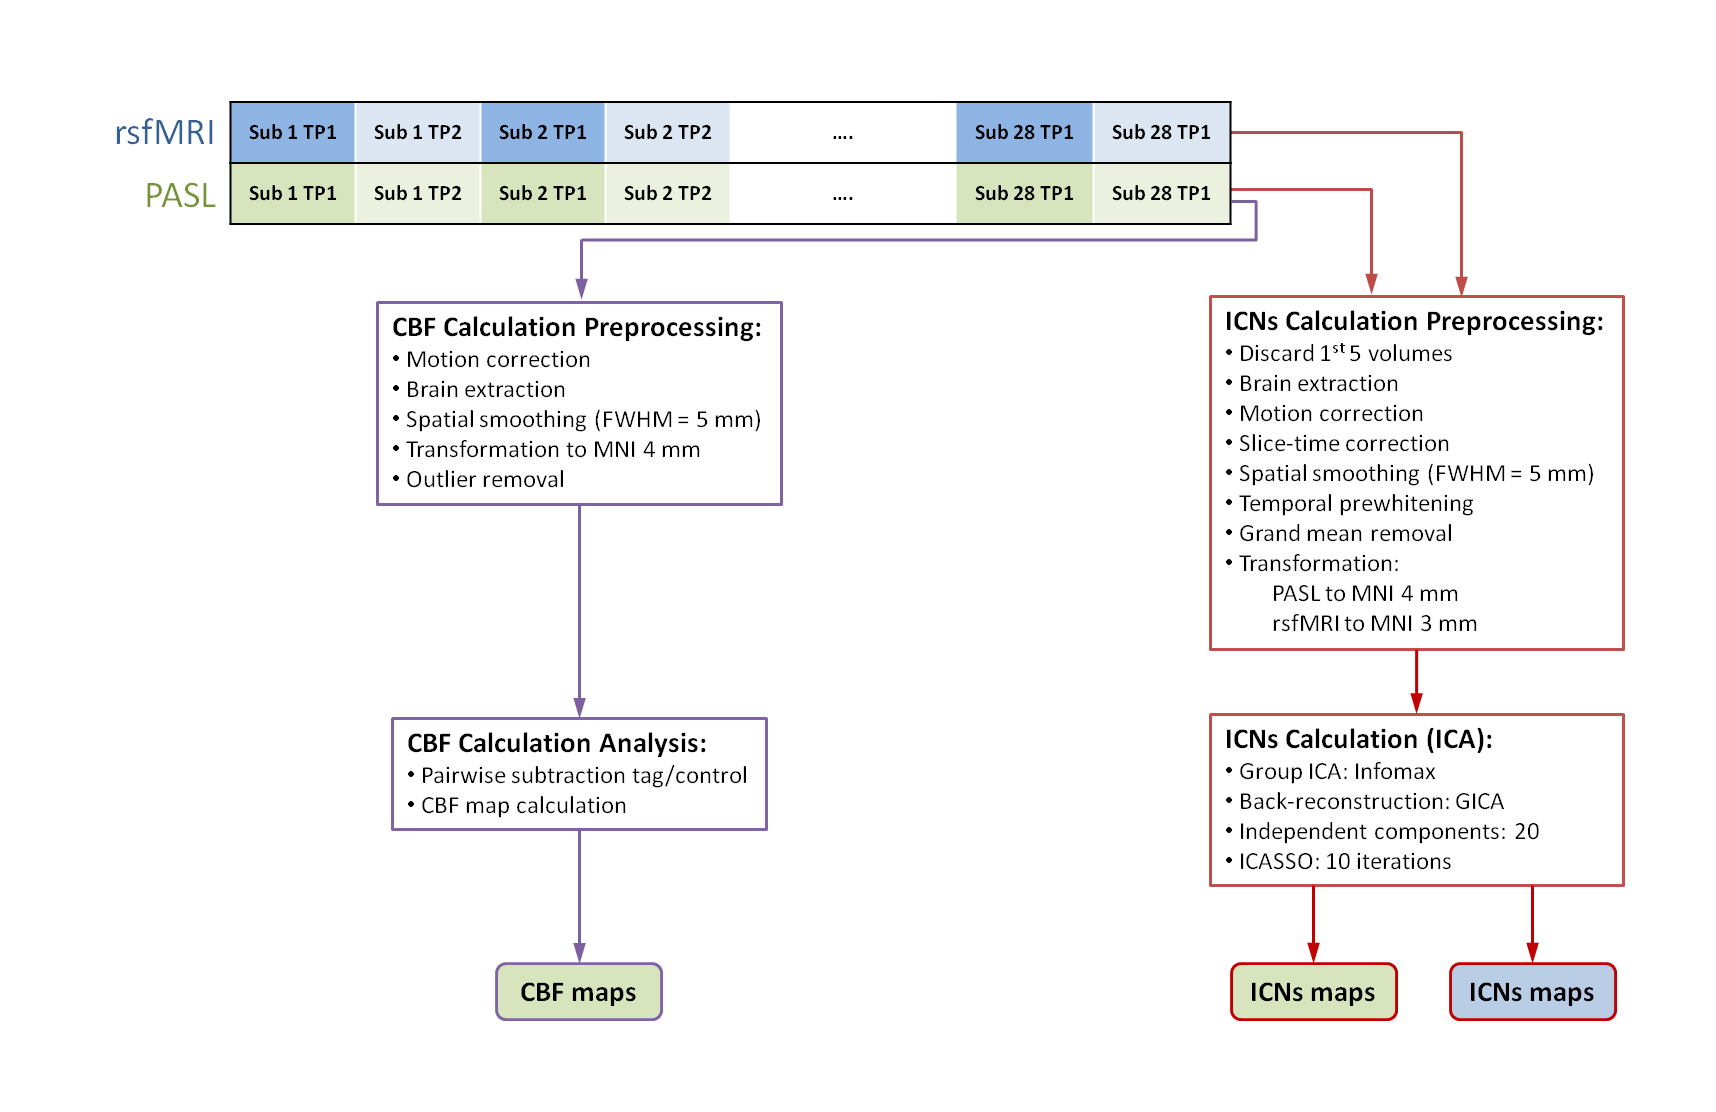
15 mTBI patients at the acute stage after injury and 13 healthy controls were scanned twice, one month apart, on a Siemens Verio 3T MRI (Siemens, Erlangen, Germany). PASL was performed with repetition time (TR)=2612.8 ms, echo time (TE)=13 ms, time between inversion and saturation (TI1) = 700 ms, and image acquisition time (TI2) = 1800 ms and resting state functional MRI was performed with TR=2000 ms and TE=30 ms. For connectivity analysis of PASL and rsfMRI, data were preprocessed and the GIFT toolbox was used to perform a 20 component independent component analysis (ICA; figure 1). Matched ICs were identified manually. Connectivity within the DMN was compared between patients and controls at both time points and between acute and follow-up for each group with non-parametric statistical analysis in FSL with FWE correction. For PASL data, CBF maps were calculated by performing a sinc subtraction of control and tag images, calculating the CBF map,5 and normalizing to the gray matter CBF mean and standard deviation. Two-sample t-tests were performed in FSL to compare across groups and time points with family-wise error (FWE)Results
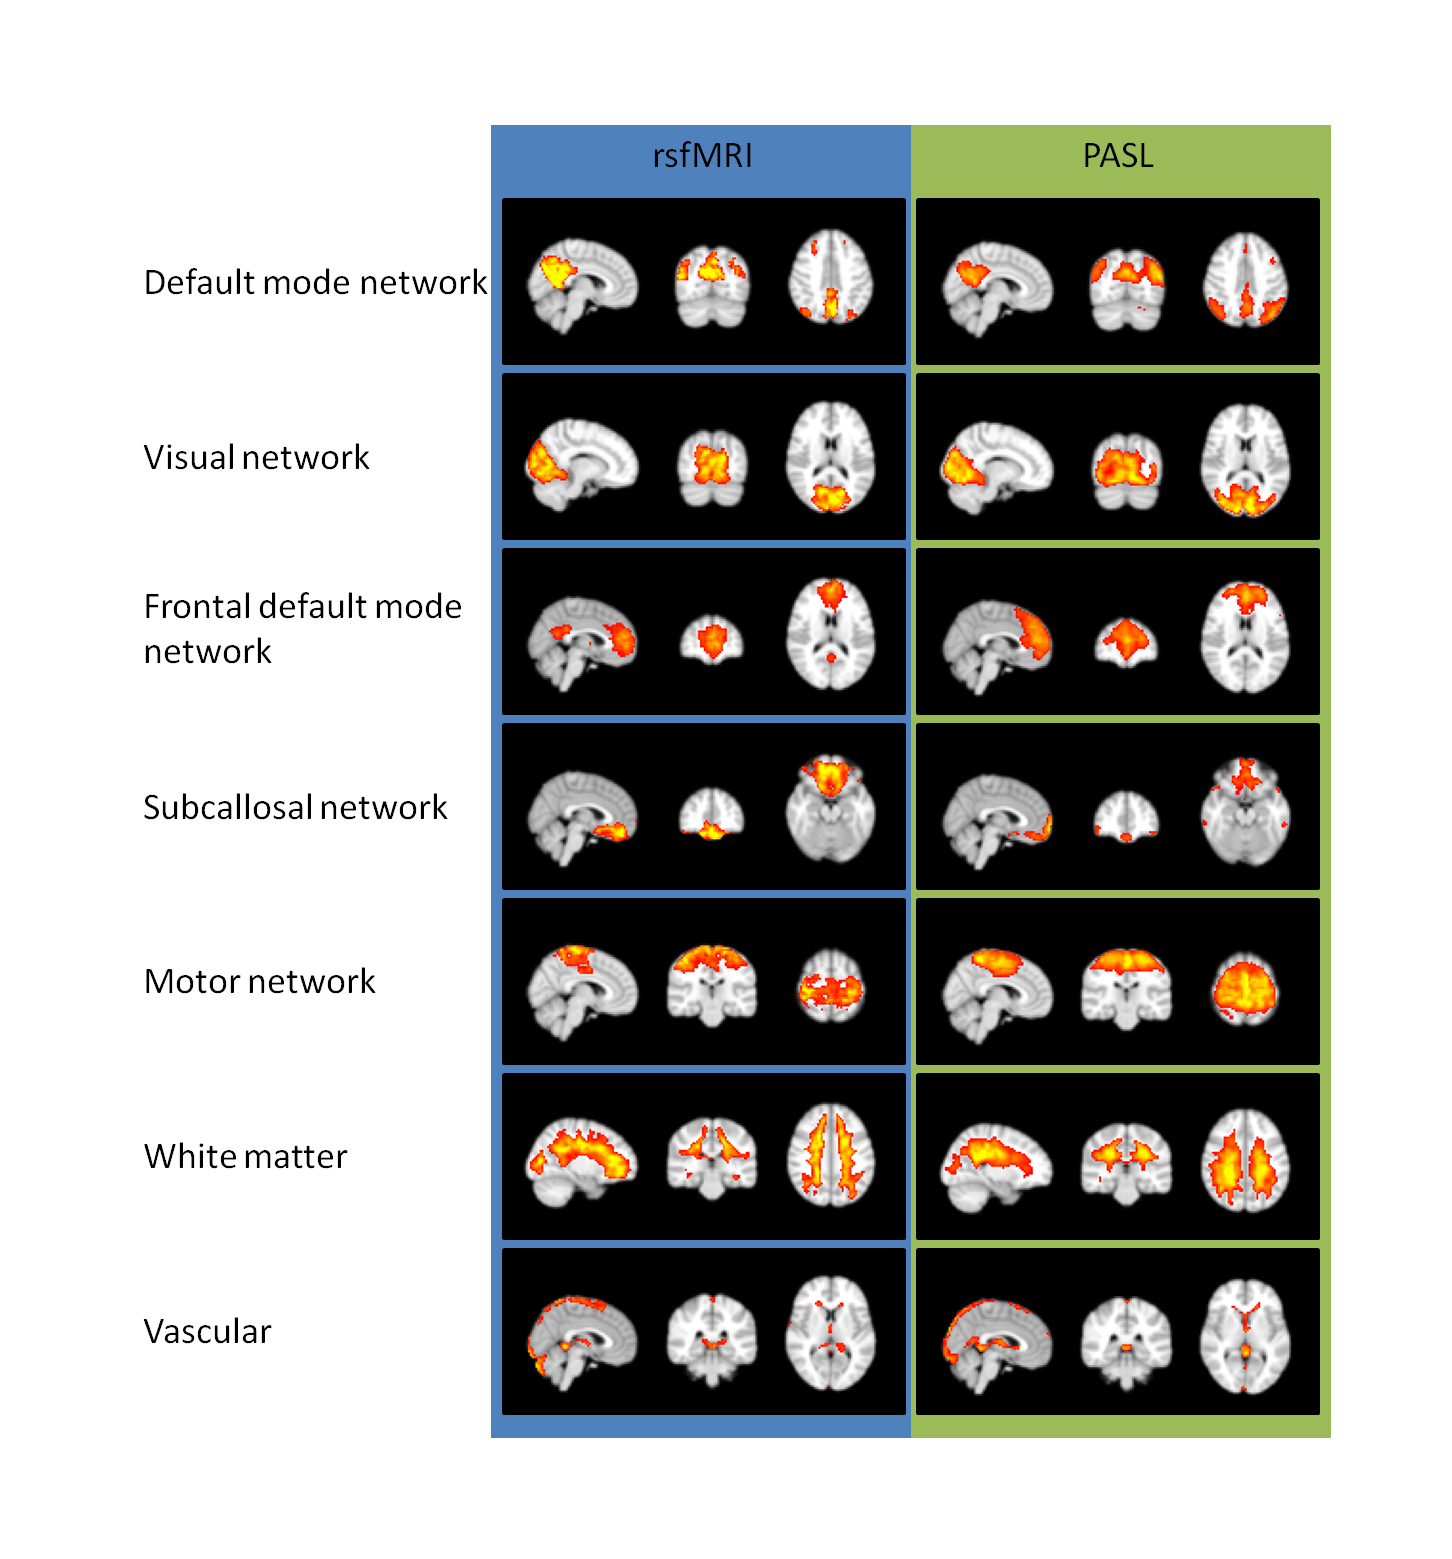
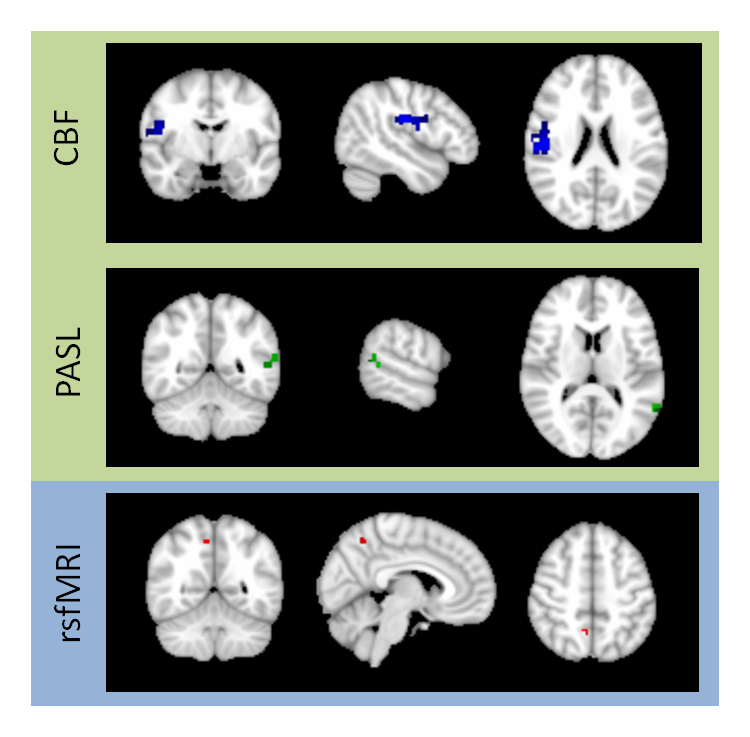
A 20-component independent component analysis (ICA) performed on both the PASL and rsfMRI data revealed 5 ICNs with high similarity between the two methods, including the default mode network (DMN), which is known to differ in mTBI, the motor network, the subcallosal network, the visual network, and the frontal DMN, as well as similar vascular and cerebrospinal fluid non-network components (figure 2). mTBI patients were found to have decreased involvement in the DMN in a 108 mm3 region in the right precuneus detected by rsfMRI and in regions of 64 mm3 in the left precuneus and 576 mm3 in the left angular gyrus detected by PASL, all at the second visit (figure 3). No other differences were found after FWE correction. In the voxel-wise CBF analysis, patients had increased CBF at the second visit in a region of 3,840 mm3 in the right angular gyrus, overlapping with the DMN (figure 3). No other differences were found after FWE correction.Discussion
Decreases in within-DMN connectivity support previous research showing the same in mTBI. These regions were substantially larger before FWE correction, which is known to be very conservative, suggesting that a less conservative method of multiple comparisons correction may better identify the extent of the affected regions. Increases in CBF in the right angular gyrus may suggest a change in neuronal or glial activity in response to injury. The inverse correlation between the connectivity and CBF changes suggests that the increase in CBF is not related to normal neuronal function but instead either repair or compensation for abnormal cellular activity.Conclusions
These results offer a promising first peek at the relationship between CBF and functional connectivity following mTBI. Our upcoming longitudinal study on the cerebral metabolic effects of mTBI will collect pseudocontinuous ASL (PCASL) data to study this relationship with greater sensitivity.2Acknowledgements
The first author is supported under NIH F30 grant HD084144 (PI: NMW). This project was supported by DoD grant W81XWH-11-1-0493 (PI: EMH), an International Society for Magnetic Resonance in Medicine Seed Grant (PI: ZK), and NIH R21 grant NS090153 (PI: ZK).References
1. Jann, K, DG Gee, E Kilroy, et al. Functional connectivity in BOLD and CBF data: Similarity and reliability of resting brain networks. NeuroImage, 2015;106:111-122.
2. Liang, X, J-D Tournier, R Masterton, et al. A k-space sharing 3D GRASE pseudocontinuous ASL method for whole-brain resting-state functional connectivity. International Journal of Imaging Systems and Technology, 2012;22(1):37-43.
3. Chuang, K-H, P van Gelderen, H Merkle, et al. Mapping resting-state functional connectivity using perfusion MRI. NeuroImage, 2008;40(4):1595-1605.
4. Buxton, RB Beyond BOLD correlations: A more quantitative approach for investigating brain networks. Journal of Cerebral Blood Flow & Metabolism, 2015.
5. Wang, J, DJ Licht, GH Jahng, et al. Pediatric perfusion imaging using pulsed arterial spin labeling. J Magn Reson Imaging, 2003;18(4):404-13.
Figures