0351
Regionally differentiated cerebral blood flow increases during infancy measured with pCASL MRI1Department of Radiology, Children’s Hospital of Philadelphia, Philadelphia, PA, United States, 2Department of Radiology, Perelman School of Medicine, University of Pennsylvania, Philadelphia, PA, United States, 3School of Psychological and Cognitive Sciences, Peking University, Beijing, People's Republic of China, 4Peking-Tsinghua Center for Life Science, Peking University, Beijing, People's Republic of China, 5Department of Radiology, Beijing Children’s Hospital, Capital Medical University, Beijing, People's Republic of China
Synopsis
During infant brain development, rapid neuronal growth requires increases of cerebral blood flow. In this study, we quantified cerebral blood flow (CBF) at regional level during infant development by using pseudo-continuous arterial spin labeled (pCASL) perfusion MRI. The CBF maps at different infant stages from 0 to 24 months were revealed. The trend lines of CBF at specific regions were charted. It has been found that the CBF increases linearly at different brain regions, with CBF increasing faster in visual, posterior cingulate, medial prefrontal and inferior parietal cortex than whole brain.
Purpose
Blood perfusion is an essential property of brain metabolism. During infant brain development, rapid neuronal growth requires increases of cerebral blood flow (CBF). With distinctive neuronal processes across the brain regions, the CBF increases to meet metabolic demand are heterogeneous accordingly. In this study, we aimed to quantify CBF at regional level during infant development from 0 to 24 months by using pseudo-continuous arterial spin labeled (pCASL) perfusion MRI. The CBF measurements of various cortical regions in infant brains may offer insights into the physiological maturation in early years.Method
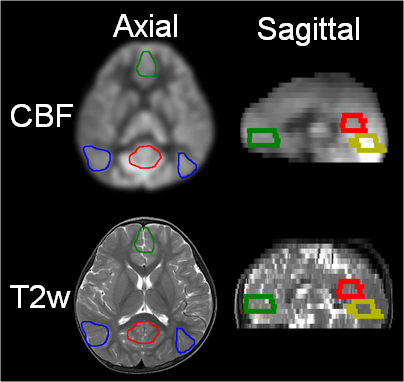
Infant subjects and acquisition of pCASL perfusion MRI: Thirteen infants (6 females, age range: 1 to 24 months) were recruited. pCASL perfusion MRI was acquired using a 3T Philips Achieva system. The pCASL perfusion MRI parameters were: multi-slice single-shot EPI readout, field of view (FOV) = 208×208 mm2, matrix = 76×76, in-plane resolution = 2.74×2.74 mm2, 18 slices, slice thickness = 5 mm, no gap between slices, labeling duration = 1600 ms, post labeling delay (PLD) = 1650 ms, center of labeling slab located at the junction of spinal cord and medulla (65mm below central slab of imaging volume), repetition time = 4700 ms, echo time = 15 ms, number of controls/labels = 30 pairs, α = 0.86. In addition, a high-resolution T2-weighted image was acquired for anatomical guidance. CBF measurements: Briefly, CBF can be estimated from pCASL data using equation from [1] fpCASL(x,y,z) = (6000 ∙ λ ∙ ∆M(x,y,z) ∙ exp(PLD(z) / T1a )) / (2α ∙ M0 ∙ T1a ∙ (1 - exp(-LabelDur / T1a ))) : where is the blood flow at voxel (x,y,z) obtained from pCASL in milliliters of blood per minute per 100g brain tissue (ml/100g/min); ΔM is the difference between dynamic-averaged signal intensity in control image and that in the label image at voxel (x, y, z); λ, the blood-brain partition coefficient, is 0.9 mL/g [2]; PLD(z), the post labeling delay time at the slice z, is 1650+(z-1)*w, where w is the slice timing delay between adjacent slices; LabelDur, the labeling duration, is 1600ms; T1a, T1 of arterial blood, is 1800ms [3-4]. Age dependent CBF increase at different regions: The regions of interests (ROIs) at visual cortex (VC), posterior cingulate cortex (PCC), medial prefrontal cortex (MPFC), and inferior parietal lobule (IPL) were defined manually based on the anatomical T2w image (Fig 1). Averaged CBF values at each region and whole brain were correlated with subject age using linear regression.Result
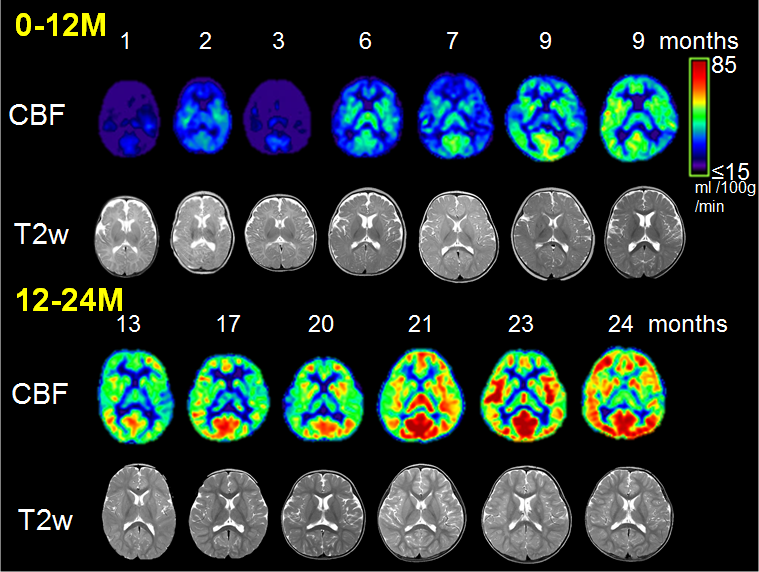
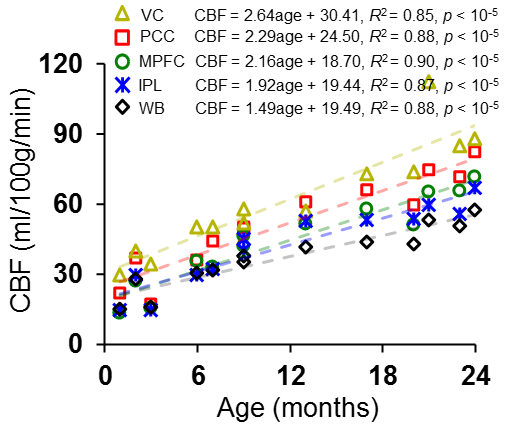
CBF maps of the infant brains: Fig 2 shows that the CBF increases heterogeneously across the brain regions from 0 to 24 months. Regional CBF differences at a certain age and general increases of CBF with age are clear in Fig 2. CBF measurements in some regions, such as occipital cortex, are higher than other regions. Heterogeneous CBF increases among brain regions: Fig. 3 shows the significant CBF increases (p < 10-5) measured at five ROIs and averaged over the whole brain. Interestingly, the CBF increases appear faster and CBF values are higher in the default-mode network (DMN) regions: PCC, MPFC and IPL. Within DMN, the increases of CBF at PCC appear slightly faster than other DMN regions. The CBF increases at all the four DMN regions appear faster than the average of the whole brain.Discussion and conclusion
In this study, we found that the CBF increased with age and CBF increases were heterogeneous among different brain regions during infancy. That CBF increases at key DMN regions appear faster than those of the whole brain. It suggests that faster increases of blood supply be demanded by DMN and VC regions than other regions during infant development. Previous studies show that regional CBF is closely coupled with glucose utilization, aerobic glycolysis and oxygen consumption in resting brains [5-6]. Heterogeneous CBF increases among the brain regions underlie the regionally differentiated metabolic needs. CBF is tightly coupled with functional connectivity strength of DMN and visual regions in adult brain [7]. Prominent increases of CBF at DMN regions may be associated with the establishment of the brain networks. Acquisition of more infant pCASL data is underway. The significant differences of CBF increase rates will be tested with statistical analysis with more pCASL data included.Acknowledgements
This study is funded by NIH MH092535, MH092535-S1 and HD086984.References
[1] Chalela et al. (2000) Stroke 31: 680.
[2] Herscovitch & Raichle (1985) Cereb Blood Flow Metab 5: 65.
[3] Liu et al. (2015) Magn Reson Med 75: 1730.
[4] Varela et al. (2011) NMR Biomed 24: 80.
[5] Raichle et al. (2001) PNAS 98: 676.
[6] Vaishnavi et al. (2010) PNAS 107: 10757.
[7] Liang et al. (2012) PNAS 110: 1929.
Figures