0350
Propagation Patterns of Cardiac-driven and Respiratory-driven Cerebrospinal Fluid Velocity Waves Characterized by Correlation Mapping in Conjunction with Asynchronous 2-Dimensional Phase Contrast Technique1Graduate School of Science and Technology, Tokai University, Hiratsuka, Kanagawa, Japan, 2Graduate School of Engineering, Tokai University, Hiratsuka, Kanagawa, Japan, 3Department of Neurosurgery, Tokai University School of Medicine, Isehara, Kanagawa, Japan
Synopsis
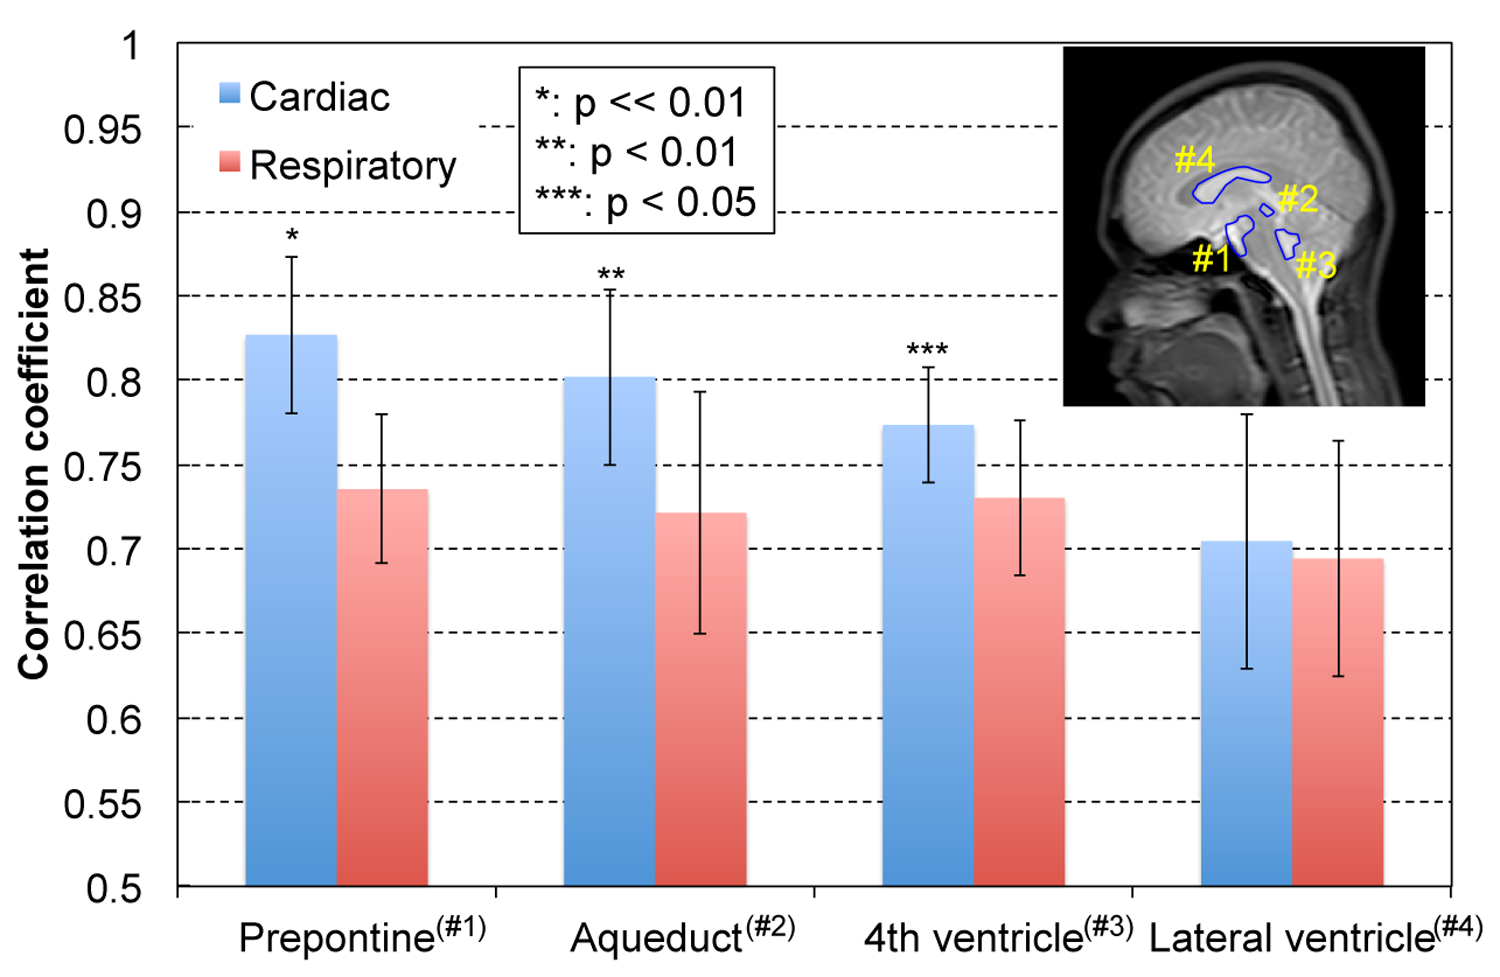
Spatial distributions of the propagation patterns of cerebrospinal fluid (CSF) motion driven by cardiac pulsation and respiration were visualized using velocity waveform correlations based on asynchronous 2-dimensional phase contrast (2D-PC) imaging. These two different driving mechanisms were evaluated using spectral analysis of the velocity waveforms for 11 healthy subjects. Delay time maps and maximum correlation maps showed the spatial distribution differences between the cardiac-driven and respiratory-driven CSF motion propagations. Maximum correlation at the prepontine was 0.83±0.05 for cardiac propagation and 0.74±0.04 for respiratory propagation with a significant difference (p << 0.01). Strong propagation may not necessarily cause large CSF displacement.
Introduction
The need to analyze cerebrospinal fluid (CSF) dynamics has been increasing lately because the mass transfer function of CSF correlates to neurodegenerative diseases, such as Alzheimer's disease.1,2 CSF motion is primarily governed by cardiac pulsation, respiration, and bulk flow. The CSF displacement driven by respiration has been reported to be larger than that by cardiac pulsation.3 Recently, the feasibility of characterizing the propagation delay and similarities between cardiac-driven and respiratory-driven CSF motion using correlation mapping has been reported.4 This present study aimed to characterize cardiac-driven and respiratory-driven CSF motion using asynchronous two-dimensional phase contrast (2D-PC)-based correlation mapping to characterize CSF dynamics with a larger number of subjects.
Methods
Asynchronous 2D-PC imaging using 3.0-T MRI was conducted for 11 healthy volunteers (10 males; 1 female; 25±5 y-o). The volunteers received audio instructions to respire for 6 sec (3 sec each for both inhalation and exhalation). An electrocardiogram (ECG) and a bellows-type pressure sensor were used to monitor the subjects’ cardiac pulsation and respiration. The following 2D-PC images with steady-state free precession were acquired: flow encoding direction, foot-head; TR, 6.0 msec; TE, 3.9 msec; parallel imaging factor, 4; acquisition matrix, 89×128 (half Fourier); reconstruction matrix, 256×256; field of view, 28×28 cm2; slice thickness, 7 mm; velocity encoding, 10 cm/sec; data points, 256; temporal resolution, 217 ms (4.7 frame/sec). The conditions resulted in 56 sec of asynchronous CSF observation.
Fourier analysis was used to identify the cardiac-driven and respiratory-driven velocities, and the spectrum of each velocity was obtained. The cardiac-driven frequency band was ±0.15 Hz around the spectral peak frequency of the ECG signal, and the respiratory band was calculated from the peak frequency for the respiratory signal. The cardiac-driven and respiratory-driven CSF velocities were obtained by inversely transforming their frequency bands, respectively.
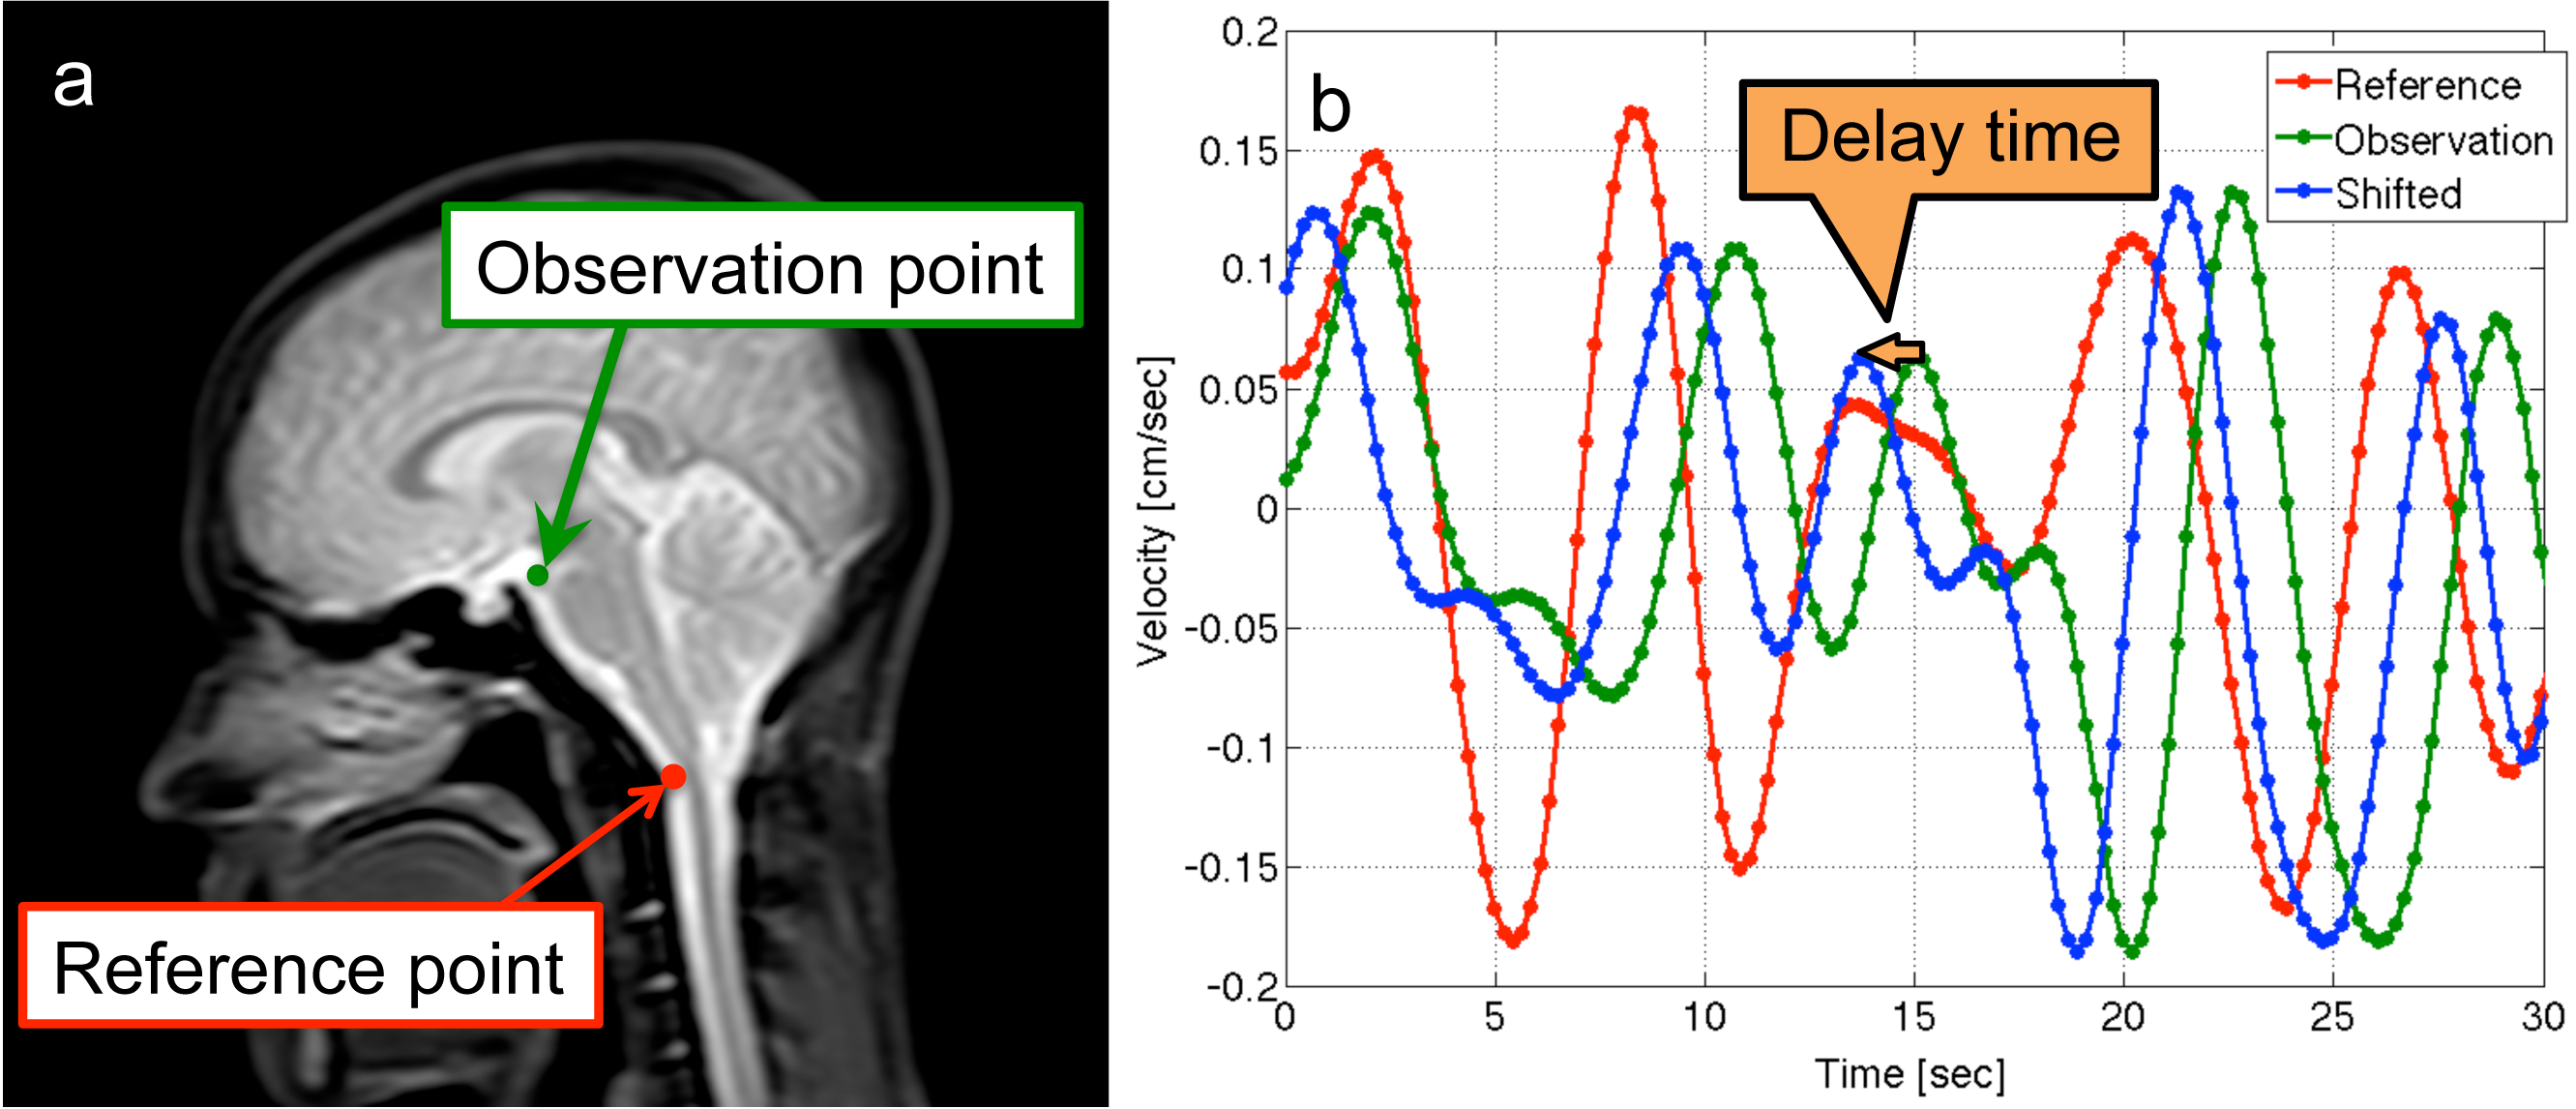
Correlation mapping, which set the reference at the spinal subarachnoid space, was applied to the cardiac-driven and respiratory-driven velocities. As shown in Figure 1, the respiratory-driven velocity was used for easy visibility. The delay time was calculated as the amount of the shift that had the highest correlation with the reference. The highest correlation was defined as the maximum correlation. The delay time and maximum correlation maps were obtained by calculating those values for each voxel.
The region of interest (ROI)
analysis of the maximum correlation map was conducted for the prepontine,
aqueduct, 4th ventricle, and lateral ventricle. Moreover, average
CSF displacements for the cardiac or respiratory cycles were calculated by
integrating and quantifying the absolute velocity waveforms for each cycle at all
ROIs.
Results
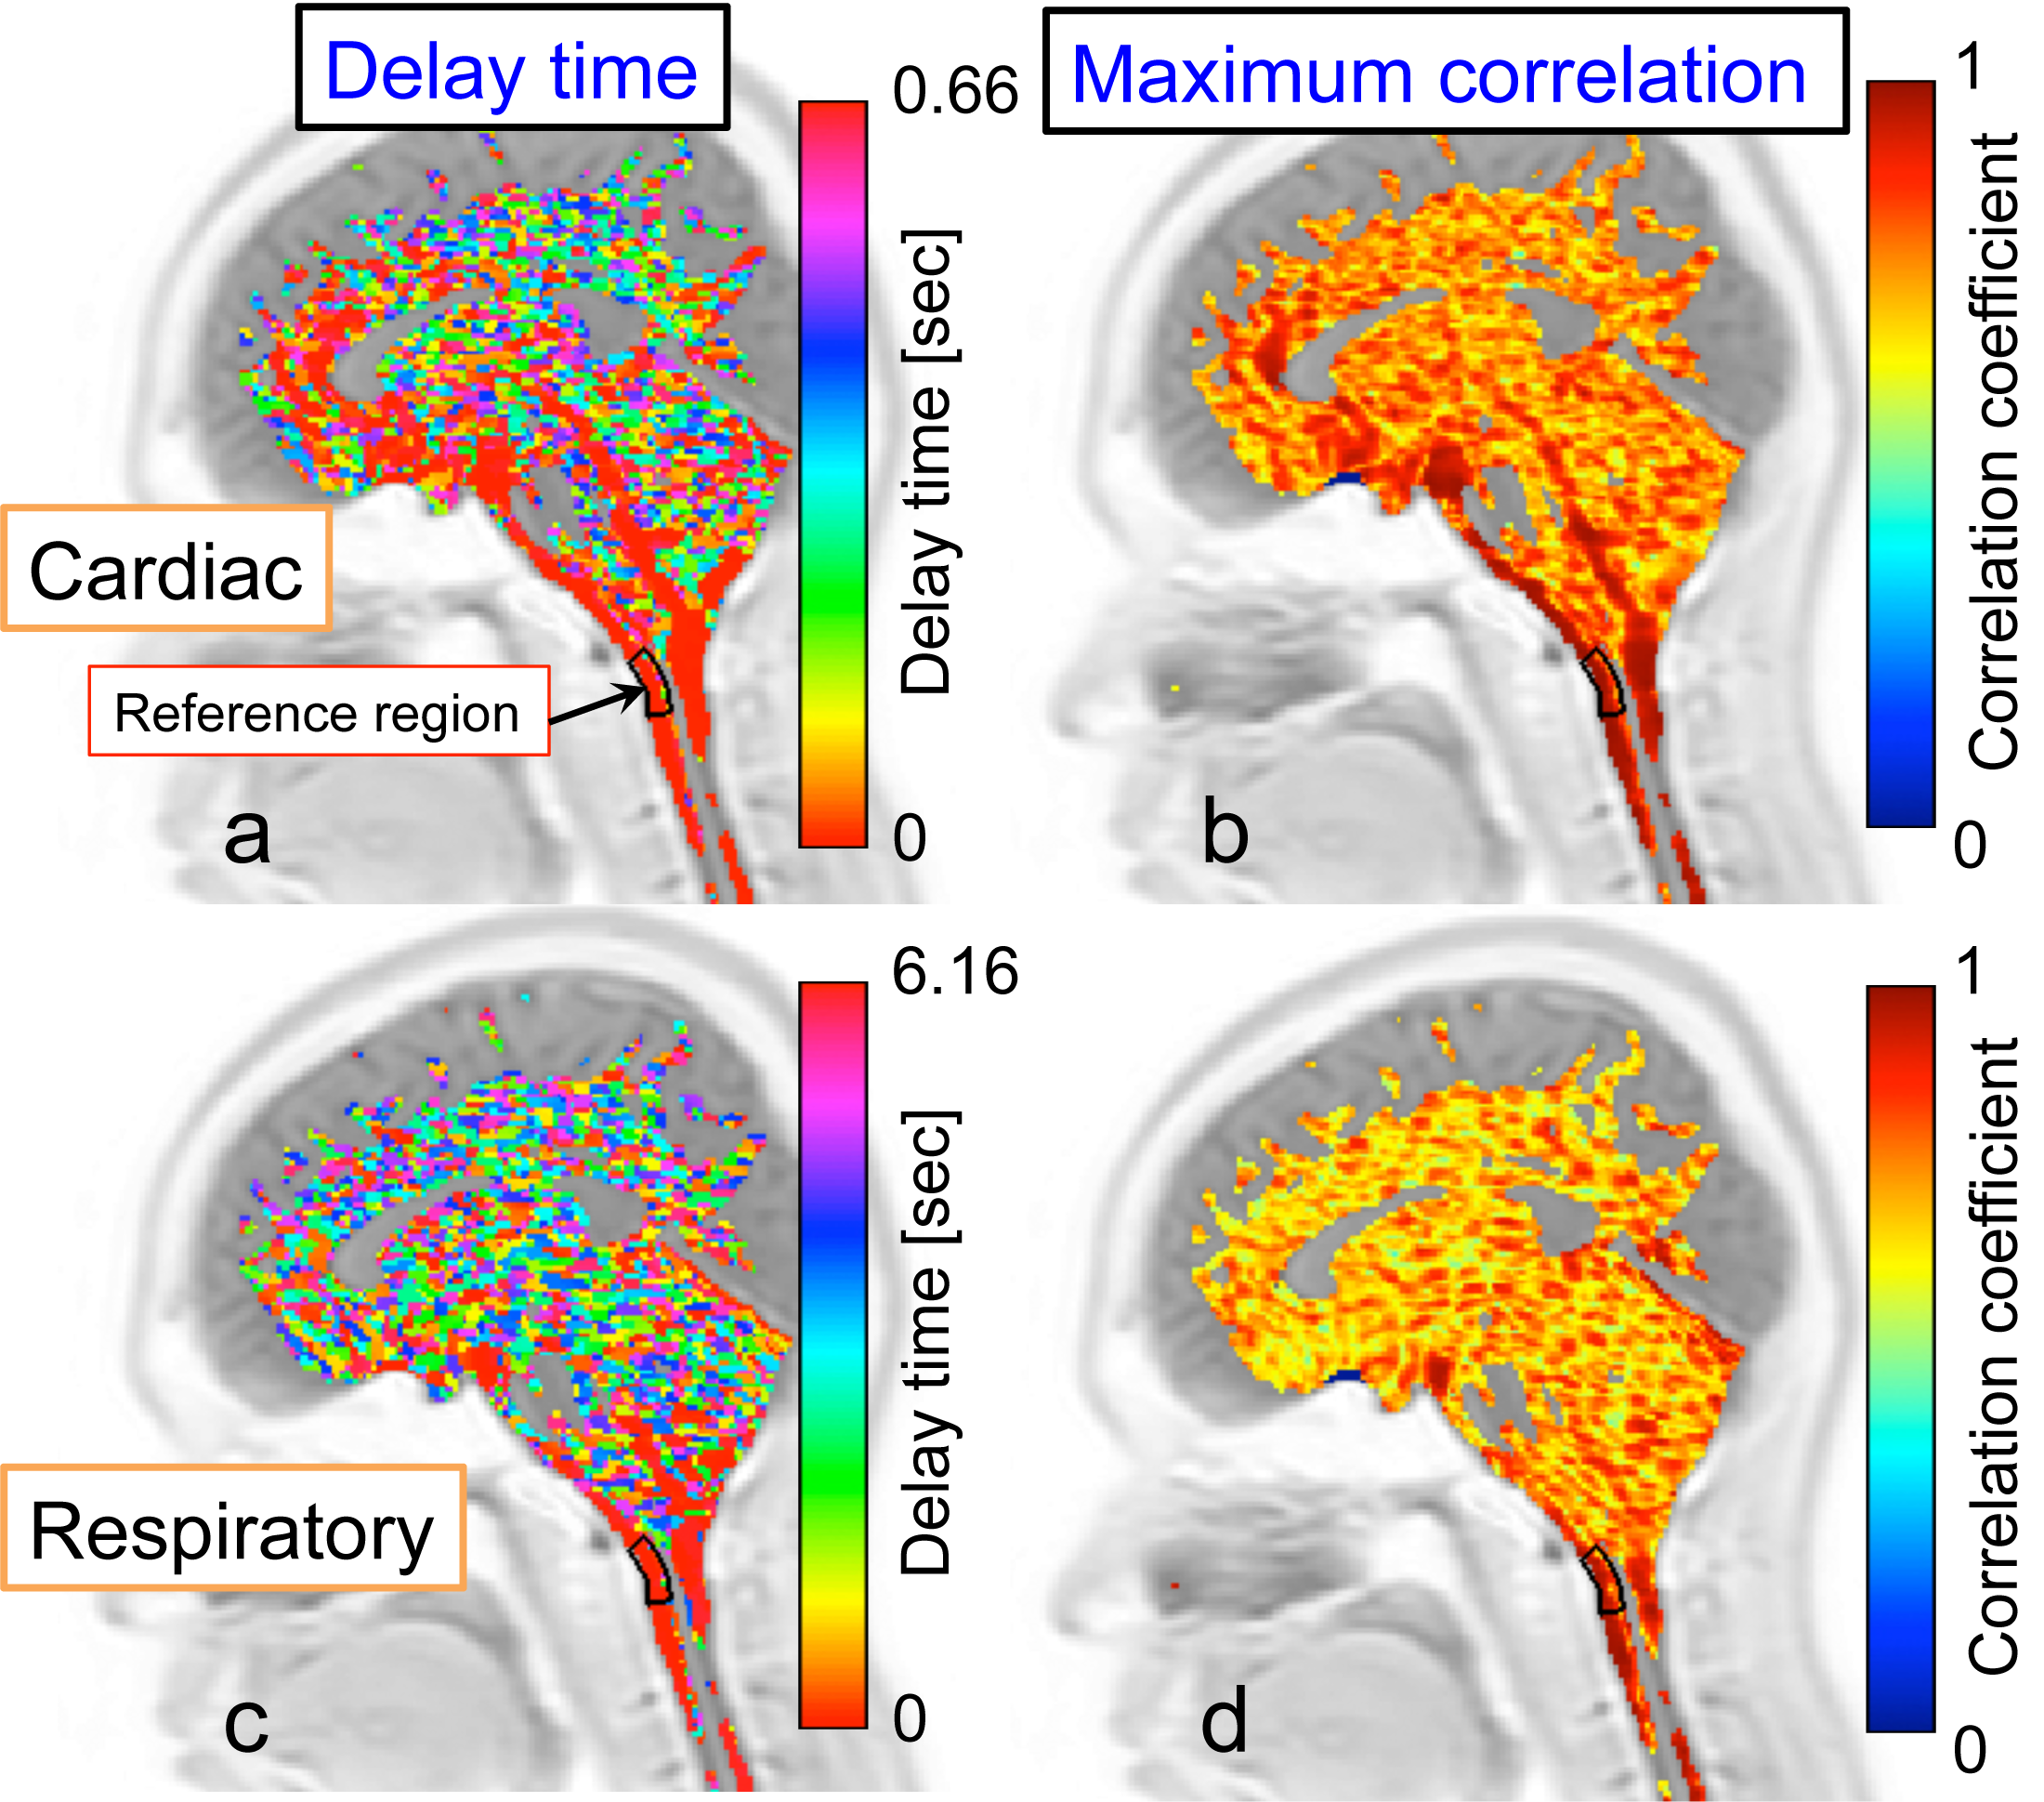
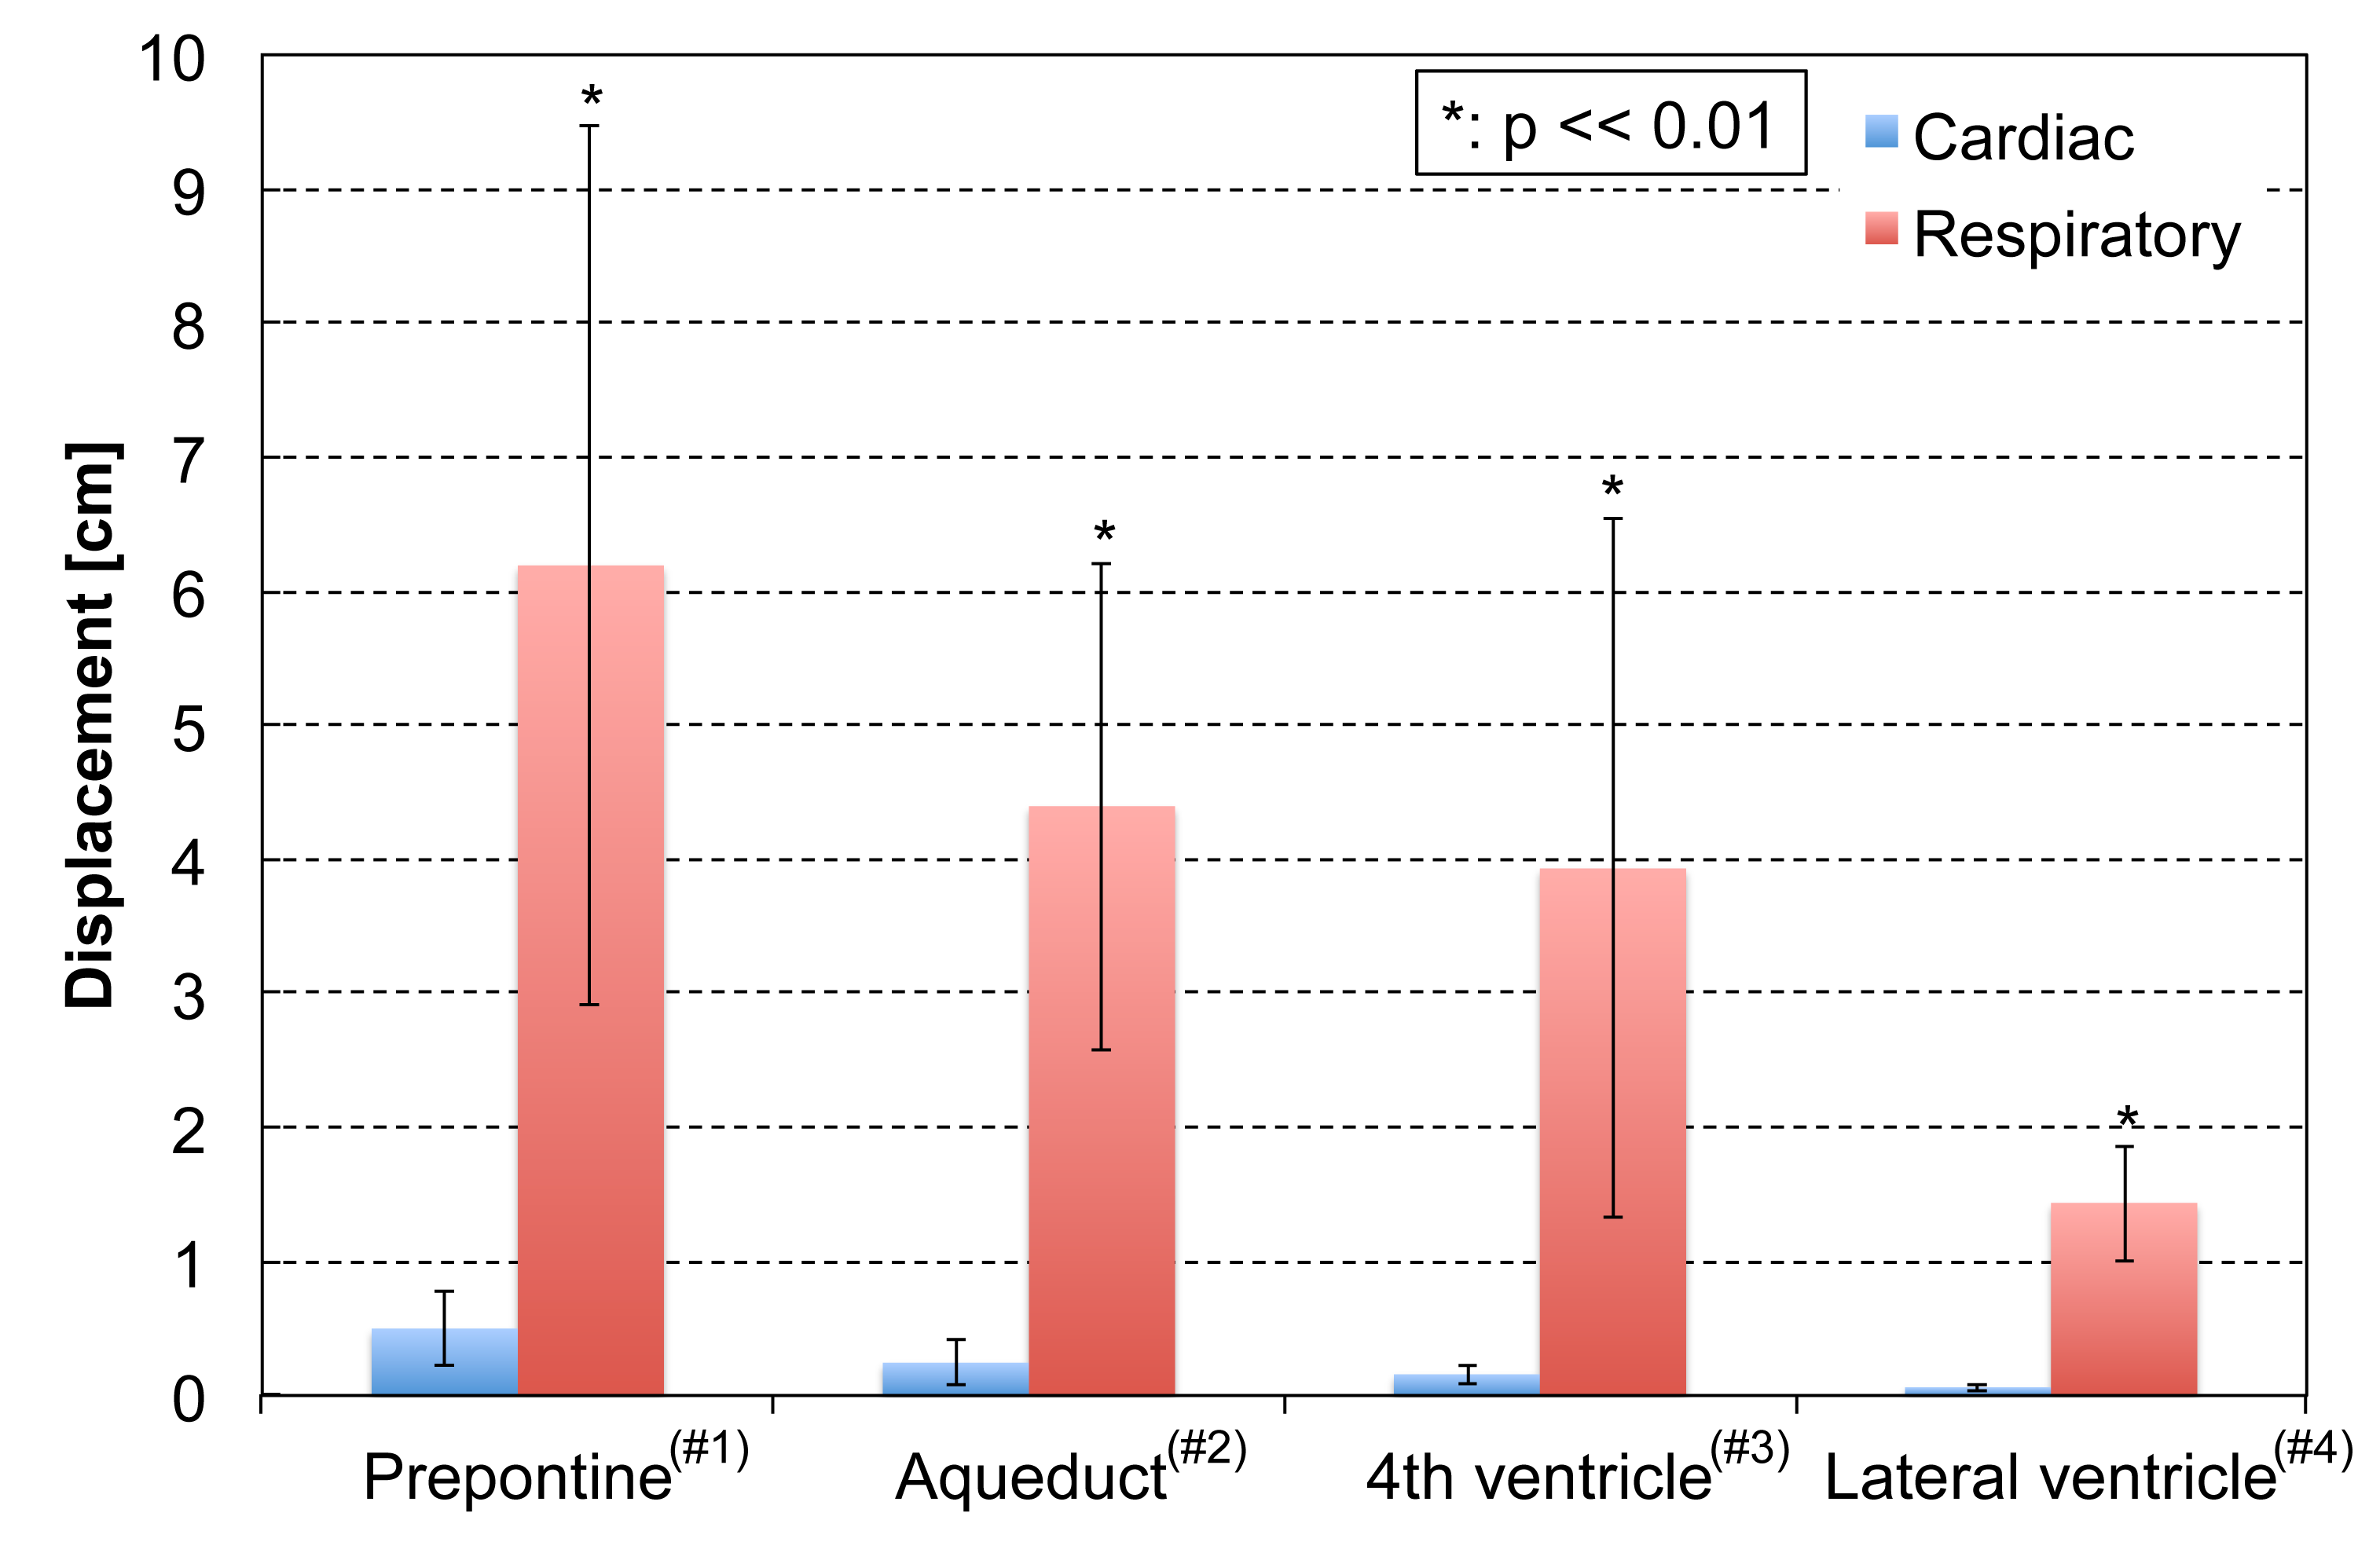
An example of correlation mapping in intracranial space applied to the cardiac-driven and respiratory-driven CSF velocities is shown in Figure 2. The left side shows the cardiac (a) and respiratory (c) delay times, while the right side shows the cardiac (b) and respiratory (d) maximum correlation maps. The quantitative results of the maximum correlation maps are shown in Figure 3. An example of the ROIs setting is seen on the T2-image (Figure 3). Significant differences can be seen between the cardiac and respiratory ROIs in the prepontine (p << 0.01), aqueduct (p < 0.01), and 4th ventricle (p < 0.05). Quantification of the cardiac-driven and respiration-driven CSF displacements is presented in Figure 4, which shows significant differences for all ROIs (p << 0.01).
Discussion
Correlation mapping with Fourier analysis was used to evaluate the cardiac-driven and respiratory-driven CSF motions that characterized the propagation. The mapping technique is expected to capture a change of condition by a disease, such as hydrocephalus.
The delay time maps of the cardiac-driven CSF motion propagation show a shorter delay near the brainstem than that of the respiratory-driven propagation. In addition, the maximum correlation maps showed a higher distribution for the cardiac-driven propagation. In contrast, both maps for the respiratory-driven condition showed unclear propagation. Respiration with a pressure change per unit time in the CSF space that is small relative to the cardiac-driven propagation may cause unobvious velocity propagation in the space.
Figure 3 presents the differences in the propagation properties between the cardiac-driven and respiratory-driven conditions, and Figure 4 shows the significant differences between those displacements. These results indicate that the significant propagation of CSF velocity may not necessarily lead to a large displacement of the fluid. Note that the calculated CSF displacement from the velocity waveform does not correspond to the spin travel of the fluid.
Conclusion
Correlation mapping with asynchronous 2D-PC imaging demonstrated and characterized cardiac-driven and respiratory-driven CSF dynamics in the intracranial space. Strong propagation of CSF velocity may not correspond to a large CSF displacement in the intracranial space.Acknowledgements
The authors thank Prof. Yutaka Imai, Mr. Tomoaki Horie, Mr. Nao Kajihara for their assistance with MR imagingReferences
1. Brinker T, Stopa E, Morrison J, Klinge P. A new look at cerebrospinal fluid circulation. Fluids and Barriers of the CNS, 2014;11:10.
2. Oreskovic D, Klarica M. A new look at cerebrospinal fluid movement. Fluids and Barriers of the CNS, 2014;11:16.
3. Yamada S, Miyazaki M, Yamashita Y, et al. Influence of respiration on cerebrospinal fluid movement using magnetic resonance spin labeling. Fluids and Barriers of the CNS, 2013;10(1):36.
4. Yatsushiro S, Sunohara S, Takizawa K, Matsumae M, Kajihara N, Kuroda K. Characterization of cardiac- and respiratory-driven cerebrospinal fluid motions using correlation mapping with asynchronous 2-dimensional phase contrast technique. 2016 38th Annual International Conference of the IEEE Engineering in Medicine and Biology Society (EMBC), 2016; p. 3867-3870.
Figures