0349
Non-contrast vascular compliance mapping using time-resolved VASO CBV imaging1Department of Radiology, Johns Hopkins University School of Medicine, Baltimore, MD, United States, 2Graduate School of Biomedical Sciences, UT Southwestern Medical Center, Dallas, TX, United States
Synopsis
Vascular compliance reflects the stiffness of arterial vessel wall and has been related to a number of diseases, such as cardiovascular disease, cerebral arteriosclerosis, and hypertension. However, the vascular compliance at intracranial arteries has been rarely measured due to limited availability of effective methods. In this work, a 3D VASO-CBV-based MR technique was developed to assess the arterial CBV change with respect to pulsation and thus estimate vascular compliance. With this technique, we were able to map vascular compliance along the intracranial arterial tree.
Introduction
Vascular compliance (VC) is an important predictor of cardiovascular disease and stroke. Vascular compliance is traditionally measured with ultrasound, which can only be applied in large vessels outside the skull. ASL-based methods were proposed1,2, but T1-related signal decay limits its application in small vessels. Here, we developed a 3D VASO-CBV method to measure time-resolved CBV fluctuation as a function of cardiac phase, from which VC is estimated. This technique, when combined with 3D angiogram for display, allows visualization of vessel compliance map along the intracranial arterial tree.Methods
Pulse sequence: VASO was originally developed to assess CBV changes in response to brain activation3. Here the main idea is to measure CBV changes within a cardiac cycle, which is presumably related to vascular compliance. To tailor the VASO technique for applications in intracranial arteries (as opposed to focusing on tissue as in fMRI studies), two changes were made to the conventional VASO sequence (Fig. 1a). One was that the non-selective inversion was replaced by a 110° pulse (BIR-4) 4, so that the blood-nulling point (TI2=476 ms) is shorter and prevents fresh, uninverted spins to arrive at the arterial tree. The second modification was that a slab-selective inversion pulse was placed at TI1=2000 ms before the non-selective pulse to prepare the magnetization of CSF such that its signal is positive at the time of acquisition (see simulation results in Fig. 1b). This way, regardless of whether the increase in CBV is accommodated by CSF or tissue volume reduction (or their combination), the VASO signal will always change in one direction (decreases when CBV increases).
Theory: The relative VASO signal difference between systolic and diastolic phases is related to artery CBV (aCBF) difference by $$$\triangle{S/S=-}\triangle{aCBV/(1-aCBV)}$$$ (Ref. 3). When aCBV is much smaller than 1, the equation simplified to $$$\triangle{S/S=-}\triangle{aCBV}$$$. The vascular compliance index (VC) can be written as $$${VC=}\triangle{aCBV/}\triangle{P=(-}\triangle{S/S)/}\triangle{P}$$$, where $$$\triangle{P}$$$ is the central pulse pressure and is assumed to be 40 mmHg in this study.
Experiment: Three healthy subjects (24±5yo) were scanned on a 3T (Philips), after IRB-approved informed consent was obtained. The imaging parameters were: TI1=2000 ms, TI2=476 ms, TR=6000 ms; 3D GraSE readout, FOV=180×180×104 mm3, resolution=4.5×4.5×8.0 mm3, echo train length=164 ms; 100 dynamics, acquisition time ~10 min. A pulse device was attached to the finger of the subject, yielding R-peaks that were used to calculate cardiac phase of each acquisition (Fig. 1c). In order to verify that the VASO signal change was indeed due to CBV pulsation, a gated phase-contrast on internal carotid artery (ICA) was also acquired. Finally, an angiogram (3D ToF) was acquired to generate artery mask for display overlay.
Data analysis: The 100 VASO images were sorted by their cardiac phase. For each voxel, its signal intensity was plotted as a function of cardiac phase and then fitted to a 2nd-order Fourier series (4 coefficients). The difference between upper and lower peaks gives $$$\triangle{S}$$$. The average of the curve gives $$${S}$$$. Therefore, voxel-by-voxel VC can be calculated accordingly.
Results
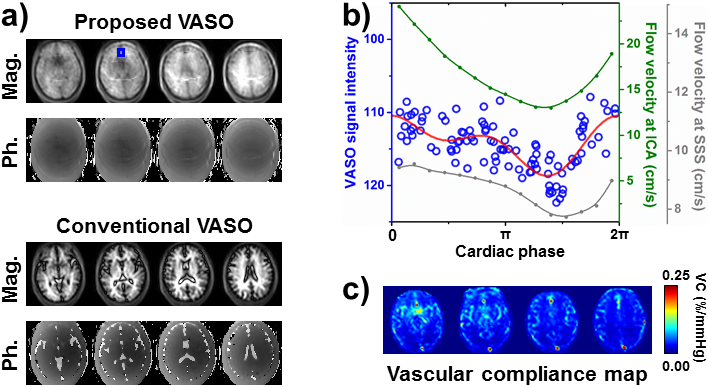
Figure 2a shows an example of proposed VASO images (including both magnitude and phase images). Note that both brain tissue signal and CSF signal are of same phase, unlike conventional VASO. VASO signal as a function of cardiac phase (blue dots in Fig. 2b) exhibits clear pulsatile modulation, suggesting aCBV fluctuation. The timing pattern of aCBV fluctuation is consistent with that of CBF fluctuation, as can be seen in the cardiac-gated phase-contrast data (green curve in Fig. 2b).
Figure 2c displays a voxel-by-voxel VC map. Large arteries, e.g. middle cerebral artery (MCA), anterior cerebral artery (ACA), and posterior cerebral artery (PCA), reveal higher VC values than the smaller vessels. Interestingly, large vein, such as superior sagittal sinus (SSS), also shows high VC. Gated phase-contrast image suggested that large veins also have pulsatile flow (gray curve in Fig. 2b).
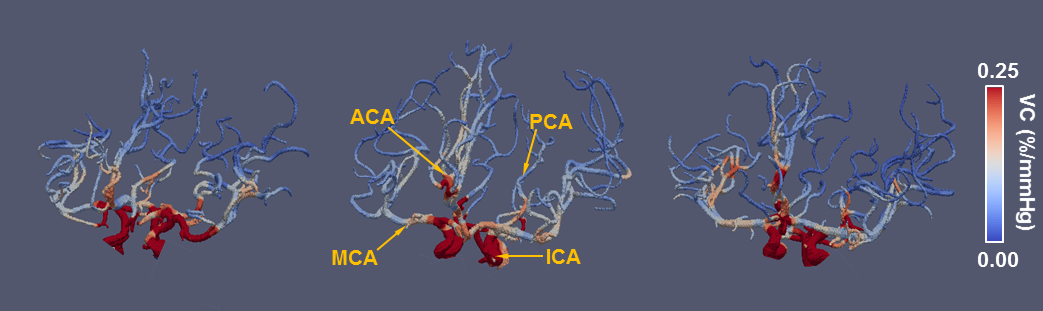
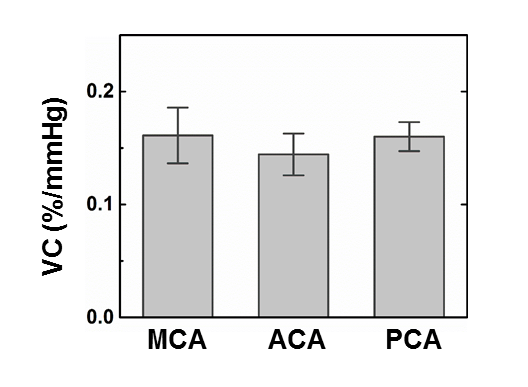
To better visualize the results, VC map was rendered onto a 3D arterial tree structure that is generated from angiogram. Figure 3 shows the VC-value-encoded 3D arterial trees from all three subjects. It can be seen that, as the vessel extends from trunk to branches, VC also gradually decreases. ROI values of VC in major arteries are shown in Figure 4.
Conclusion
We demonstrated that arterial CBV fluctuation in a cardiac cycle can be quantified with a 3D VASO-MRI technique, the timing of which is consistent with CBF fluctuation. Such data can be used to map vascular compliance of intracranial arteries. This method may have potential utility in studies of cerebral arteriosclerosis, hypertension, diabetes, and related diseases.Acknowledgements
No acknowledgement found.References
1. Yan L, et al. Assessing intracranial vascular compliance using dynamic arterial spin labeling. NeuroImage 2015;124:433-441.
2. Warnert E, et al. Noninvasive assessment of arterial compliance of human cerebral arteries with short inversion time arterial spin labeling. J. Cereb. Blood Flow Metab. 2015;35:461-468.
3. Lu H, et al. Functional Magnetic Resonance Imaging Based on Changes in Vascular Space Occupancy. Magn. Reson. Med. 2003;50:263-274.
4. Huber L, et al. Slab-selective, BOLD-corrected VASO at 7 Tesla provides measures of cerebral blood volume reactivity with high signal-to-noise ratio. Magn. Reson. Med. 2014;72:137-148.
Figures