0348
Comparative Study of 3D Arterial Spin Labeling and dynamic contrast-enhanced MRI of Nasopharyngeal Carcinoma perfusion imaging1Key Laboratory of Cancer Prevention and Therapy, Department of Radiology, Tianjin Medical University Cancer Institute & Hospital, Tianjin, People's Republic of China, 2MR Research China, GE Healthcare, Beijing, People's Republic of China
Synopsis
DCE-MRI is already a standard approach to evaluating tumor perfusion in NPC, but it may induce severe side-effects. ASL is a noninvasive MRI technique that has been mainly used to achieve perfusion imaging in central nerve system. In this study, we attempt to evaluate the application of ASL in NPC. Thirty-eight newly diagnosed NPC patients underwent 3D ASL and DCE-MRI perfusion scans on a 3.0-T MRI system. ASL BF value and DCE-MRI parameters were calculated and compared. Statistically significant correlation was found between them. Therefore, 3D ASL may provide a potential alternative to DCE-MRI in NPC diagnosis and therapy evaluation.
Purpose
Nasopharyngeal carcinoma (NPC) is a mainly malignant tumor of head and neck, which is commonly seen in Southern China and Southeast Asia [1]. Assessment of NPC perfusion plays an important role in diagnosis, and in devising optimal treatment plan [2,3]. Dynamic contrast-enhanced magnetic resonance imaging (DCE-MRI) is already a standard approach to evaluating tumor perfusion in head and neck region including nasopharynx [4,5]. However, DCE-MRI requires administration of an exogenous contrast media, which may have side-effects such as allergy and nephrogenic systemic fibrosis (NSF)[6,7]. Arterial spin labeling (ASL) is a noninvasive MRI technique which utilizes magnetically labelled water protons in blood as an endogenous contrast agent to achieve perfusion imaging. Previous studies of ASL were mainly focused on central nerve system [8,9]. The purpose of the current study was to explore the feasibility of this novel technique in evaluating local blood perfusion in NPC.Method
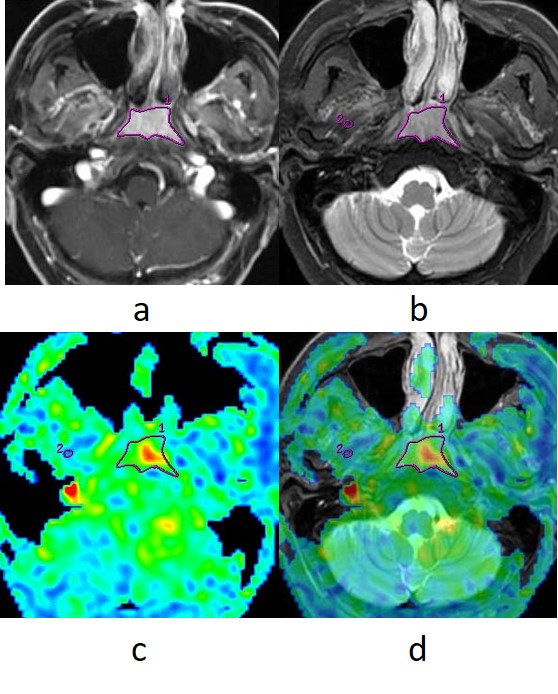
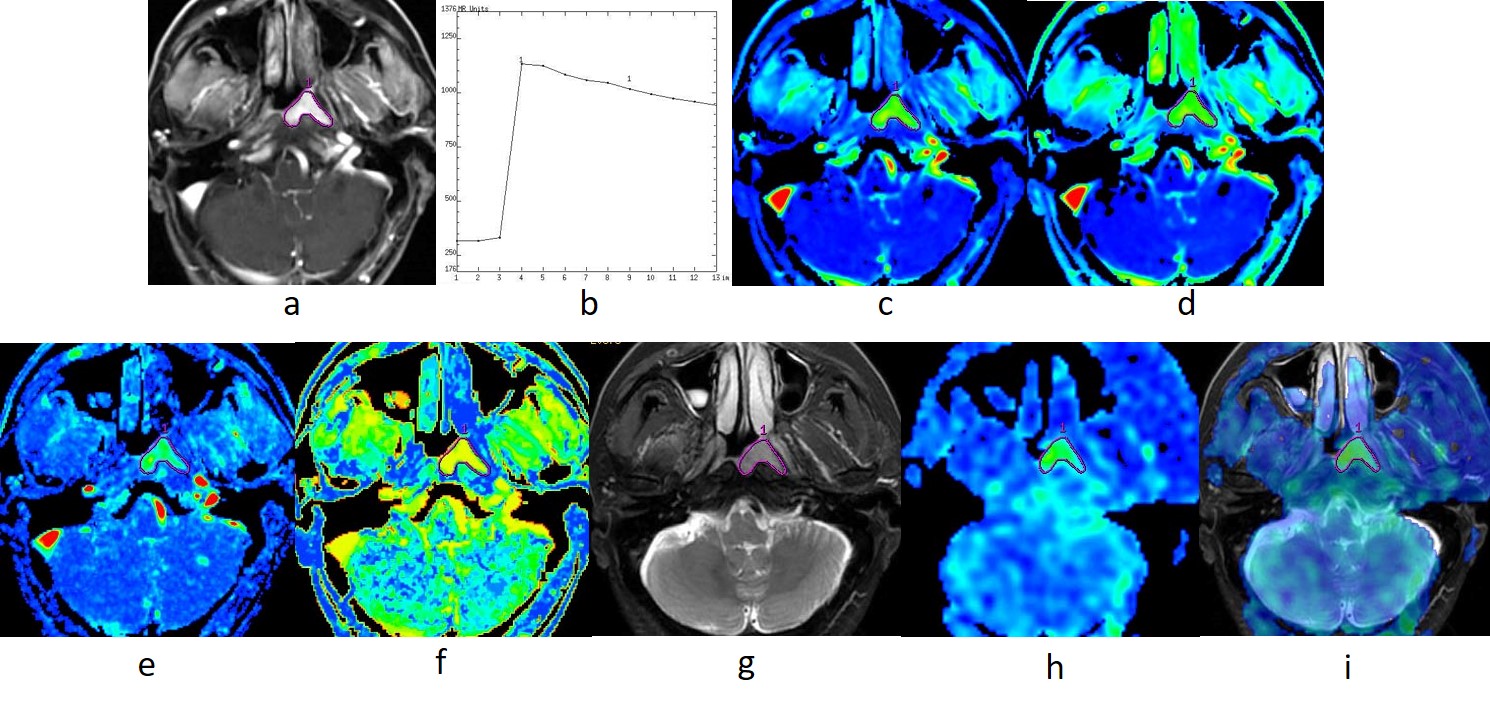
A prospective study was reviewed by the ethics committee of the hospital. All recruited patients signed written informed consent. In total 38 newly diagnosed NPC patients were included in this study. MR imaging examinations of the whole nasopharynx were performed with a 3.0T MRI scanner (Discovery MR 750; GE Medical Systems, Milwaukee, WI, USA), utilizing an eight channel head and neck phase array coil. The imaging protocol included: (1) axial T1-weighted images; (2) axial T2-weighted images with IDEAL; (3) axial DWI; (4) axial 3D ASL; (5) axial DCE-MRI. Intravenous bolus injection of 0.1 mmol/kg Gd-DTPA was administered at 2 ml/s for the postcontrast acquisition. Thirteen MR data acquisitions were obtained for each patient at an interval of 20 s (0-240 s). ASL blood flow (BF) and DCE-MRI positive enhancement integral (PEI), maximum slop of increase (MSI), maximum slop of decrease (MSD), time to peak (TTP) were obtained to evaluate local blood perfusion. The region of interest (ROI) in the lesion was selected as shown in Fig.1. Comparison of ASL BF between NPC and lateral pterygoid muscle (LPM) was conducted by paired samples t test. The Pearson correlation coefficient between ASL BF and DCE-MRI parameters were calculated.Results
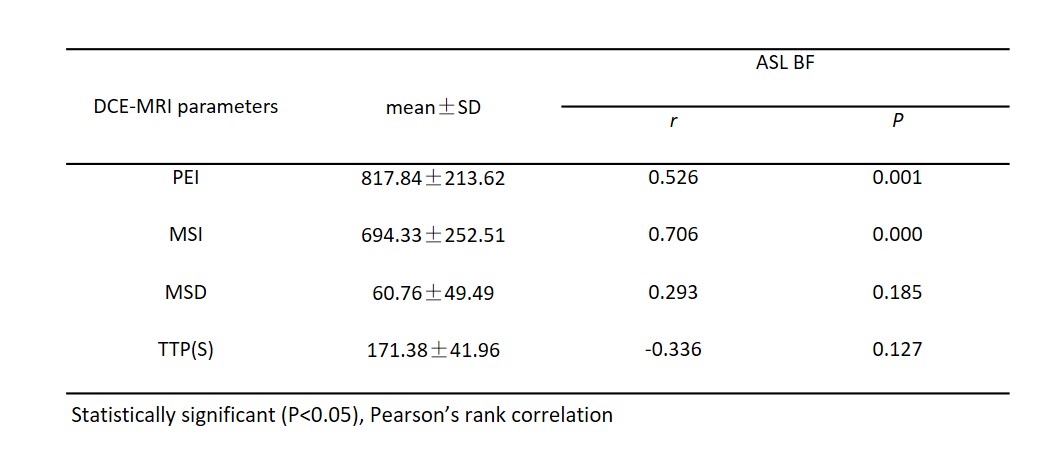
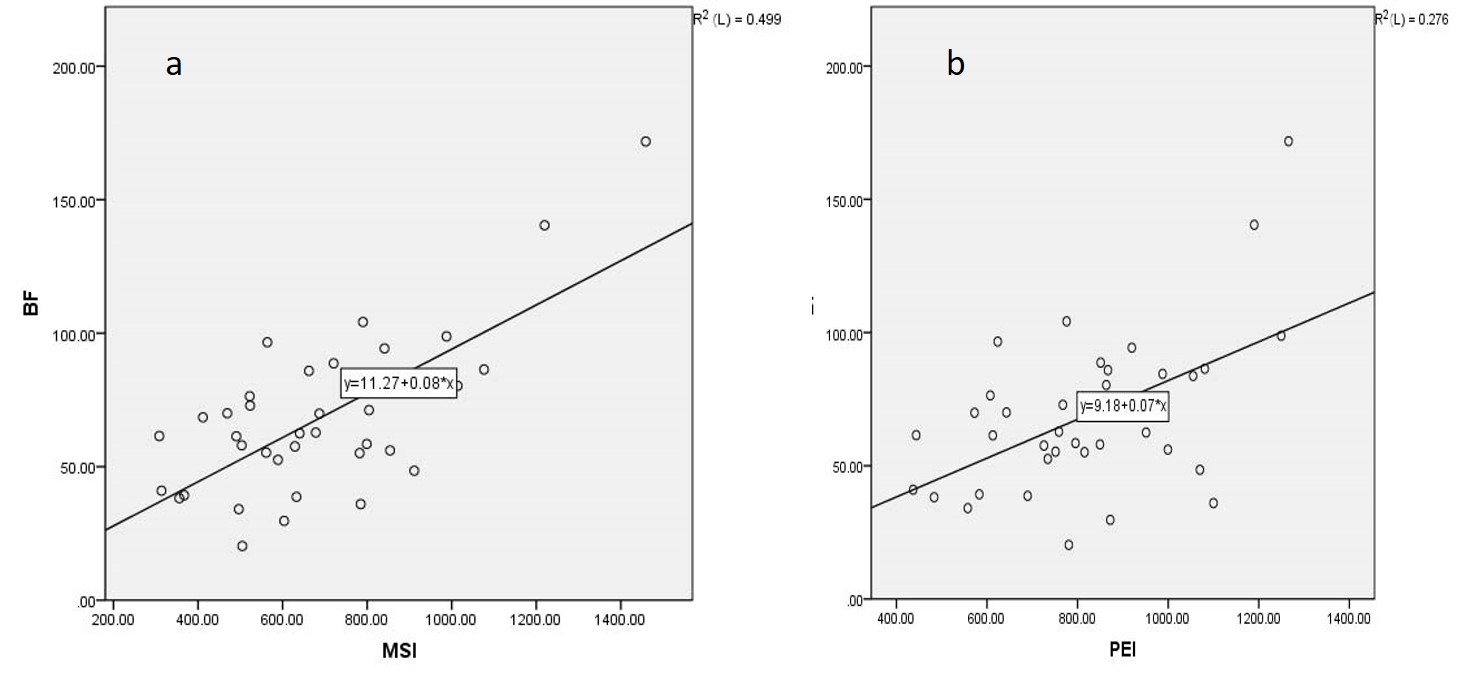
The ASL BF value of NPC and LPM were 68.73±29.58 (mL/min/100 g) and 19.86±3.98 (mL/min/100 g) respectively. The ASL BF value of NPC was significantly higher than that of LPM (t=9.84, P=0.000). The correlations between the DCE-MRI parameters (PEI, MSI, MSD and TTP) and ASL BF in NPC were assessed by using Pearson’s correlation coefficient (Table 1). The highest degree of correlation was found between MEI and ASL BF (r=0.706, P=0.000; Fig 2a). Strong correlation existed between PEI and ASL BF (r=0.526, P=0.001; Fig 2b). No statistically significant correlation was observed between MSD and ASL BF (r=0.293; P=0.185), or TTP and ASL BF (r=-0.336; P=0.127).Discussion
Because of high tumor angiogenesis, hyper perfusion is an important feature of NPC. In this study, the ASL BF value of NPC was significantly higher than that of LPM. Therefore, an ASL BF map is able to provide good contrast between tumor and non-tumor regions (Fig. 3). In our results, ASL BF had highest degree of correlation with MSI, strong correlation with PEI, and no significant correlation with MSD and TTP. The neovasculature of tumors in patients with NPC showed increased perfusion and permeability. MSI was an important parameter for describing the max rate of contrast agent flowing into the tumor, which reflects the level of tumor angiogenesis. It became the primary influential factor of tumor perfusion. Previous studies on the correlations of DCE-MRI parameters and biomarkers of angiogenesis showed that MSI correlates with the pericyte coverage index and expression of vascular endothelial growth factor receptor 2 (VEGFR-2)[10]. ASL BF related blood flow in tumor tissue directly. Many studies demonstrate a positive linear correlation between DSC and ASL measurements of CBF in brain tumors[11-13]. According to the high degree of correlation between ASL BF and MSI in our study, we deduced that ASL BF is able to reflect the angiogenesis of NPC. PEI is a parameter which describes the whole process of contrast agent flowing into and out of the tumor. In our study, it shown that there’re correlation existed between PEI and ASL BF. MSD and TTP mainly reflecte the permeability and extravascular extracellular space (EES) of tumor which were less correlated with ASL BF in this study.Conclusion
3D ASL reveals hyper perfusion region of NPC on ASL BF map without using injected contrast agent. ASL BF correlates with MSI significantly in quantitative evaluation of NPC perfusion.Acknowledgements
No acknowledgement found.References
1. Lai V, Khong P L. Updates on MR imaging and 18 F-FDG PET/CT imaging in nasopharyngeal carcinoma[J]. Oral Oncology. 2014, 50(6):539-548.
2. Jin G, Su D, Liu L, et al. The accuracy of computed tomographic perfusion in detecting recurrent nasopharyngeal carcinoma after radiation therapy[J]. Journal of Computer Assisted Tomography. 2011, 35(1):26-30.
3. Huang B, Wong C S, Whitcher B, et al. Dynamic contrast-enhanced magnetic resonance imaging for characterising nasopharyngeal carcinoma: comparison of semiquantitative and quantitative parameters and correlation with tumour stage[J]. European Radiology. 2013, 23(6):1495-1502.
4. Dechun Zheng M S, Yunbin Chen M D, Xiangyi Liu M S, et al. Early response to chemoradiotherapy for nasopharyngeal carcinoma treatment: Value of dynamic contrast-enhanced 3.0 T MRI[J]. Journal of Magnetic Resonance Imaging. 2015, 41(6):1528–1540.
5. Jahng G H, Li K L, Ostergaard L, et al. Perfusion magnetic resonance imaging: a comprehensive update on principles and techniques.[J]. Korean Journal of Radiology Official Journal of the Korean Radiological Society. 2014, 15(5):554-577.
6. Collidge T A, Thomson P C, Mark P B, et al. Gadolinium-enhanced MR imaging and nephrogenic systemic fibrosis: retrospective study of a renal replacement therapy cohort.[J]. Radiology. 2007, 245(1):168-175.
7. Broome D R, Girguis M S, Baron P W, et al. Gadodiamide-Associated Nephrogenic Systemic Fibrosis: Why Radiologists Should Be Concerned[J]. Ajr American Journal of Roentgenology. 2007, 188(2):586-592.
8. Van Laar PJ, Van Der Grond J, Hendrikse, J. Brain perfusion territory imaging: methods and clinical applications of selective arterial spin-labeling MR imaging[J]. Radiology. 2008;246(2), 354–364.
9. Detre J A, Rao H, Wang D J J, et al. Applications of arterial spin labeled MRI in the brain[J]. Journal of Magnetic Resonance Imaging. 2012, 35(5):1026-1037.
10. Thomassin-Naggara I, Bazot M, Daraï E, et al. Epithelial ovarian tumors: value of dynamic contrast-enhanced MR imaging and correlation with tumor angiogenesis.[J]. Radiology, 2008, 248(1):148-159.
11. Thomsen H, Steffensen E, Larsson E M. Perfusion MRI (dynamic susceptibility contrast imaging) with different measurement approaches for the evaluation of blood flow and blood volume in human gliomas.[J]. Acta Radiologica, 2012, 53(1):95-101.
12. Järnum H, Steffensen E G, Knutsson L, et al. Perfusion MRI of brain tumours: a comparative study of pseudo-continuous arterial spin labelling and dynamic susceptibility contrast imaging[J]. Neuroradiology, 2010, 52(4):307-17.
13. Ba C M W, Whitney B. Pope MD PhD, Taryar Zaw B S, et al. Regional and Voxel-Wise Comparisons of Blood Flow Measurements Between Dynamic Susceptibility Contrast Magnetic Resonance Imaging (DSC-MRI) and Arterial Spin Labeling (ASL) in Brain Tumors[J]. Journal of Neuroimaging Official Journal of the American Society of Neuroimaging, 2014, 24(1):23–30.
Figures