0343
Comparison of acceleration algorithms in whole-heart 4D flow MRI for aortic and mitral valve flow assessment1Radiology, Leiden University Medical Center, Leiden, Netherlands, 2University of Leeds, Leeds, United Kingdom
Synopsis
Accelerated acquisition is required to make 4D flow MRI clinically feasible. In this study, three commonly used acceleration approaches are compared. Validation of flow volume and velocity assessment is performed in phantoms and comparison against conventional 2D phase-contrast is done across the aortic and mitral valve in 25 healthy volunteers. 4D flow MRI with echo-planar-imaging shows largest in vitro error in velocity assessment, however, the bias is within clinically acceptable margins. In volunteers, 4D flow MRI with echo-planar-imaging produces most reliable quantitative results in flow volume and velocity and presents the shortest acquisition time with satisfactory image quality.
Background
Time-resolved three-dimensional (3D) three-directional velocity-encoded phase-contrast (PC) MRI, also known as four-dimensional (4D) flow MRI, is increasingly being used for intra-cardiac flow assessment, however, the associated long acquisition times still limit its use in clinical routine. Implementations of various accelerated data sampling methods, (eg. fast k-space readout by echo-planar-imaging (EPI) or multi-shot segmented readout, parallel imaging, undersampling and interpolated reconstruction with k-t Broad-use Linear Acquisition Speed-up Technique (BLAST)), have resulted in free-breathing whole-heart 4D flow MRI protocols with scan times of under 10 minutes. A recently published consensus document1 recommends the use of segmented fast gradient-echo (4D-TFE, turbo-field-echo) for 4D flow MRI with segmentation factor 2. However, validation of this recommended technique versus other published acceleration algorithms is lacking. The aim of this study was to validate three commonly applied acceleration methods: 4D-TFE, 4D-EPI2 and 4D-k-t-BLAST3 in vitro and to compare in vivo in healthy volunteers, scanned at two sites, for duration, image quality and reliability in quantifying intra-cardiac flow velocities and volumes.Methods
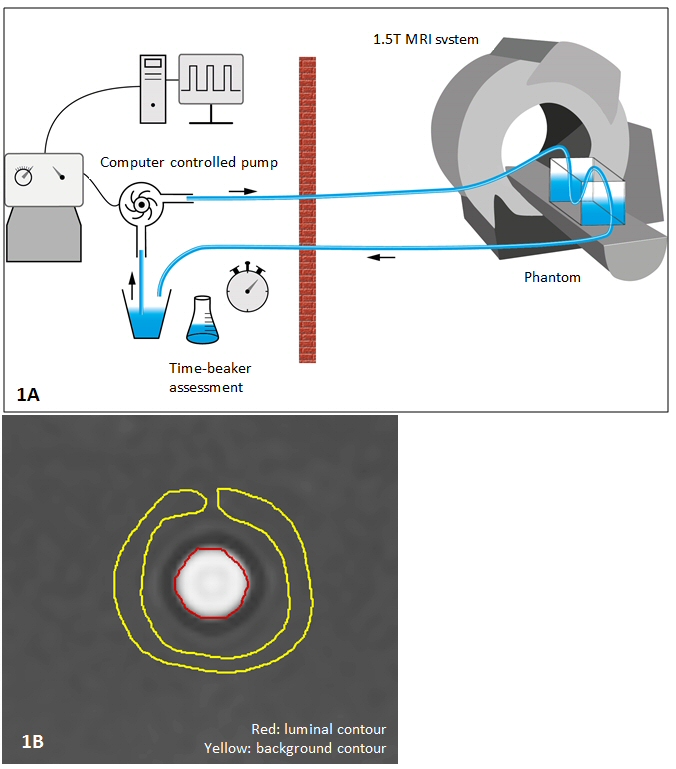
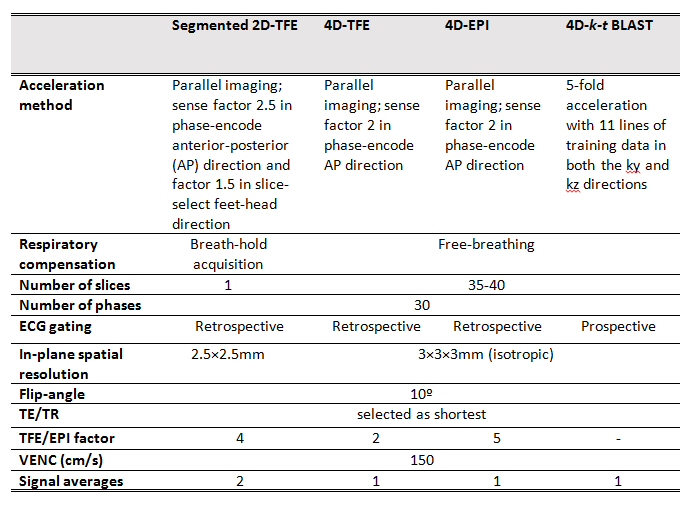
1.5T Ingenia MRI systems (Philips Healthcare) were used. In the phantom setup (Figure 1A), a circulating fluid of 48 ml gadolinium-based contrast agent (Dotarem, Guerbet) dissolved in 6 l water (T1=112 ms) was used. Six static flows (between 2.52 l/min and 6.50 l/min) with simulated ECG triggering at 120 beats/minute and six pulsatile flows (between 2.25 l/min and 5.20 l/min) with a frequency of 61 cycles/minute were applied through a straight tube with 1 cm luminal diameter. For each flow setting, 2D PC MRI and three 4D flow MRI acquisitions were performed perpendicular to the tube to measure flow volume and velocity. In-plane resolutions for 2D PC and 4D flow MRI were equal (1.5×1.5 mm2), through-plane resolution for 4D flow MRI was 1.5 mm but 8 mm for 2D PC MRI. Other scan parameters were equal to the in vivo acquisitions (Table 1). Time-beaker measurements were performed at the outlet of the returning tube for reference (Figure 1A). Twenty-five healthy volunteers (mean age 38±15 years, 17/8 men/women) were included at two institutions (no significant inter-site differences in demographics). Besides three whole-heart free-breathing 4D flow MRI acquisitions, 2D PC MRI was performed at the aortic valve (AV) and mitral valve (MV). Scan parameters are shown in Table 1. Phase offset was corrected by background subtraction sampled near the area of interest. For phantom experiments, a background ROI (indicated in yellow in Figure 1B) enclosing the luminal ROI (in red) was used and in vivo, an ROI positioned in the myocardium was used.2 4D flow MRI phantom measurements were obtained from the three center slices and averaged.In volunteers, acquisition time for each 4D flow sequence was recorded as well as a visual grading of image quality on a four-point scale: from 0 (no artefacts) to 3 (non-evaluable). Net forward flow (NFF) volumes at MV and AV were calculated using retrospective valve tracking.2 Peak velocities were obtained from static MV and AV reformatted planes, identical to static 2D PC MRI.
Results
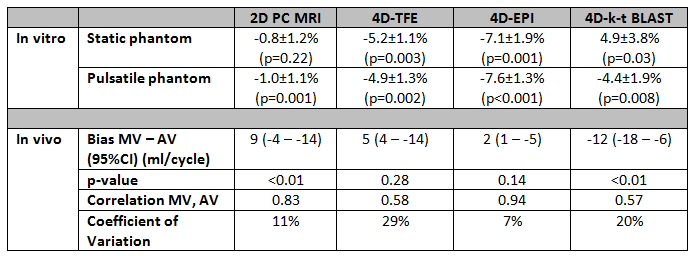
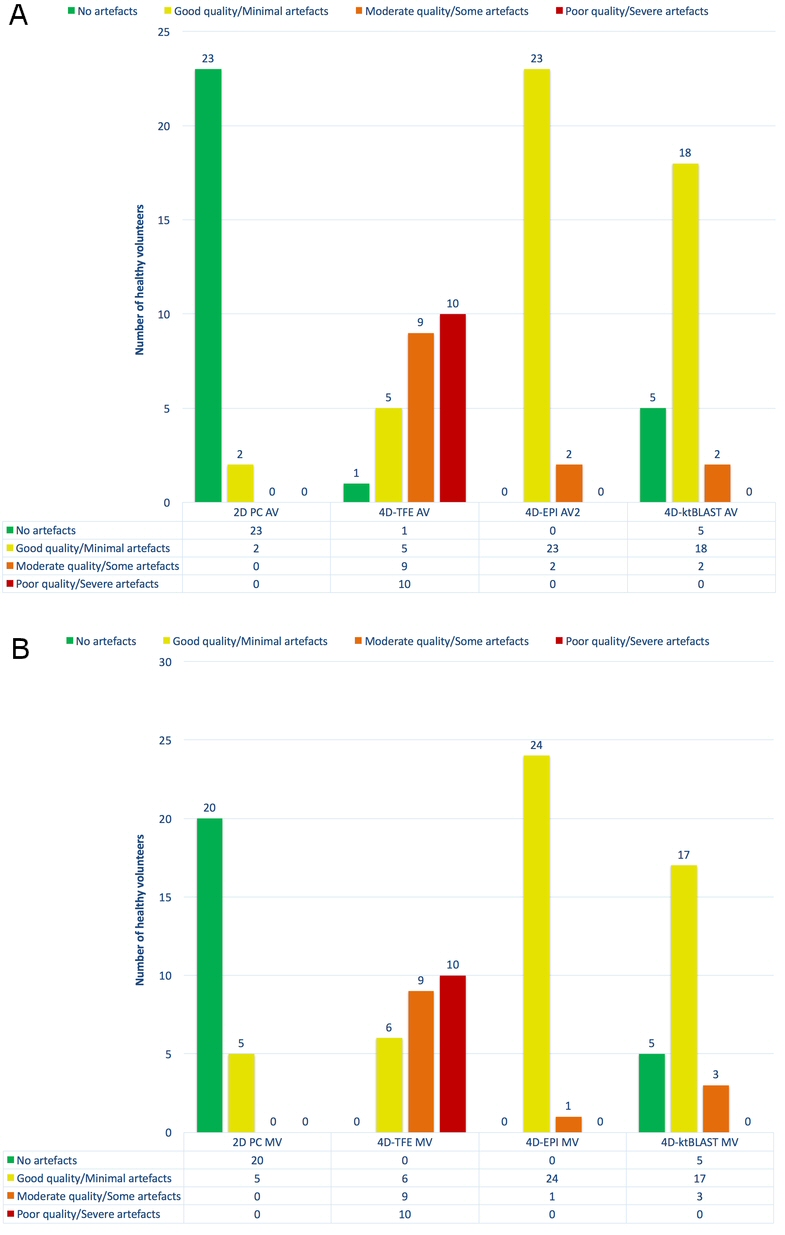
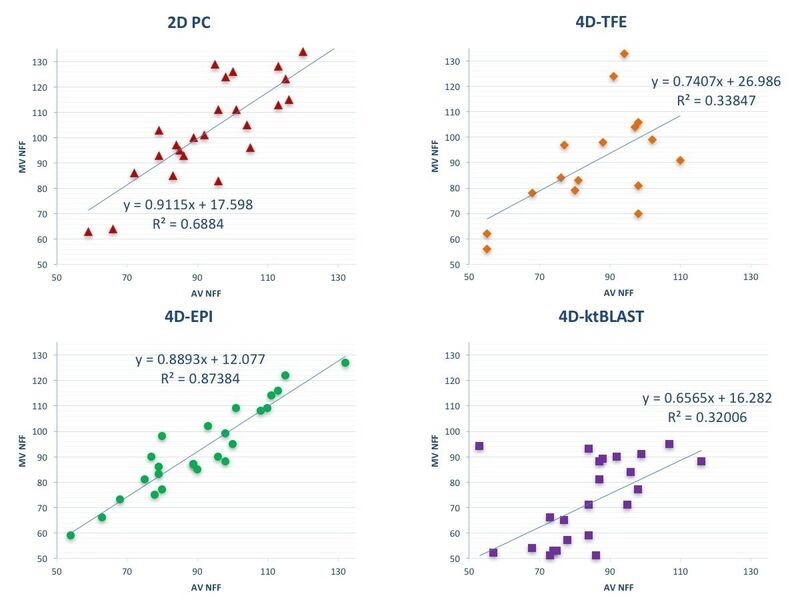
All mean errors in in vitro flow volumes for 2D PC and 4D flow (≤7.6%) are within clinically acceptable margins (Table 2). Acquisition time was shortest for 4D-EPI (7min59±2min30), statistically significantly (p<0.01) shorter than 4D-TFE (9min8±2min46), but nonsignificantly (p=0.29) different from 4D-k-t-BLAST (8min50±2min46). Image quality across MV and AV flows was similar for 4D-EPI and 4D-k-t-BLAST but significantly inferior for 4D-TFE (Figure 2). Additionally, 20 (40%) 4D-TFE MV and AV flows were nonevaluable. Peak MV velocity by 4D-EPI correlated well with 2D PC (r=0.71, p=0.001) whereas 4D-TFE had modest (r=0.59, p=0.01) and 4D-k-t-BLAST poor correlation (r=0.42, p=0.03). Peak AV velocity by 4D-EPI correlated well with 2D PC (r=0.78, p<0.001) versus moderate for 4D-TFE (r=0.56, p=0.04) and 4D-k-t-BLAST (r=0.59, p=0.002). Overall bias was lowest and nonsignificant for 4D-EPI (-2 cm/s, 95% Confidence Interval (CI) -7 to 2 cm/s; p=0.21) with a Coefficient of Variation (COV) of 10%. 4D-TFE and 4D-k-t-BLAST demonstrated significant bias and high COV (4D-TFE: bias=-22 cm/s, 95%CI -31 to 12 cm/s, p<0.001 and COV 21%; 4D-k-t-BLAST: bias=10 cm/s, 95%CI 5 to 15 cm/s, p<0.001 and COV 14%). Internal NFF consistency was best for 4D-EPI (Table 2, Figure 3).Conclusions
Mean errors in flow volume assessment for all 4D flow MRI sequences were below clinically acceptable limits. 4D-EPI had the shortest acquisition time, showed best agreement with 2D PC and best internal NFF consistency. 4D-TFE was most susceptible to artefacts. Because of the use of prospective ECG triggering, 4D-k-t-BLAST cannot estimate MV flow volume for complete diastole.Acknowledgements
No acknowledgement found.References
1. Dyverfeldt P, Bissell M, Barker AJ, et al. 4D flow cardiovascular magnetic resonance consensus statement. J Cardiovasc Magn Reson. 2015; 17(1):72.
2 Westenberg JJM, Roes SD, Ajmone M N, et al. Mitral valve and tricuspid valve blood flow: accurate quantification with 3D velocity-encoded MR imaging with retrospective valve tracking. Radiology. 2008; 249(3):792–800.
3. Zaman A, Motwani M, Oliver JJ, et al. 3.0T, time-resolved, 3D flow-sensitive MR in the thoracic aorta: Impact of k-t BLAST acceleration using 8- versus 32-channel coil arrays. J Magn Reson Imaging. 2015; 42(2):495–504.
Figures