0339
Phase-Contrast MRI with Hybrid One- and Two-sided Flow-Encoding and Velocity SPectrum SepAration (HOTSPA)Da Wang1,2, Jiaxin Shao1, Daniel B. Ennis1,2,3, and Peng Hu1,2
1Department of Radiological Sciences, David Geffen School of Medicine, University of California, Los Angeles, Los Angeles, CA, United States, 2Biomedical Physics Interdepartmental Graduate Program, University of California, Los Angeles, Los Angeles, CA, United States, 3Department of Bioengineering, University of California, Los Angeles, Los Angeles, CA, United States
Synopsis
In this work, we propose a new and more efficient flow encoding and velocity calculation strategy for PC-MRI using a temporal modulation technique to double the temporal resolution or reduce the scan time by 50%. This is the first study to examine a temporal modulation strategy for an under-sampled M1-space (gradient first moment space including FC, FEx, FEy and FEz encoding steps). Our strategy can be combined with conventional acceleration techniques, i.e. parallel imaging and compressed sensing, to further shorten the scan time of PC-MRI.
PURPOSE
To develop and evaluate an M1-space (gradient first moment) under-sampling phase-contrast MRI (PC-MRI) technique with hybrid one- and two-sided flow-encoding (FE) and velocity spectrum separation (HOTSPA) for accelerated blood flow and velocity measurement.METHODS
The temporal sampling period of the conventional reference 4D flow PC-MRI is 4*TR*views-per-segment (VPS). In the HOTSPA technique, the temporal sampling period is shortened by 50% to 2*TR*VPS. This is achieved by applying two-sided FE in the z-direction (i.e. +FEz and -FEz) and by alternating two orthogonal in-plane FE directions in the X-Y plane (i.e. X+Y and X-Y directions) in two consecutive cardiac phases as shown in Fig. 1. Specifically, the two-sided FEz data includes a temporal modulated velocity waveform $$$\phi_{0}(n)\pm\phi_{v,z}(n)=\phi_{0}(n)+e^{i*\pi*n}*\phi_{v,z}(n)$$$, where $$$\phi_{0}(n)$$$ is the the flow-compensated (FC) background phase, $$$\phi_{v,z}(n)$$$ is the signal phase associated with z-directional velocity and n is cardiac phase number. The hybrid one-sided FEx and two-sided FEy are used to generate a $$$\phi_{0}(n)+\phi_{v,x}(n)\pm\phi_{v,y}(n)=\phi_{0}(n)+\phi_{v,x}(n)+e^{i*\pi*n}*\phi_{v,y}(n)$$$ waveform in the two remaining in-plane directions. $$$\phi_{v,x/y}(n)$$$ is the signal phase associated with x/y-directional velocity. If one applies a temporal Fourier transform of HOTSPA 4D flow data with alternating FE directions, the Fourier velocity spectra for the three orthogonal flow directions are shifted away from each other and can be easily separated using a filter. Such temporal modulated FE strategy allows for separations of the Fourier velocity spectrum into components for the FC and the three-directional (3D) velocity waveforms, accelerating PC-MRI by encoding 3D velocities using only 2TRs (±Z and X±Y) instead of 4TRs (four M1-space encoding steps including FC and three-directional FE) as in reference four-point PC-MRI. The theory and workflow are shown in Fig. 2. More details about the technique are recently published in Ref. 1. Six volunteers were scanned at the common carotid arteries (CCAs) using four sequences: 1) 2D reference four-point PC-MRI with three-directional FE plus the FC data, i.e. 2D FC/3FE; 2) our HOTSPA strategy but with 2D spatial encoding, i.e. 2D HOTSPA. The 2D sequences parameters are: TE/TR=3.9/6.3 ms, Flip Angle=20°, VENC=100-110 cm/s, FOV=256*176 cm2, Acquired matrix size=256*176, slice thickness=7 mm, VPS=1 and 2 for FC/3FE, 2 for HOTSPA. 3) 4D flow FC/3FE; 4) 4D HOTSPA. The 4D sequences parameters are: TE/TR=3.6-3.9/6.2-6.4 ms, Flip Angle=20°, VENC=100-110 cm/s, FOV=256*176*20 cm3, Acquired matrix size=256*176*8, VPS=4.RESULTS
Fig. 3a-b show examples of through-plane mean velocity and peak velocity measurement (average and maximum within the vessel lumen, respectively) of the CCA comparing three different measurements: the 1-VPS 2D FC/3FE (grey), the 2-VPS 2D HOTSPA (blue), the 2-VPS 2D FC/3FE PC-MRI (red). The velocity measurements were similar between the 2-VPS 2D HOTSPA and the 1-VPS 2D FC/3FE, although HOTSPA acquisition time was reduced by 50%. However, 2-VPS 2D FC/3FE underestimated the peak velocity by approximately 15% due to its long temporal footprint and temporal sampling period. Across the six subjects, using the 2D 1-VPS FC/3FE as the reference, the bias of 2D HOTSPA was -0.005 mL (-0.1% relative bias error) with 95% Confidential Interval (CI) [-0.3, 0.3] mL for total volumetric flow and 1.21 cm/s (1.14% relative bias error) with 95% CI [-5.1, 7.5] cm/s for peak velocity (Bland-Altman plots of Fig. 3c-d). The peak velocity of all 12 measurements based on the 2-VPS HOTSPA and 1-VPS 2D FC/3FE PC-MRI were significantly higher than the 2-VPS 2D FC/3FE measurements (P<0.05, one-side paired t-test). Fig. 4a-b show examples of through-plane mean velocity and peak velocity measurement in one slice of the 4D flow data comparing two different measurements: the 4-VPS 4D FC/3FE (red), and the 4-VPS 4D HOTSPA (blue). The 4D HOTSPA technique generated up to 40% higher peak velocity compared with standard 4D FC/3FE. As shown in Fig. 4c, the total volumetric flow measurements agree well between 4D HOTSPA and 4D FC/3FE (-0.02 mL bias with [-0.3 0.3] mL 95% CI). The peak velocity from 4-VPS HOTSPA was significantly higher than the 4-VPS standard 4D FC/3FE (P<0.05, one-side paired t-test).DISCUSSION
In this work, we propose a new and more efficient flow encoding and velocity calculation strategy for PC-MRI using a temporal modulation technique to double the temporal resolution or reduce the scan time by 50%. This is the first study to examine a temporal modulation strategy for an under-sampled M1-space. Our strategy can be combined with conventional acceleration techniques, i.e. parallel imaging and compressed sensing, to further shorten the scan time of PC-MRI.CONCLUSION
The proposed HOTSPA technique achieves nearly two-fold acceleration of PC-MRI while maintaining accuracy for total volumetric flow and peak velocity quantification.Acknowledgements
NIH R01HL127153References
1. Wang D., et.al. MRM 2016 Aug 9. doi: 10.1002/mrm.26366. [Epub ahead of print]Figures
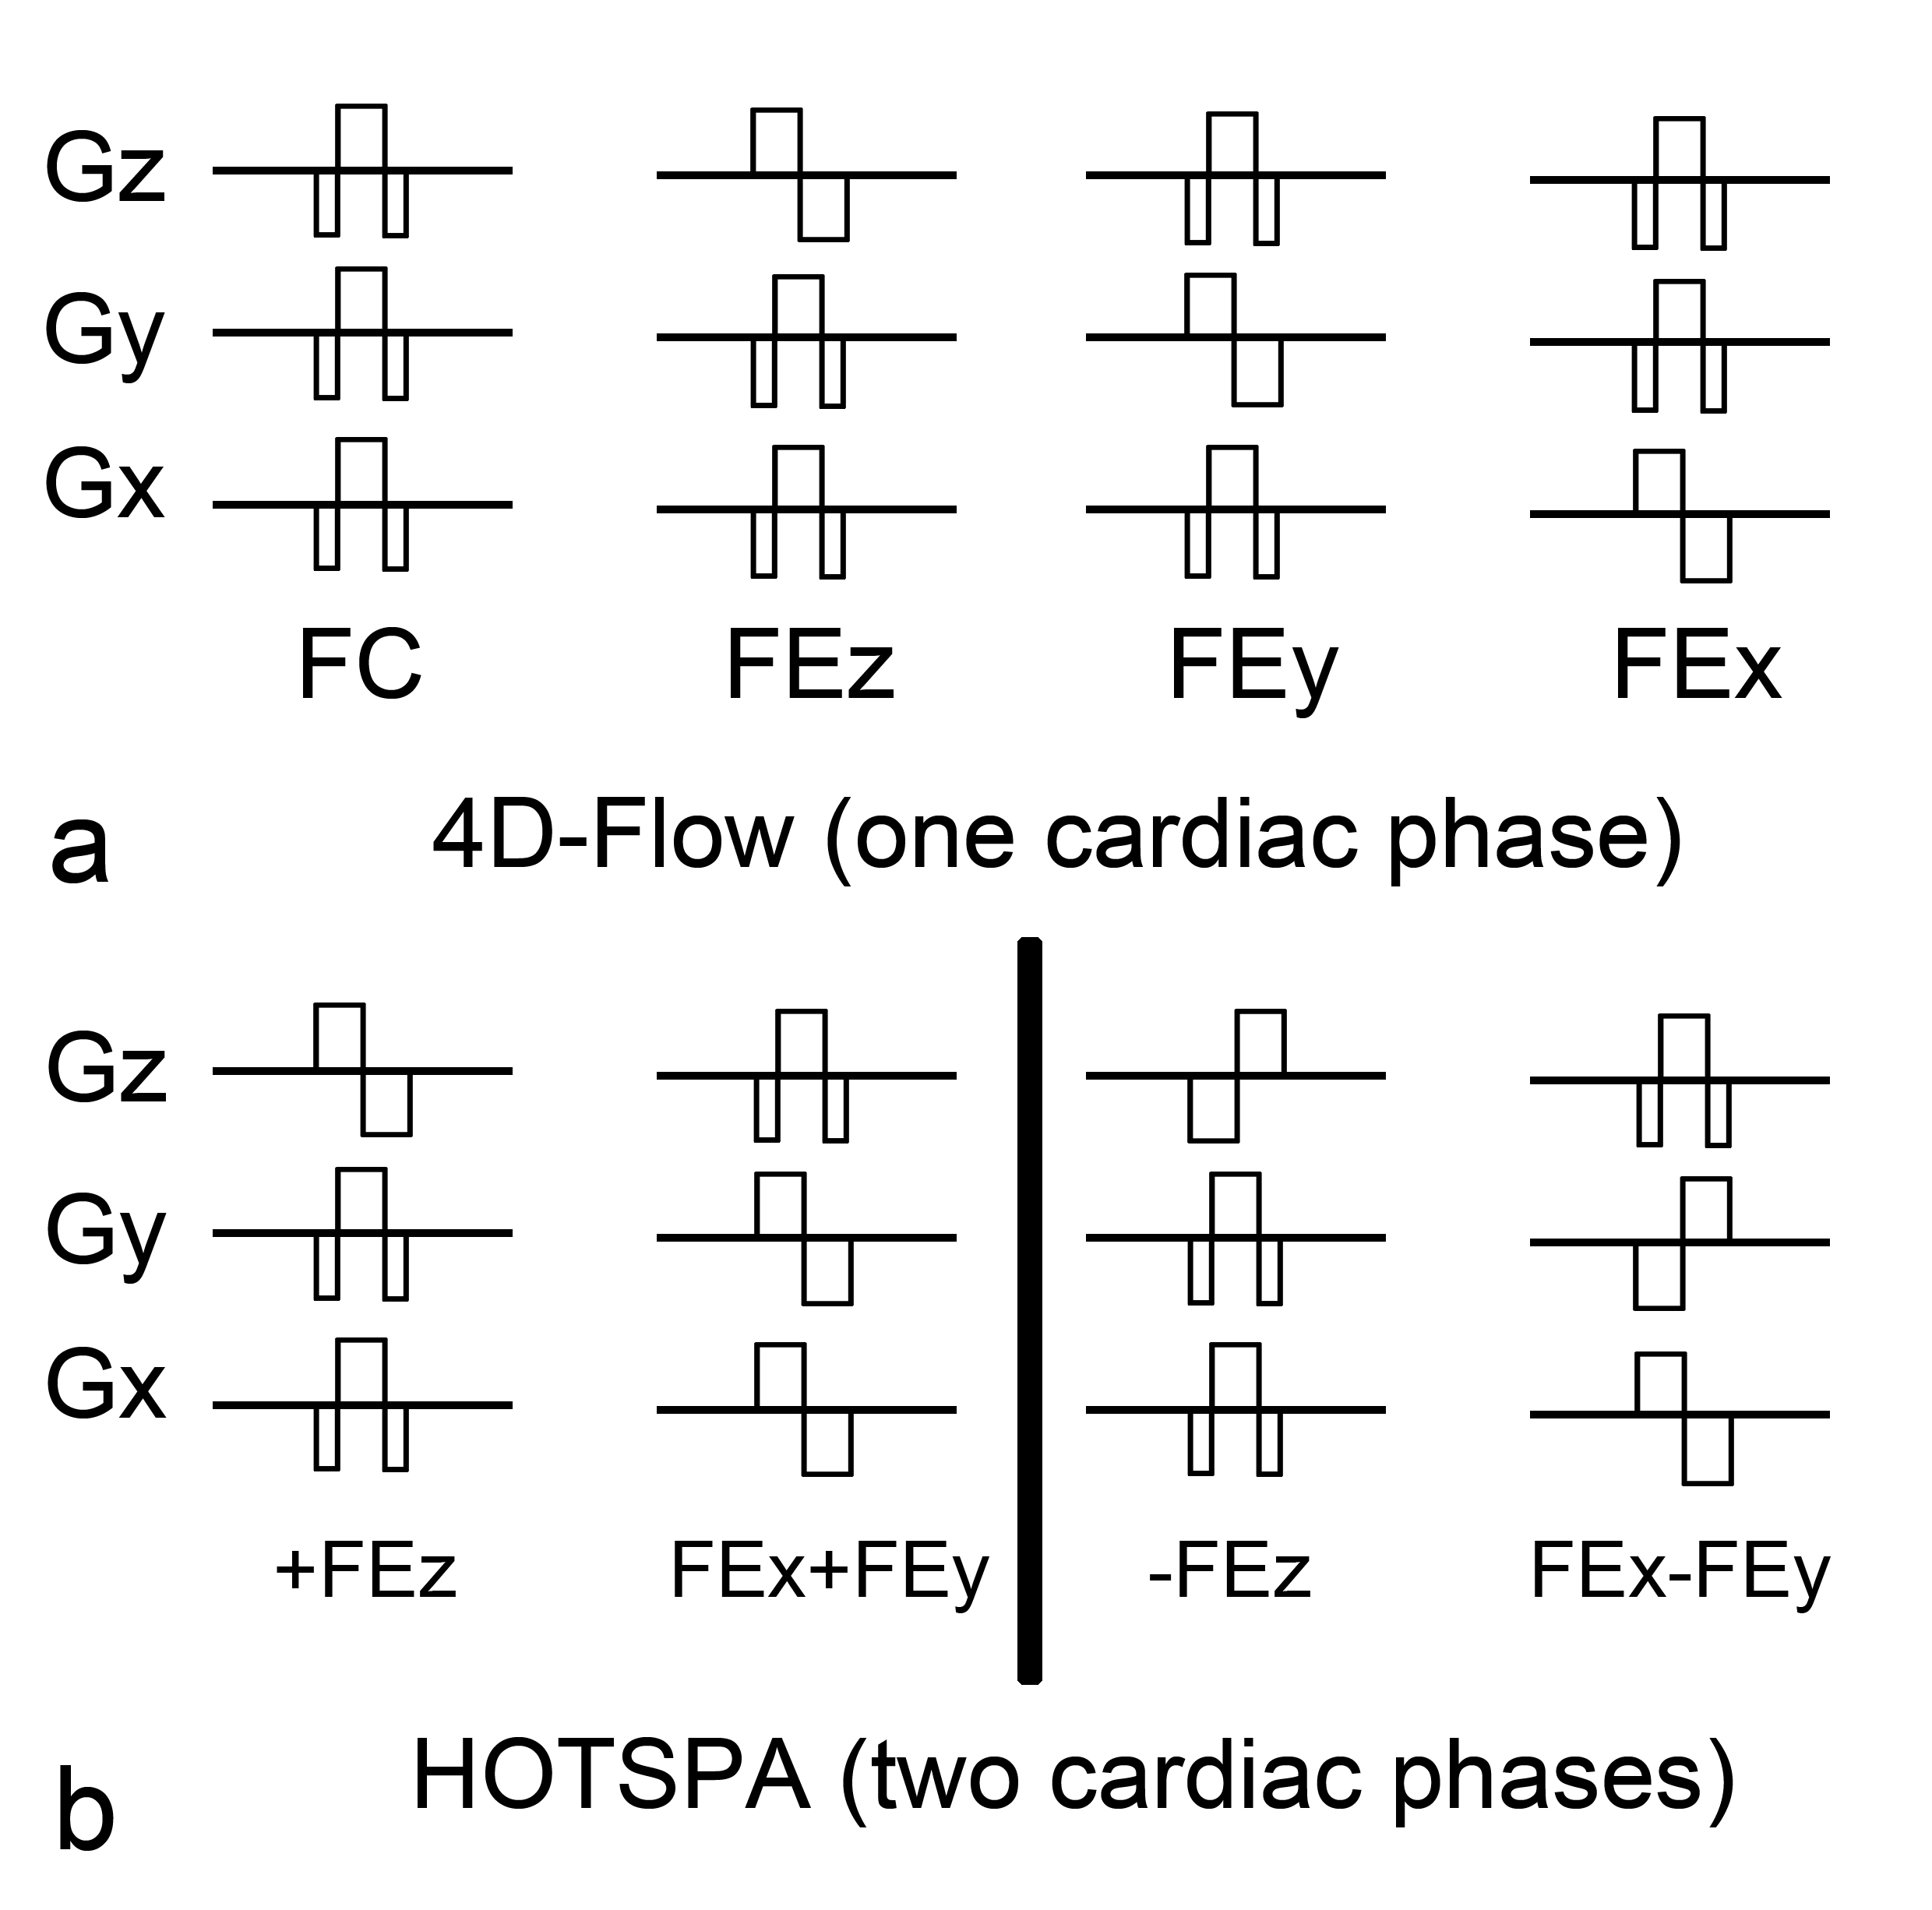
Figure 1 Sequence diagrams of (a) reference 4D-Flow
acquisition and (b) HOTSPA acquisition. For each cardiac phase, 4D-Flow
requires four M1-space samples while HOTSPA only requires two M1-space samples. In the diagrams,
only FC (three gradients) and ±FE gradients (bipolar gradients) are shown.
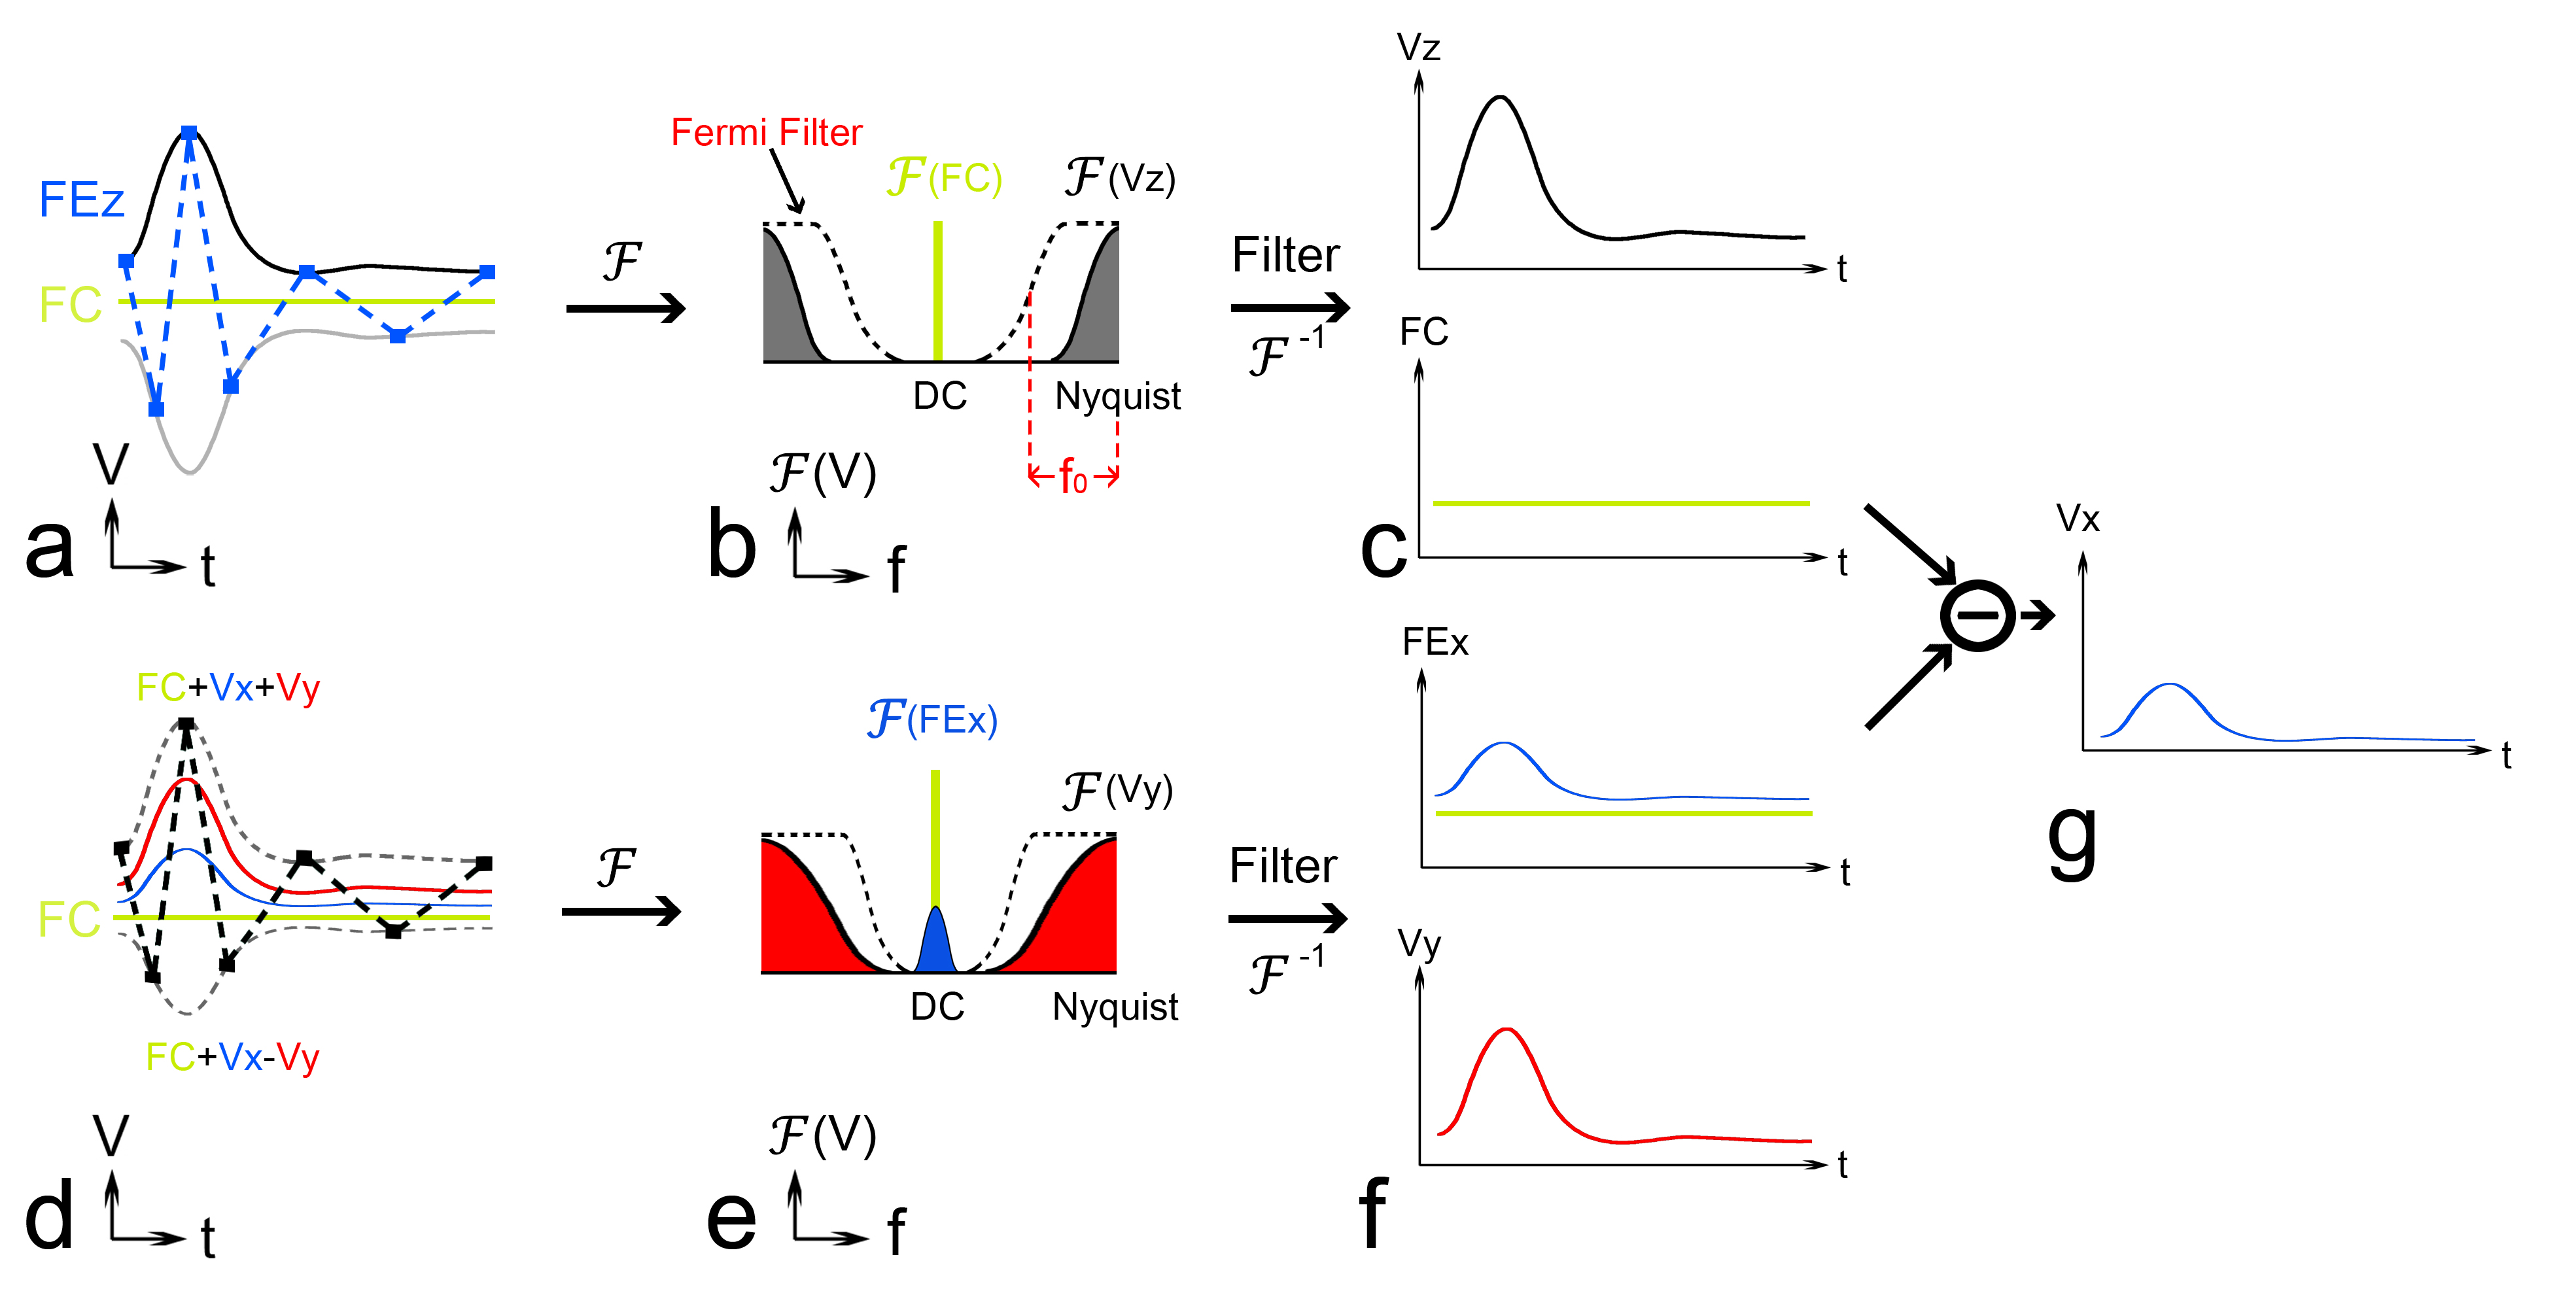
Figure 2 a: The two-sided FEz(blue dash line). b: The Fourier transform (F) of the
two-sided FEz. The Fermi filter(black dash line) separates the two spectra. c: The separated velocity waveforms of Vz
and FC after filtering and F-1 d: The HOTSPA FE acquisition
strategy for Vx and Vy with alternating
polarity for Vy sampling. The composite in-plane waveform is shown in dashed black line. e:
The Fourier transform of d. A Fermi filter
separates the spectra of two velocities. f: The separated velocity
waveforms. g: The additional subtraction
between FC and FEx gives the x-directional velocity waveform.
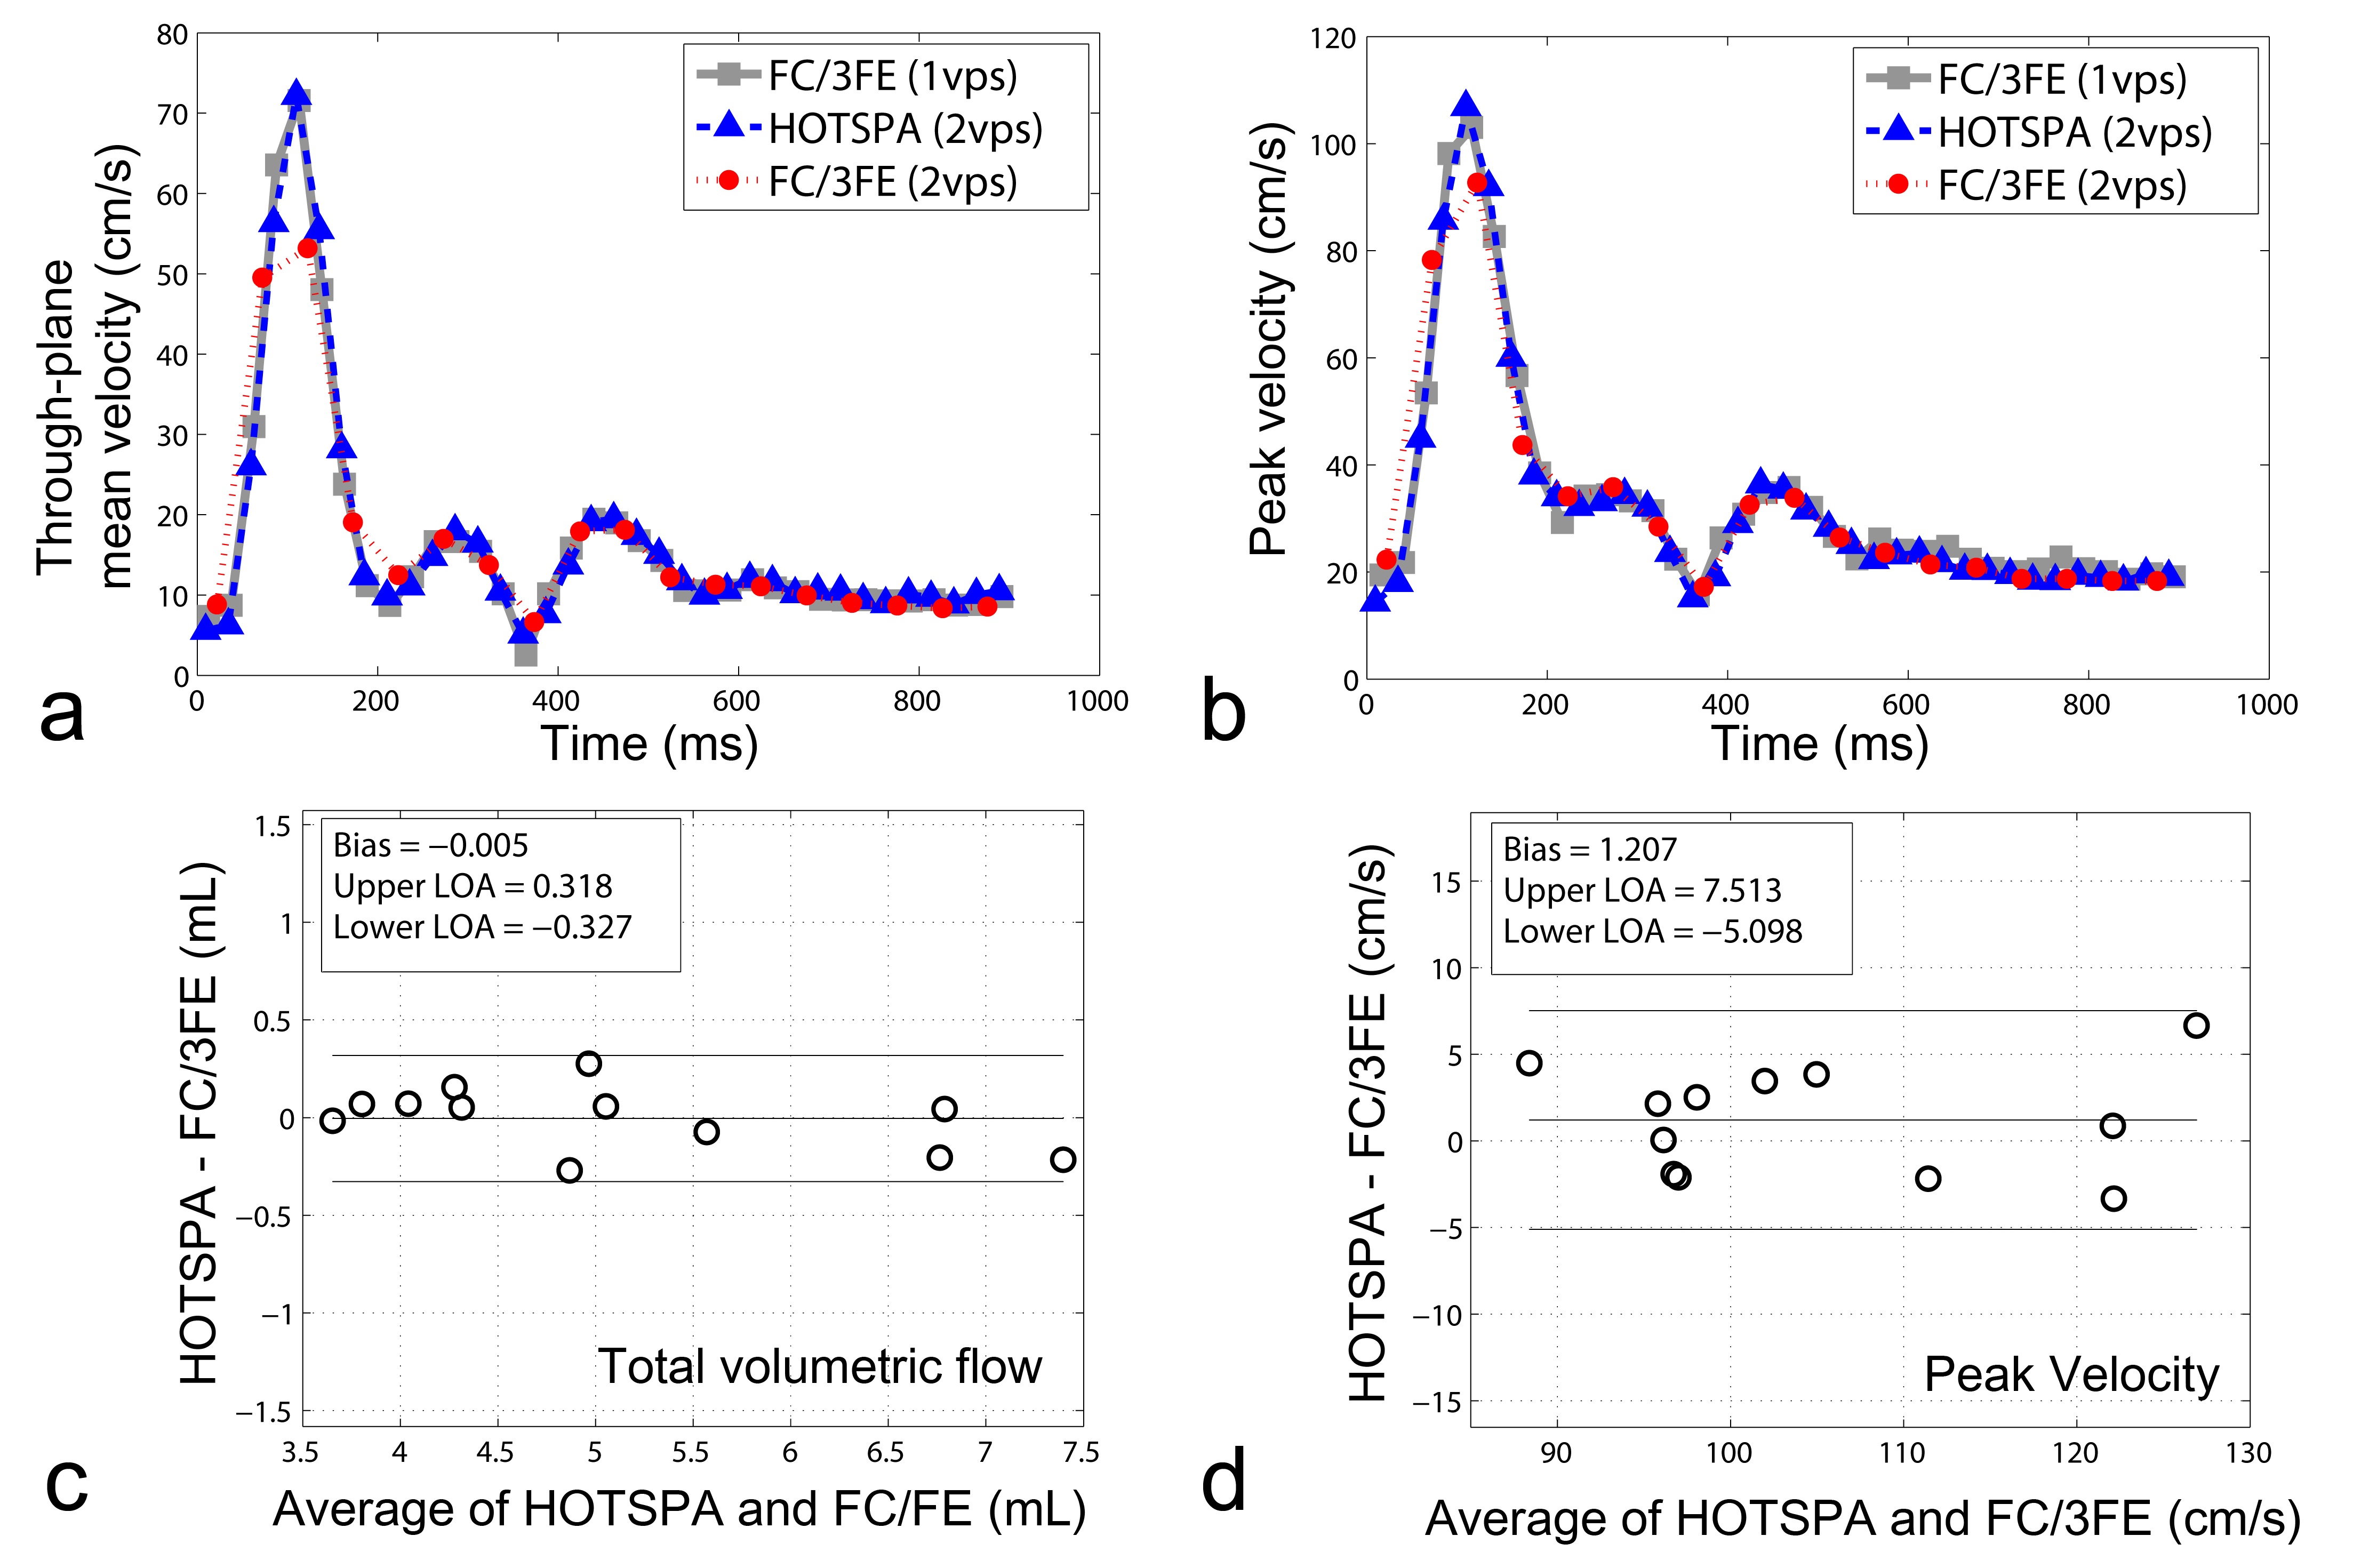
Figure 3 a: The
through-plane mean velocity waveforms of: the reference 1-VPS 2D FC/3FE (gray),
2-VPS
HOTSPA (blue) and 2-VPS 2D FC/3FE (red). b: The peak velocity waveforms of: the reference 1-VPS FC/3FE
(gray), 2-VPS HOTSPA (blue) and 2-VPS FC/3FE (red). c: Bland-Altman plot of total volumetric
flow measurements between 1-VPS FC/3FE and 2-VPS HOTSPA. d: Bland-Altman plot of peak velocity measurements using 1-VPS
FC/3FE PC-MRI and 2-VPS HOTSPA. The 2-VPS HOTSPA provides accurate mean and peak velocity using the
1-VPS conventional FC/3FE as the reference while saving 50% in scan time. The
2-VPS FC/3FE significantly under-estimated the peak velocity.
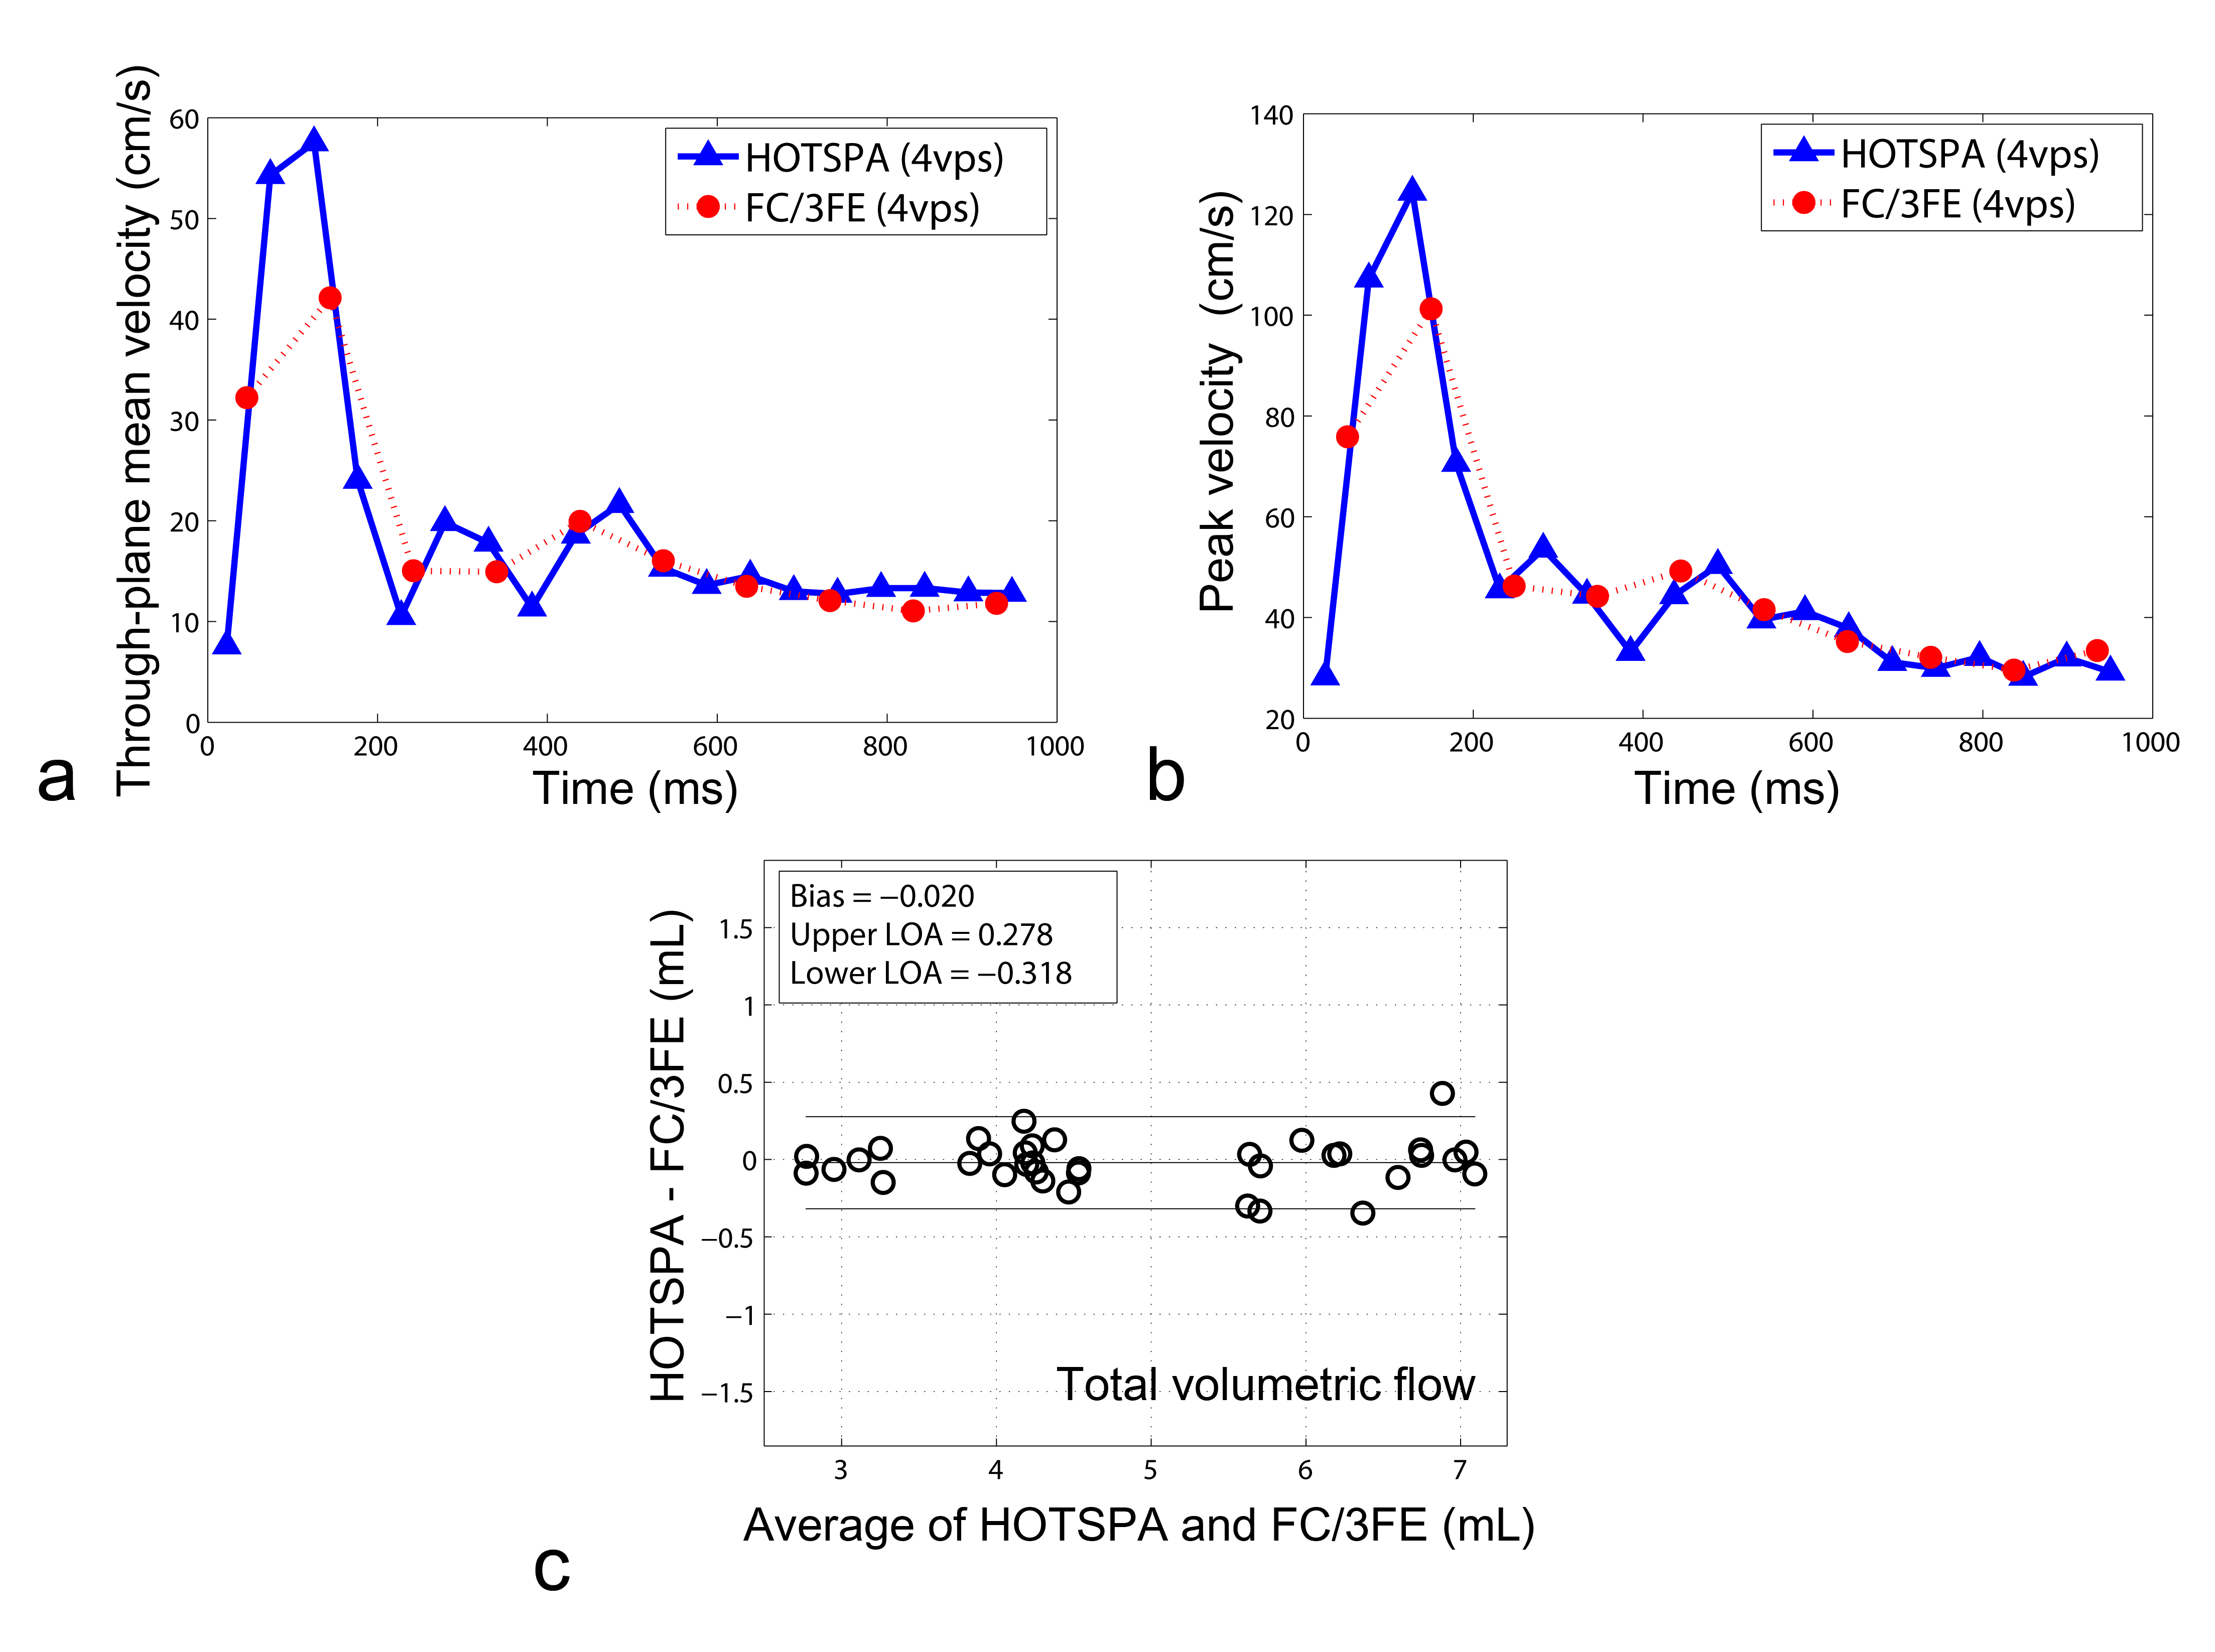
Figure 4 An example of through-plane
mean velocity waveforms (a) and peak
velocity waveforms (b) of one
selected slice from the 4-VPS conventional FC/3FE 4D-flow (red) with 98.08 ms
temporal sampling period, and 4-VPS 4D HOTSPA (blue) with 51.36 ms temporal
sampling period. Both sequences had the same total scan time. The peak velocity
calculated from the 4D HOTSPA was >20% higher than that calculated from the
FC/3FE. c: The
Bland-Altman plot of total volumetric flow measurements (slice 2,4,6 of both
CCAs of all six volunteers) between conventional FC/3FE 4D-flow and 4D HOTSPA.