0330
13C NMR metabolic flux analysis of mantle cell lymphoma cells to Bruton tyrosine kinase inhibitors1Department of Radiology, University of Pennsylvania, Philadelphia, PA, United States, 2Department of Pathology and Laboratory Medicine, University of Pennsylvania, Philadelphia, PA, United States
Synopsis
We analyzed various metabolic fluxes of mantle cell lymphoma cells upon Bruton tyrosine kinase signaling inhibitors using 13C NMR and a bonded cumomer modeling method and identified 1H NMR biomarkers translatable to clinic.
Introduction
Cancer metabolism is receiving great interest these days because of its role in the diagnosis of human tumors by FDG-PET and cancer cell’s metabolic interaction and response to targeted kinase inhibitor drugs and other newly developed drugs. Understanding detailed metabolism of cancer cells and its changes to particular drugs is important to find metabolic targets for therapeutic response detection and find metabolic pathways that are resistant to the drugs. NMR is a valuable tool for such studiesMethods
NMR: To determine metabolic fluxes, the following information was acquired from 13C NMR spectroscopy; 13C enrichment ratios of lactate, alanine and glutamate C4, C3, C2, and multiplet ratios of glutamate C4 and C3. Proton-observed carbon-edited (POCE) NMR spectroscopy sequence was used for the former and a pulse-acquire 13C NMR spectroscopy with proton decoupling for the latter.1 1H NMR was used to determine intracellular metabolite concentrations. Varian NMR spectrometer at 9.4 T was employed. Cells: Two mantle cell lymphoma (MCL) cell lines, RL and Jeko, were used; RL is more responsive and Jeko is less responsive to ibrutinib (a Bruton tyrosine kinase inhibitor). The cells were treated with either vehicle or 500 nM ibrutinib . After 48 h treatment, cells were resuspended in culture medium with 10 mM 1,6-13C-glucose. After 8 h incubation, the water soluble metabolites were extracted for NMR analysis. Extracellular glucose and lactate concentrations were measured using the YSI 2300 Stat Plus glucose-lactate analyzer. Metabolic modeling: Data were analyzed with a compartmentalized metabolic network model that included glucose, lactate and glutamine transport, glycolysis, TCA cycle, PPP, α-ketoglutarate-glutamate and oxaloacetate-aspartate exchange, pyruvate carboxylase activity, anaplerosis at the succinyl-CoA level, pyruvate recycling through malic enzyme, lactate dehydrogenase activity, glutaminolysis, reductive carboxylation and de novo fatty acids synthesis. Bonded cumomer isotope balance equations were derived for every network metabolite. The resultant set of differential equations was solved to determine fluxes by isotopomer/cumomer analysis.1 Statistical analysis: Three samples for each experiment were used. Two-tailed unequal variance Student’s t-test was used. P values less than 0.05 were considered to be significant.
Results
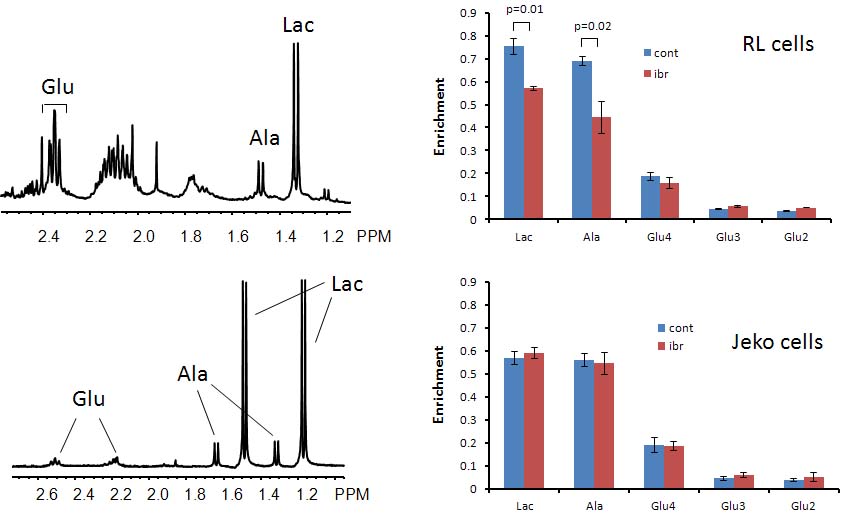
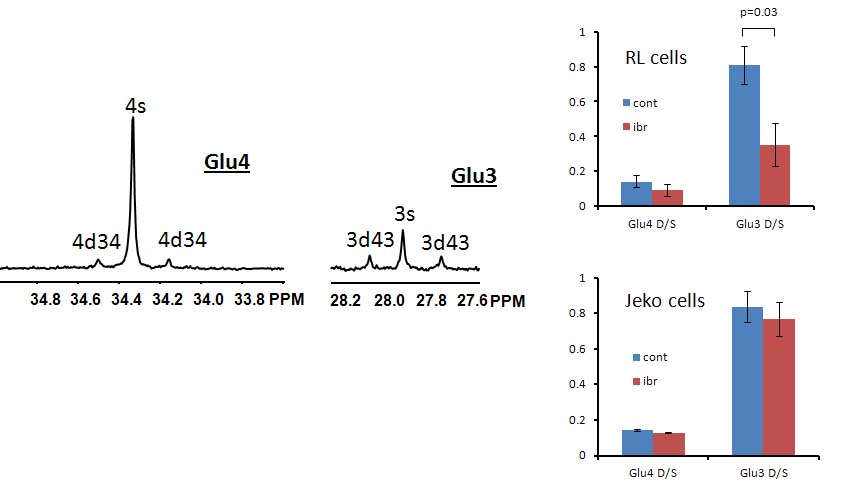
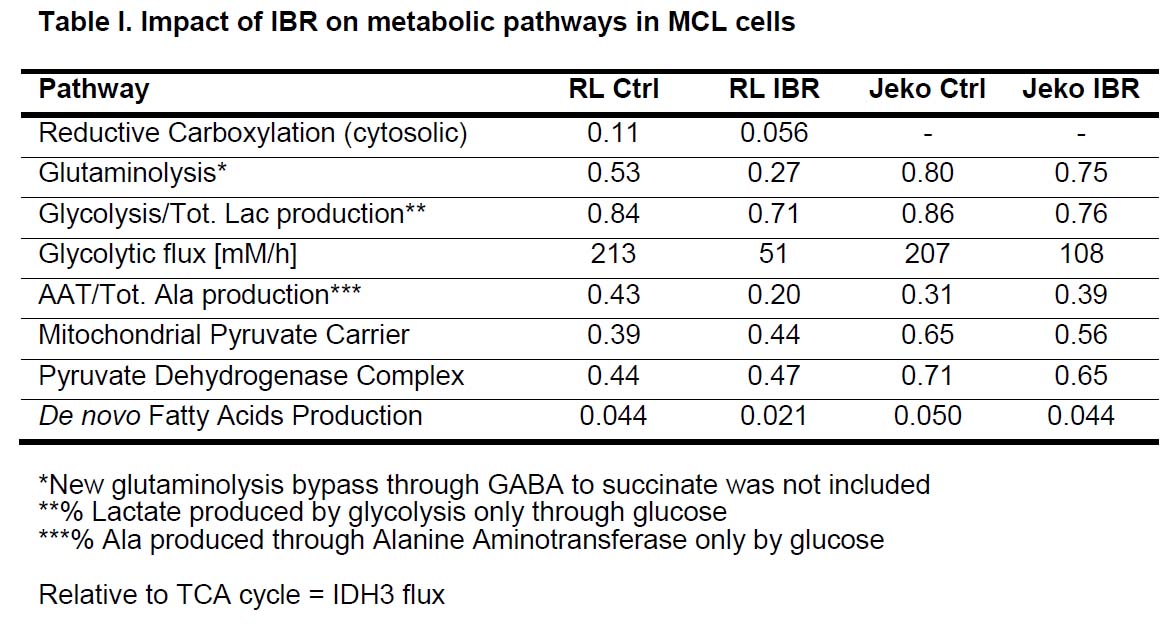
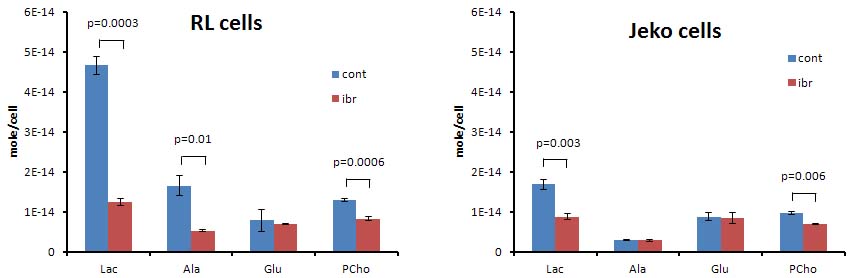
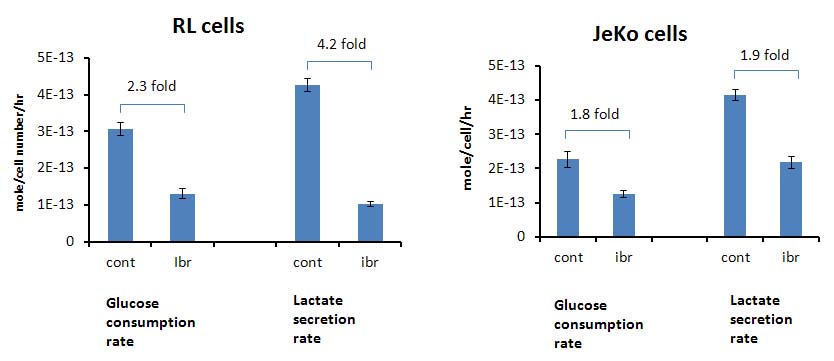
Figure 1A shows the POCE spectra of 13C-labeled RL cells. The upper spectrum indicates metabolites with 12C-carbon and the lower spectrum indicates metabolites with 13C-carbon. 13C-enrichment ratios of metabolites were derived for RL and Jeko cells and are presented in Fig 1B. Figure 2A shows the C4- and C3-glutamate region of a 13C spectrum of RL cells. Figure 2B shows doublet to singlet ratios of Glu4 and Glu3 for RL and Jeko cells. Table 1 shows the calculated various metabolic fluxes relative to the flux through TCA cycle. There was about two-fold decrease in reductive carboxylation, glutaminolysis and de novo fatty acids production after treatment in RL cells while Jeko cells did not show substantial changes. Change in glycolysis was four-fold in RL cells while two-fold in Jeko cells. Figure 3 shows intracellular 1H NMR metabolite concentrations of RL and Jeko cells. The changes to treatment were observed in lactate, alanine and phosphocholine (PCho). Lactate showed the biggest changes. Figure 4 shows glucose consumption and lactate secretion rates. Glucose consumption and lactate production decreased in both cell lines after treatment with differing rates. Notably, while glucose consumption change to ibrutinib had ~20% difference between RL and Jeko cells, lactate secretion change had ~50% difference between RL and Jeko cells.Discussion
13C NMR metabolic flux analysis provided detailed fluxes through various metabolic pathways. 1H NMR results provided relevant biomarkers translatable to in vivo study and clinic.2,3 In terms of metabolism, Jeko cells were responsive to ibrutinib in glycolysis but not other major metabolic pathways, which explains Jeko cell's less responsiveness to ibrutinib for proliferation. Decrease of alanine in RL cells was in line with decrease in glutaminolysis as expected because glutaminlolysis provides major nitrogen for alanine synthesis. It is being reported that FDG-PET response to targeted signaling inhibitors is not predictive of tumor volumes response.4,5 Cancer cells receive nutrients for proliferation not only from glycolysis but also from glutaminolysis and others. As lactate reflects metabolic output of glycolysis, glutaminolysis and pentose phosphate pathway, lactate may better reflect cancer cell’s overall response relevant to proliferation than FDG-PET which relies on glucose uptake. Our comparison of glucose consumption and lactate concentration suggests this is the case for MCL cells and the same could work in mantle cell lymphoma in patients treated with ibrutinib.Conclusion
13C NMR metabolic flux analysis and 1H NMR helped to elucidate MCL cell's metabolism and response to Bruton tyrosine kinase inhibitors and provided suitable biomarkers for response detection.Acknowledgements
NIH grants R01-CA172820, R01-CA129544.References
1. Shestov AA, Mancuso A, Lee SC, et al. Bonded Cumomer Analysis of Human Melanoma Metabolism Monitored by 13C NMR Spectroscopy of Perfused Tumor Cells. J Biol Chem. 2016; 291(10):5157-71.
2. Lee SC, Marzec M, Liu X, et al. Decreased lactate concentration and glycolytic enzyme expression reflect inhibition of mTOR signal transduction pathway in B-cell lymphoma. NMR Biomed. 2013; 26(1):106-14.
3. Mellon EA, Lee SC, Pickup S, et al. Detection of lactate with a hadamard slice selected, selective multiple quantum coherence, chemical shift imaging sequence (HDMD-SelMQC-CSI) on a clinical MRI scanner: Application to tumors and muscle ischemia. Magn Reson Med. 2009;62(6):1404-13.
4. Ma WW, Jacene H, Song D, et al. [18F]fluorodeoxyglucose positron emission tomography correlates with Akt pathway activity but is not predictive of clinical outcome during mTOR inhibitor therapy. J Clin Oncol. 2009;27(16):2697-704.
5. McArthur GA, Puzanov I, Amaravadi R, et al. Marked, homogeneous, and early [18F]fluorodeoxyglucose-positron emission tomography responses to vemurafenib in BRAF-mutant advanced melanoma. J Clin Oncol. 2012;30(14):1628-34.
Figures