0329
IDH1 mutation down-regulates choline and ethanolamine metabolism in gliomasPavithra Viswanath1, Jose Luis Izquierdo-Garcia1, Joanna J Phillips2, Russell O Pieper2, and Sabrina M Ronen1
1Radiology and Biomedical Imaging, University of California San Francisco, San Francisco, CA, United States, 2Neurological Surgery, University of California San Francisco, San Francisco, CA, United States
Synopsis
Aberrant choline and ethanolamine metabolism with elevated phosphocholine (PC) and phosphoethanolamine (PE) levels has emerged as a hallmark of cancer. Interestingly, PC and PE levels are reduced in gliomas with the isocitrate dehydrogenase 1 (IDH1) mutation relative to wild-type tumors. Here, we investigated the mechanism behind the reduction in PC and PE levels in genetically-engineered cells and tumor xenografts. Our results indicate that mutant IDH1 gliomas down-regulate the activities of choline kinase and ethanolamine kinase, the enzymes involved in PC and PE synthesis. Reduced PC and PE levels constitute unique metabolic biomarkers and potential therapeutic opportunities in mutant IDH1 gliomas.
Introduction
Elevated levels of phosphocholine (PC) and phosphoethanolamine (PE) have emerged as MR-detectable biomarkers of malignant transformation1,2,3. Interestingly, however, PC and PE levels are reduced in low-grade gliomas carrying the isocitrate dehydrogenase 1 (IDH1) mutation4,5,6. The goal of the current study was, therefore, to understand the mechanism underlying reduced PC and PE levels in mutant IDH1 gliomas. Using a combination of 13C- and 31P-MRS and biological assays, we measured the activities of choline kinase (CK) and ethanolamine kinase (EK) as well as CTP:PC cytidylyltransferase (CCT) and CTP:PE cytidylyltransferase (ECT), the enzymes directly involved in PC and PE production and consumption respectively7. Our results indicate that the activities of CK, EK, CCT and ECT are down-regulated in mutant IDH1 cells. However, the down-regulation of CK/EK is greater than that of CCT/ECT resulting in an overall reduction in steady-state levels of PC and PE. Our study thus delineates the mechanism underlying the unusual down-regulation of PC and PE levels in mutant IDH1 gliomas.Methods
U87 and NHA cells expressing IDH1 wild-type (U87IDHwt/NHAIDHwt) or mutant (U87IDHmut/NHAIDHmut) enzyme and orthotopic tumor xenografts were generated as described6,8. 13C-MRS studies to quantify flux from [1,2-13C]-choline and [1,2-13C]-ethanolamine to PC and PE were performed on a 600-MHz Bruker spectrometer using a 10 mm broadband probe and an MR-compatible bioreactor system9. 31P-MR-based assays to measure CK, EK, CCT and ECT activity were performed on a 500-MHz Bruker spectrometer with a triple resonance cryoprobe10,11. Protein expression was determined by immunoblotting. Experiments were performed in triplicate (n=3) and statistical significance assessed using an unpaired t-test (p<0.05 was considered significant).Results and Discussion
Using 31P-MRS (Fig.1A), we first confirmed that PC (Fig.1B&1C) and PE (Fig.1D&1E) levels were significantly reduced in mutant IDH1 cells relative to wild-type. We then used 13C-MRS to monitor 13C-PC and -PE synthesis in live cells perfused with [1,2-13C]-choline and [1,2-13C]-ethanolamine over 48h (Fig.2A). The kinetic fit for PC (Fig.2B&2C) and PE (Fig.2D&2E) build-up indicated that the pseudo-first-order rate constant for CK was significantly reduced by 39.6% from 0.1±0.008h-1 in U87IDHwt to 0.06±0.007h-1 in U87IDHmut and by 40.4% from 0.08±0.007h-1 in NHAIDHwt to 0.05±0.004h-1 in NHAIDHmut. Similarly, the pseudo-first-order rate constant for EK was significantly reduced by 39.8% from 0.08±0.005h-1 in U87IDHwt to 0.05±0.004h-1 in U87IDHmut and by 50.2% from 0.06±0.005h-1 in NHAIDHwt to 0.03±0.004h-1 in NHAIDHmut. Next, we found a significant reduction in CK expression in mutant IDH1 cells (43.2±5.6% in the U87 model and 49.6±3.4% in the NHA model; Fig.3A&3B). Measurement of CK and EK activity using 31P-MR-based assays (Fig.3C&3D) revealed a significant reduction in CK activity in mutant IDH1 cells (59.8% from 9.24±0.79fmol/cell/h in U87IDHwt to 3.71±0.62fmol/cell/h in U87IDHmut and by 61.4% from 5.63±0.54fmol/cell/h in NHAIDHwt to 2.17±0.51fmol/cell/h in NHAIDHmut). EK activity was similarly reduced in mutant IDH1 cells (59.8% from 5.29±0.42fmol/cell/h in U87IDHwt to 2.13±0.41fmol/cell/h in U87IDHmut and 69.3% from 4.03±0.29fmol/cell/h in NHAIDHwt to 1.23±0.24fmol/cell/h in NHAIDHmut). We then measured the expression and activity of CCT and ECT, the enzymes that convert PC and PE to CDP-choline and CDP-ethanolamine respectively7. We found a significant reduction in CCT expression (30.1±5.4% in the U87 model and 28.9±6.3% in the NHA model; Fig.4A&4B) and ECT expression (31.3±7.9% in the U87 model and 25.3±4.1% in the NHA model; Fig.4C&4D) in mutant IDH1 cells. CCT activity (Fig.4E) was significantly reduced in mutant IDH1 cells (39.3% from 4.24±0.39fmol/cell/h in U87IDHwt to 2.57±0.21fmol/cell/h in U87IDHmut and by 40% from 2.74±0.31fmol/cell/h in NHAIDHwt to 1.65±0.29fmol/cell/h in NHAIDHmut). ECT activity (Fig.4F) was likewise reduced in mutant IDH1 cells (40% from 2.62±0.22fmol/cell/h in U87IDHwt to 1.57±0.23fmol/cell/h in U87IDHmut and by 37.2% from 1.52±0.16fmol/cell/h in NHAIDHwt to 0.96±0.14fmol/cell/h in NHAIDHmut). Taken together, these results indicated that the reduction in CK/EK activity was higher (~60%) than the reduction in CCT/ECT activity (~40%) leading to an overall reduction in PC and PE levels in mutant IDH1 cells. Finally, we confirmed our findings in U87IDHwt and U87IDHmut orthotopic tumor xenografts. Ex vivo 31P-MR analysis of tumor extracts indicated that PC and PE levels were reduced in U87IDHmut tumors relative to U87IDHwt (Fig.5A&5B). CK (Fig.5C), EK (Fig.5D), CCT (Fig.5E) and ECT (Fig.5F) activities were concomitantly reduced. These results confirmed our findings in genetically-engineered cells in vivo.Conclusions
Collectively, our results mechanistically linked the reduction in PC and PE levels in mutant IDH1 gliomas to reduced CK and EK activity. Importantly, although CCT and ECT activity were reduced as well, the reduction in CK and EK activity was greater leading, on balance, to reduced PC and PE levels. Reduced PC and PE levels, therefore, constitute unique metabolic biomarkers and potential therapeutic opportunities in mutant IDH1 gliomas.Acknowledgements
Grant Acknowledgements: NIH R01CA172845, NIH R01CA197254, NIH R01CA154915, NIH P41EB013598, UCSF Brain Tumor Loglio Collective and NICO.References
1) Glunde et al., Nature Reviews Cancer, 11:835-48, 2011. 2) Zhu et al., Biochemistry & Cell Biology, 90(2): 188-199, 2012. 3) Shah et al. ISMRM Toronto, 0523, 2015. 4) Yang et al., Clinical Cancer Reseach, 18:5562-5571, 2012. 5) Esmaeili et al., Cancer Research, 74:4898-4907, 2014. 6) Izquierdo-Garcia et al., PLOS ONE, 10:e0118781, 2015. 7) Pellech & Vance, Biochimica et Biophysica Acta, 779, 217-251, 1984. 8) Chaumeil et al. Nature Communications, 4: 2429-2441, 2013. 9) Ronen et al., Biochimica et Biophysica Acta, 1095:5-16, 1991. 10) Gabellieri et al., NMR in Biomedicine, 22: 456-461, 2009. 11) Ward et al., PLOS ONE, 8:e62610, 2013.Figures
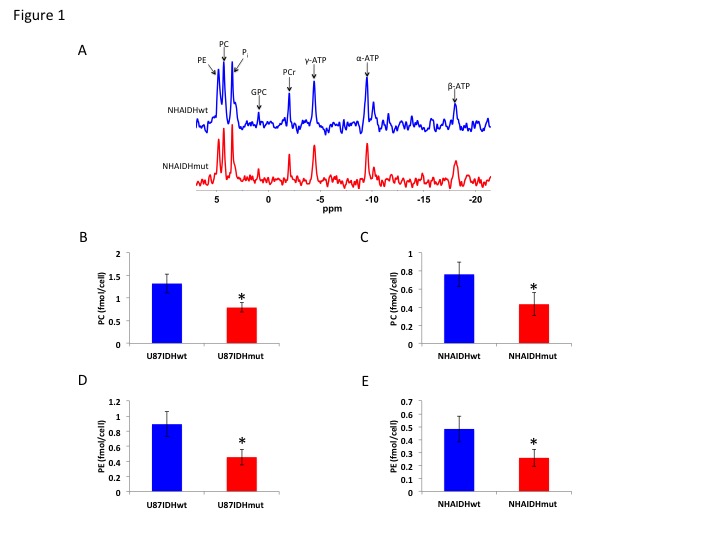
Figure 1. (A) Representative
31P-MR spectra showing a comparison of PC and PE levels between
wild-type and mutant IDH1 cells in the NHA model. Pi: inorganic phosphate; GPC:
glycerophosphocholine; PCr: phosphocreatine; γ-NTP: γ-phosphate of nucleotide
triphosphate; α-NTP: α-phosphate of nucleotide
triphosphate; β-NTP: β-phosphate of nucleotide triphosphate. PC levels in the U87 (B) and (C) NHA models. PE
levels in the U87 (D) and NHA (E) models.
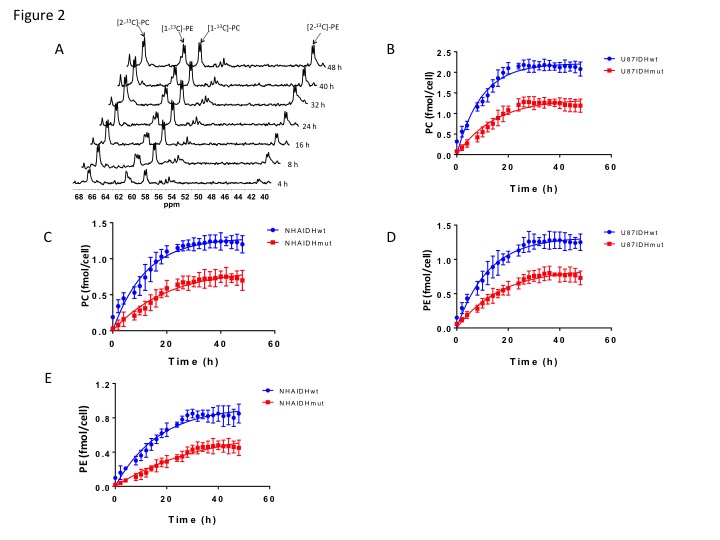
Figure 2. (A)
Representative 13C-MR spectral array showing build up of [1-13C]-PC
and [2-13C]-PC and [1-13C]-PE and [2-13C]-PE
over 48 h in NHAIDHmut cells perfused with medium containing 56 μM each of
[1,2-13C]-choline and [1,2-13C]-ethanolamine.
Quantification of PC synthesis in the U87 (B) and NHA (C) models.
Quantification of PE synthesis in the U87 (D) and NHA (E) models.
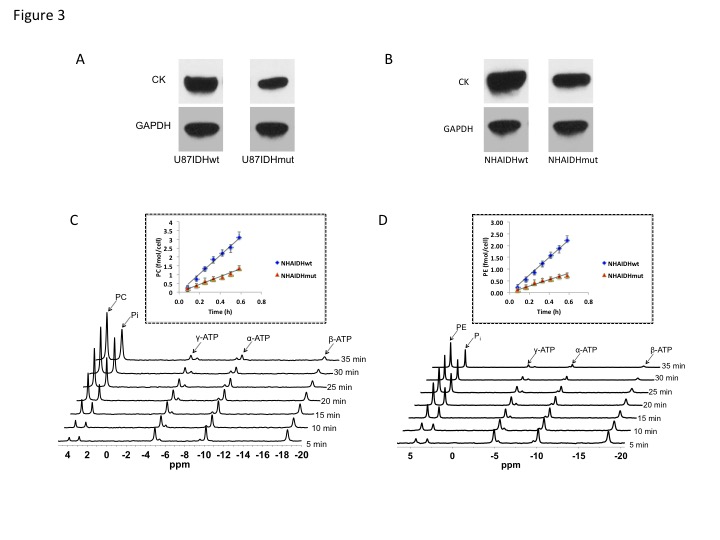
Figure 3. CK
expression in the U87 (A) and NHA (B) models. GAPDH was used as the loading
control. Representative 31P-MR spectral array of CK (C) and EK (D)
activity. The inset shows the linear regression analysis of the time course of
PC (C) and PE (D) production.
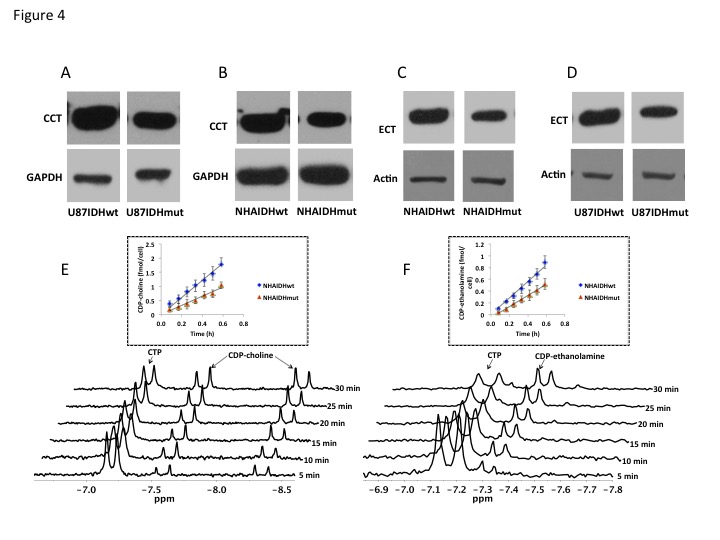
Figure 4. CCT
expression in the U87 (A) and NHA (B) models. ECT expression in the U87 (C) and
NHA (D) models. Representative 31P-MR spectral array of CCT (E) and
ECT (F) activity. The inset shows the linear regression analysis of the time
course of CDP-choline (E) and CDP-ethanolamine (F) production.
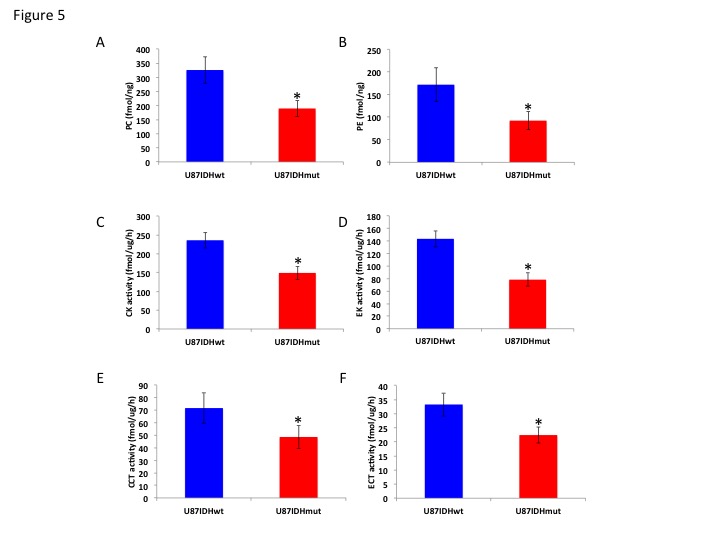
Figure 5. PC (A)
and PE (B) levels in U87IDHwt and U87IDHmut orthotopic tumor xenografts. CK
(C), EK (D), CCT (E) and ECT (F) activity in U87IDHwt and U87IDHmut orthotopic
tumor xenografts.