0327
NMR-based metabolomics and metabolic pathway networks from patient-matched colorectal cancers, adjacent non-cancerous tissues and fecal extracts1Radiology department, Second Affiliated Hospital, Shantou University Medical College, Shantou City, People's Republic of China, 2Department of Radiation Oncology, Cancer Hospital, Shantou University Medical College, Guangdong Province, China, People's Republic of China
Synopsis
This study aimed to profile paralleled metabolites of CRC tissues and adjacent non-cancerous tissues alongside pre- and post-operative stools from the same patients, to investigate how fecal metabolomic phenotypes correlate with the tumor tissue especially in a molecular pathology context. Our patient-matched cohort revealed a few overlapping discriminatory metabolites between the CRC and stool metabolomes, indicating the networks for metabolic pathway aberrations across both matrices. The altered metabolites potentially involved in the disruption of normal bacterial ecology, malabsorption of nutrients, increased glycolysis, TCA cycle and glutaminolysis, implying a Warburg effect for cell energy production required for rapid proliferation
Background Colorectal cancer (CRC) is a growing cause of mortality in developing countries, warranting investigation into its earlier detection for optimal disease management. Global proton nuclear magnetic resonance (1H NMR)-based metabolomics on stool specimens opens up new possibilities for screening new, efficient and high-throughput CRC screening biomarkers1-6. However, stool metabolite profiles were still limited for direct associations with CRC and adjacent mucosa. This study aimed to profile paralleled metabolites of CRC tissues and adjacent non-cancerous tissues alongside pre- and post-operative stools from the same patients, to investigate how fecal metabolomic phenotypes correlate with the tumor tissue especially in a molecular pathology context. Such information would be vital to bridge the gap between the systemic metabolic characteristics of tissues and feces correlate, and to raises awareness regarding the utility of stool metabolites as relevant indicators of CRC tissue microenvironment.
Methods Twenty-five CRC patients with a scheduled colonic resection participated in this study and provided colorectal cancer tissue (CCT), adjacent noncancerous tissue (ANT, ~1 cm away from the tumor), distal noncancerous tissues (DNT, ~5 cm away from the tumor), together with the corresponding pre- and post-operative stool samples. Tissue samples were extracted with methanol/chloroform solution and the resulting supernatant was dried under vacuum for a minimum of 18 h. The lyophilized power of tissue and stool samples were extracted with PBS/D20 buffer and a stock solution of TSP/D20 was added to each supernatant prior to analysis by 1H NMR spectroscopy. 1HNMR spectra of tissue were recorded by using a standard (1D) Carr-Purcell-Meiboom-Gill (CPMG) pulse sequence with the spin-spin relaxation delay (2nτ) set to 70 ms for all samples. The 90° pulse length was adjusted to about 10 μ s for each sample and a total of 128 transients were collected into 16k data points with a spectral width of 14 ppm. Fecal 1H NMR spectra were recorded by using NOESY (nuclear overhauser enhancement spectroscopy) pulse sequence as previously described 2-6. All spectra were preprocessed and then bucketed with the equal width of 0.002ppm. The region of δ 4.4~ 5.6 was discarded to eliminate the imperfect water suppression. Each bucket was normalized to the total integral of the spectrum prior to OPLS-DA using the SIMCA-P+ program (version 14.1).
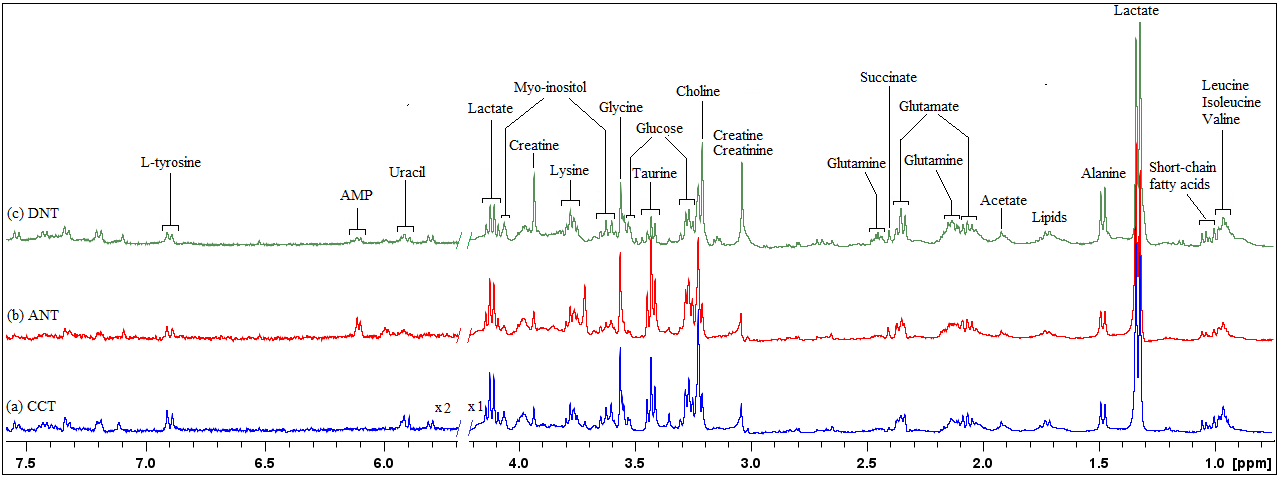
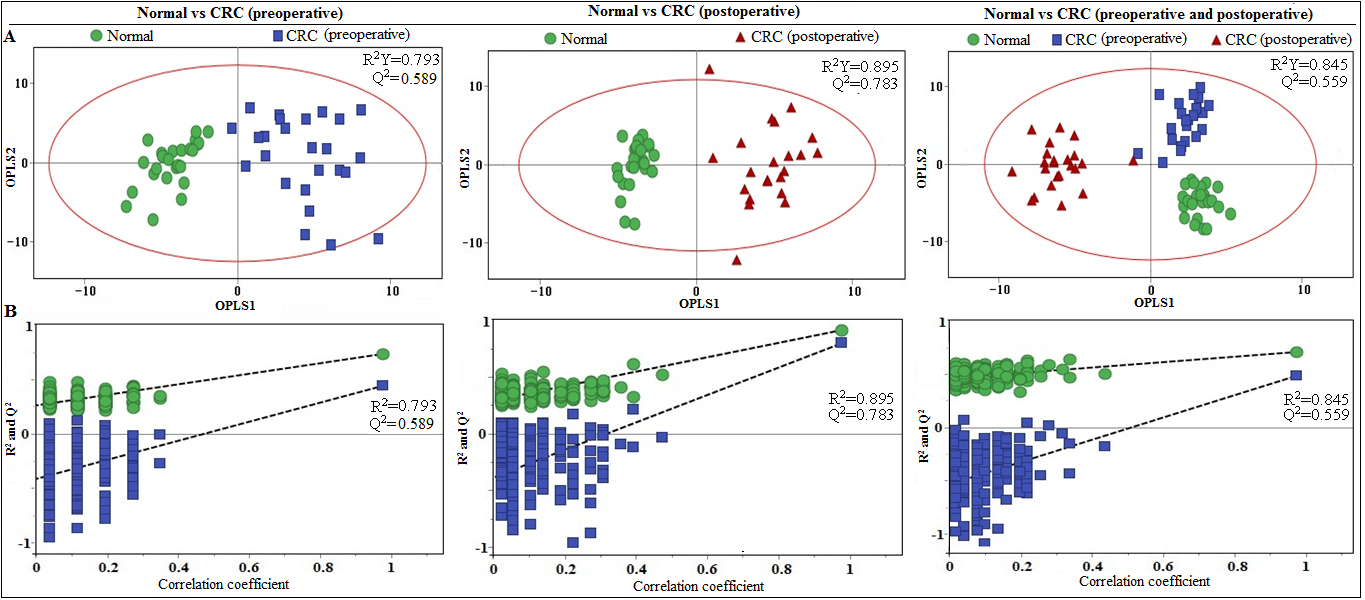
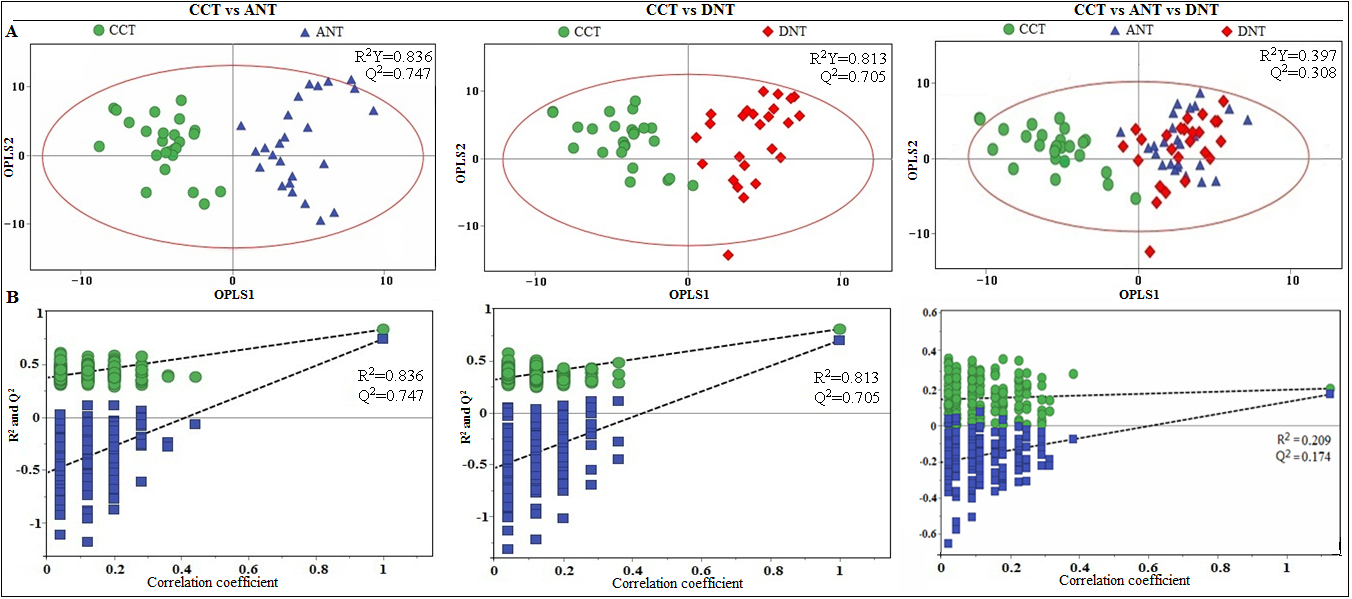
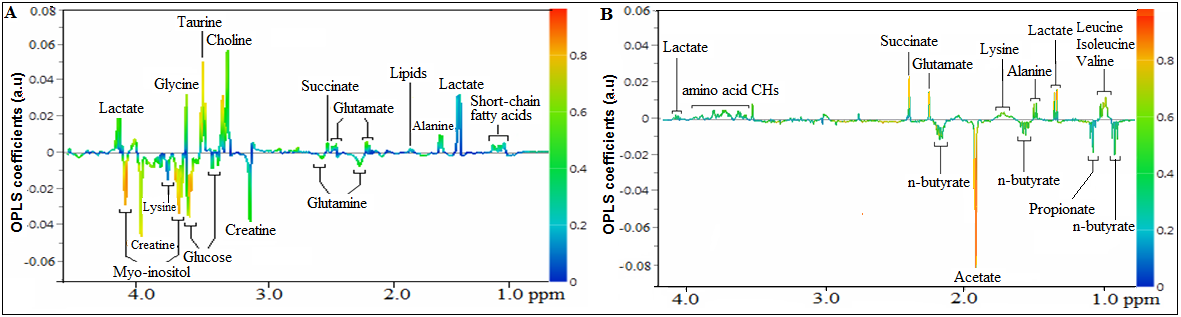
Results Representative 1D 1H NMR spectra of patient-matched colorectal tissue and fecal extracts are shown in Fig 1 and Fig 2, respectively. The standard one-dimension spectrum gave an overview of all metabolites. Good discrimination between pre- and post-operative CRC patients and normal healthy controls was achieved by OPLS-DA scores plot generated from 1H NMR spectra of fecal extracts (Fig.3A). Model parameters of permutation analysis for different groups were as follows: normal vs preoperative CRC: R2Y = 0.793, Q2 = 0.589; normal vs postoperative CRC: R2Y = 0.895, Q2 = 0.783; normal vs pre- and post-operative CRC: R2Y = 0.845, Q2 = 0.559, which indicated the good fit obtained by the model (Fig 3B). As can be seen in Fig 4, tissue metabolic phenotypes discriminated CRC tissues from ANT and DNT, but no trends in differences were detected between ANT and DNT on the scores plot of first two principal components. Their corresponding model validation of permutation analysis were as follows: CCT vs ANT: R2Y = 0.836, Q2 = 0.744; CCT vs DNT: R2Y = 0.813, Q2 = 0.705; CCT vs ANT vs DNT: R2Y = 0.209, Q2 = 0.174. OPLS-DA coefficient-coded loading plots showed distinct disturbances to tissue metabolites of CRC patients, compared with their adjacent non-cancerous tissues, including reduced levels of glutamine, creatine, glucose, lysine, myo-inositol, and elevated quantities of short-chain fatty acids, lactate, alanine, glutamate, succinate, choline, taurine, glycine (Fig 5A). A few of these discriminatory metabolites were also detected in the fecal metabolomic profiling, including lower levels of short-chain fatty acids (butyrate, propionate, acetate), glucose, glutamine, and higher metabolite levels of lactate, glutamate, succinate and lysine, identified from CRC patients (pre-surgery) as compared to the healthy controls.
Discussion and Conclusion Our initial paralleled investigations of patient-matched cohort have revealed a few overlapping discriminatory metabolites between the CRC and stool metabolomes, indicating the networks for metabolic pathway aberrations across both matrices. These altered metabolites potentially involved in the disruption of normal bacterial ecology, malabsorption of nutrients, increased glycolysis, TCA cycle and glutaminolysis, implying a Warburg effect for cell energy production required for rapid proliferation. Larger patient-matched CRC, adjacent non-cancerous colonic tissues, and stool cohort studies for metabolite profiling will be required to validate these small molecule differences and metabolic pathway aberrations for CRC screening, management and prevention.
Acknowledgements
National Natural Science Foundation of China (81471729, 81101102), the Science and Technology, Planning Project of Guangdong Province ( 2016A020216025), the Research Award Fund for Outstanding Young Teachers in Higher Education Institutions, Guangdong Province (YQ2015245), and the National Natural Science Foundation of Guangdong Province (S2011010004973).References
1. Bezabeh T., et al. Detecting colorectal cancer by 1H magnetic resonance spectroscopy of fecal extracts. NMR Biomed, 2009. 22(6): p. 593-600.
2. Yan Lin, Changchun Ma, Chengkang Liu, et al. NMR-based fecal metabolomics fingerprinting as predictors of earlier diagnosis in patients with colorectal cancer. Oncotarget, 2016. 16 (10).
3. Yan Lin, Changchun Ma, Zhiwei Shen et al. NMR-based fecal metabolomics fingerprinting as predictors of earlier diagnosis in patients with colorectal cancer. Proc. Intl. Soc. Mag. Reson. Med (ISMRM), 2016.
4. Yan Lin, Changchun Ma, Zhiwei Shen et al. Metabolic signatures of colorectal cancer in biofluids: NMR-based metabolomics of fecal extracts. Proc. Intl. Soc. Mag. Reson. Med (ISMRM), 2015.
5. Yan Lin, ChengKang Liu, Zhiwei Shen et al. NMR-based metabolite profiling of fecal extracts from patients with chronic ulcerative colitis and colorectal cancer. Proc. Intl. Soc. Mag. Reson. Med (ISMRM), 2014.
6. Yan Lin, ChengKang Liu, Zhiwei Shen et al. NMR-based metabolite profiling of fecal extracts from colorectal cancer in China: an initial study. Proc. Intl. Soc. Mag. Reson. Med (ISMRM), 2013.
Figures