0326
Simultaneous Iron and Fat Quantification Using an Auto Regressive Moving Average Model at 1.5T and 3T1Diagnostic Imaging, St. Jude Children's Research Hospital, Memphis, TN, United States, 2Radiology – Medical Physics, Medical Center – University of Freiburg, Freiburg, Germany, 3Imaging Physics, The University of Texas MD Anderson Cancer Center, TX, United States, 4Hematology, St. Jude Children's Research Hospital, Memphis, TN, United States
Synopsis
A major confounder of hepatic iron assessment by R2*-MRI is fat (e.g. steatosis) which introduces signal modulations. In this study, we systematically evaluate two signal modeling techniques, an autoregressive moving average (ARMA) model and the method provided by the ISMRM Fat-Water Toolbox for simultaneous iron and fat quantification in phantoms and in vivo. Preliminary data suggest that ARMA and Toolbox can be used for iron and fat quantification at 1.5T and 3T. In severe iron-overload cases, both, ARMA and the Toolbox might produce inaccurate FF results, however in vivo ARMA seemed to provide a more robust liver R2* quantification.
Introduction
Accurate assessment of hepatic iron content (HIC) via R2*-MRI is critical for clinical management of patients with iron overload.1,2 Hepatic R2* is measured by analyzing the exponential signal decay of multi gradient echo (mGRE) images. One of the major confounding factors in R2* quantification is the presence of fat (e.g. in hepatic steatosis) which introduces additional modulations in the mGRE signal and corrupts the R2* quantification. Signal modeling techniques have been developed for fat-water quantification that account for the multi-peak spectrum of fat in order to simultaneously quantify fat-fraction (FF) and R2*.3 Previous studies also demonstrated that an autoregressive moving average (ARMA) model,4 which makes no assumptions about the fat spectrum, accurately quantifies hepatic R2* in the presence of iron alone5 and FF in the absence of iron6. In this study, we evaluate ARMA for simultaneous iron and fat quantification in phantoms and in vivo, and use an approach available in the ISMRM Fat-Water Toolbox7 for comparison.Materials & Methods
Twenty cylindrical 140 ml fat-iron phantoms were constructed from 2% agar-water mixtures, peanut oil and bionized nonferrites (BNF) iron particles.8,9 The phantoms consisted of varying fat percentages (0, 10, 20, 40%) and iron concentrations (0, 7.5, 15, 30, 60μg/ml) to cover the clinically relevant R2* range observed in patients with iron overload. Echo-shifted, dual-shot 2D-monopolar mGRE images (TR/TE1/combined ΔTE=200/1.2/0.72ms, 20 echoes/shot, α=25°, FOV=300mm, matrix=128x104, SL=10mm) were acquired at 1.5T and 3T. In vivo data was collected from two patients, one with biopsy confirmed iron overload and steatosis and another with biopsy confirmed severe iron overload and no steatosis. Both patients received 1.5T scans using breath-hold 2D-monopolar-mGRE (TR/TE1/ΔTE=200/1.07/1.51ms, 20 echoes, α=35°, FOV=300mm, matrix=128x104, SL=5mm) for clinical monitoring of HIC.
ARMA modeling was performed on the complex mGRE signal acquired in phantoms and patients to determine the R2* values and FFs via an iterative Stieglitz-McBride algorithm.4-6 In addition, the complex mGRE images were processed using a complex-based non-linear least squares (NLSQ) method that utilizes graphcut for B0 field estimation approach (ISMRM Fat-Water Toolbox7) to calculate R2* and FF maps. Mean R2* and FF results obtained with ARMA and Toolbox were compared to the true FFs and iron concentrations in phantoms. Similarly, the R2* and FF maps were calculated in patients with both methods. For the patient with no steatosis, the mean R2*s obtained with ARMA and Toolbox were compared to a reference R2* estimate obtained with a published magnitude-based nonlinear least-squares (NLSQ) fitting routine,2 which is accurate for scenarios with iron-overload only.
Results & Discussion
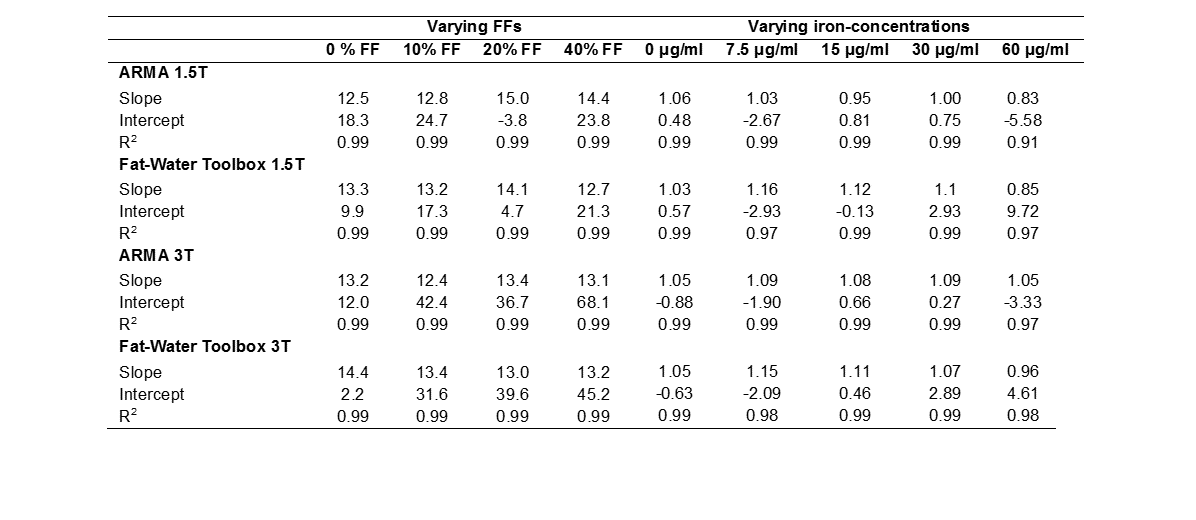
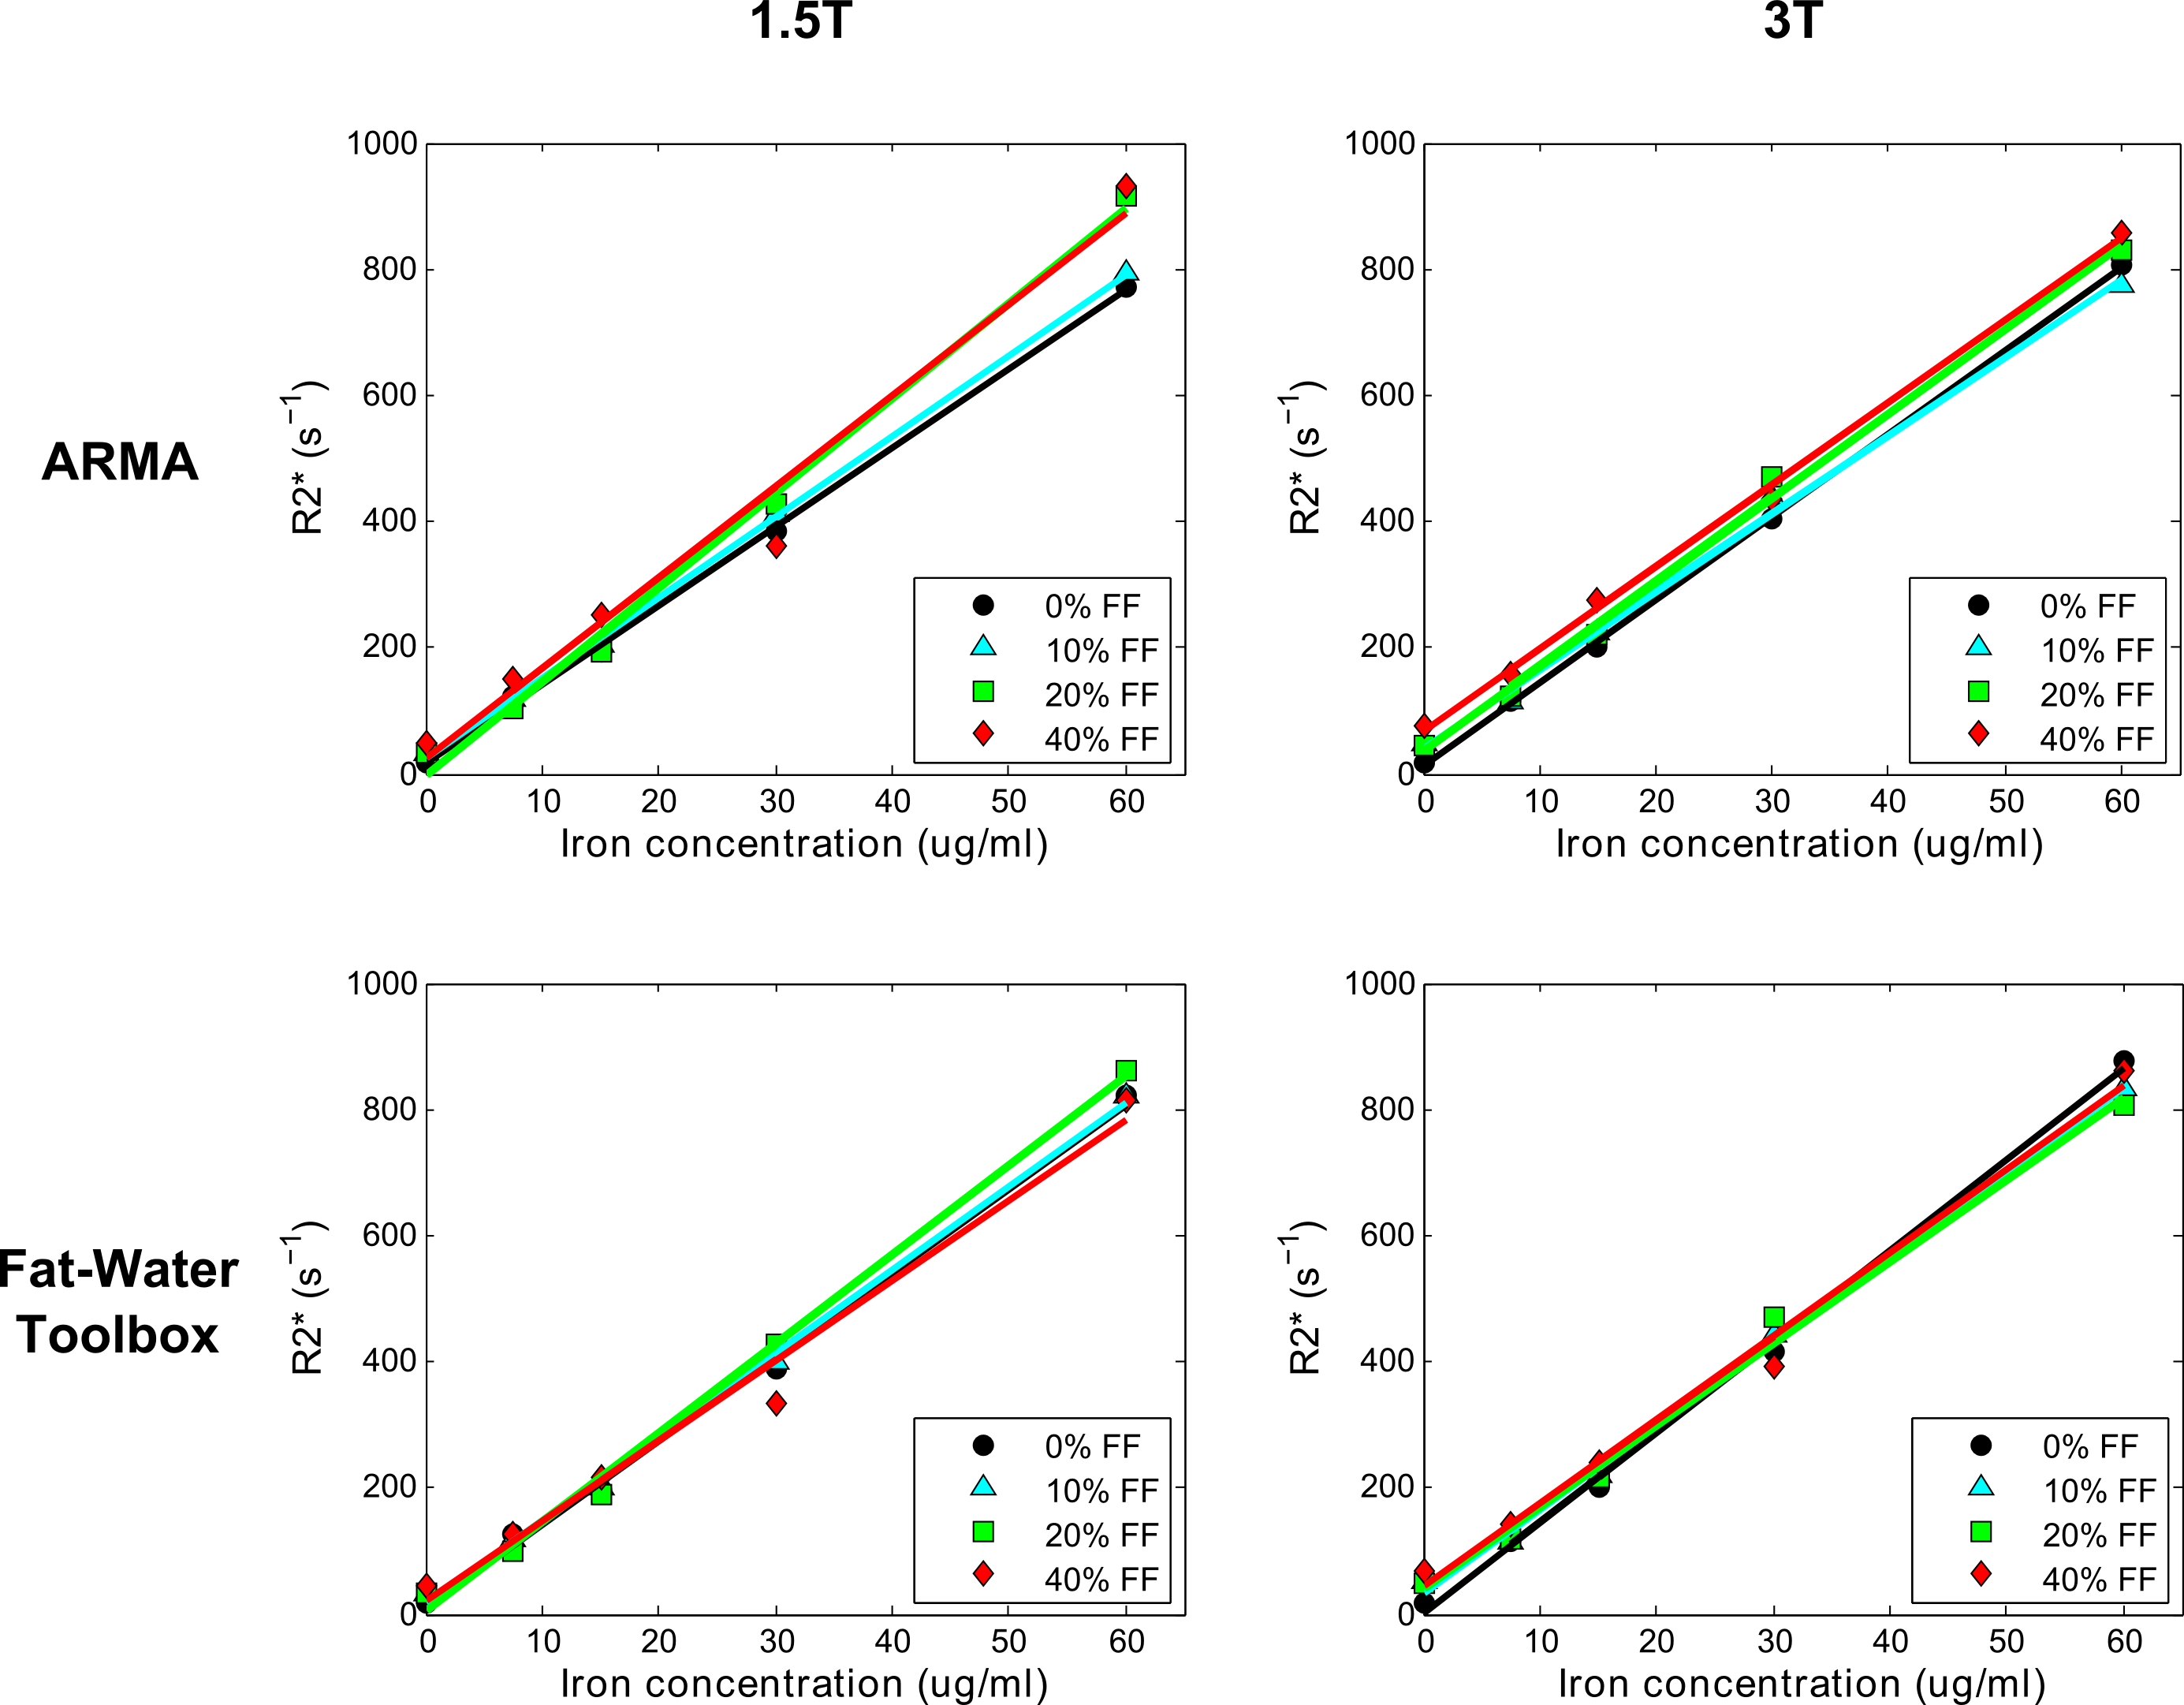
Phantom R2* values calculated using ARMA and the Toolbox showed an excellent linear relationship with iron concentrations for varying FFs at both field strengths (Table1, Fig.1). Likewise, phantom FFs estimated using both methods (Table1, Fig.2) are in excellent agreement to the theoretical FFs for all iron concentrations except for the most extreme (60μg/ml; R2*~850 s-1). In presence of high iron, the signal decays rapidly, limiting dephasing between water and fat components and causing fat quantification to become less stable.10
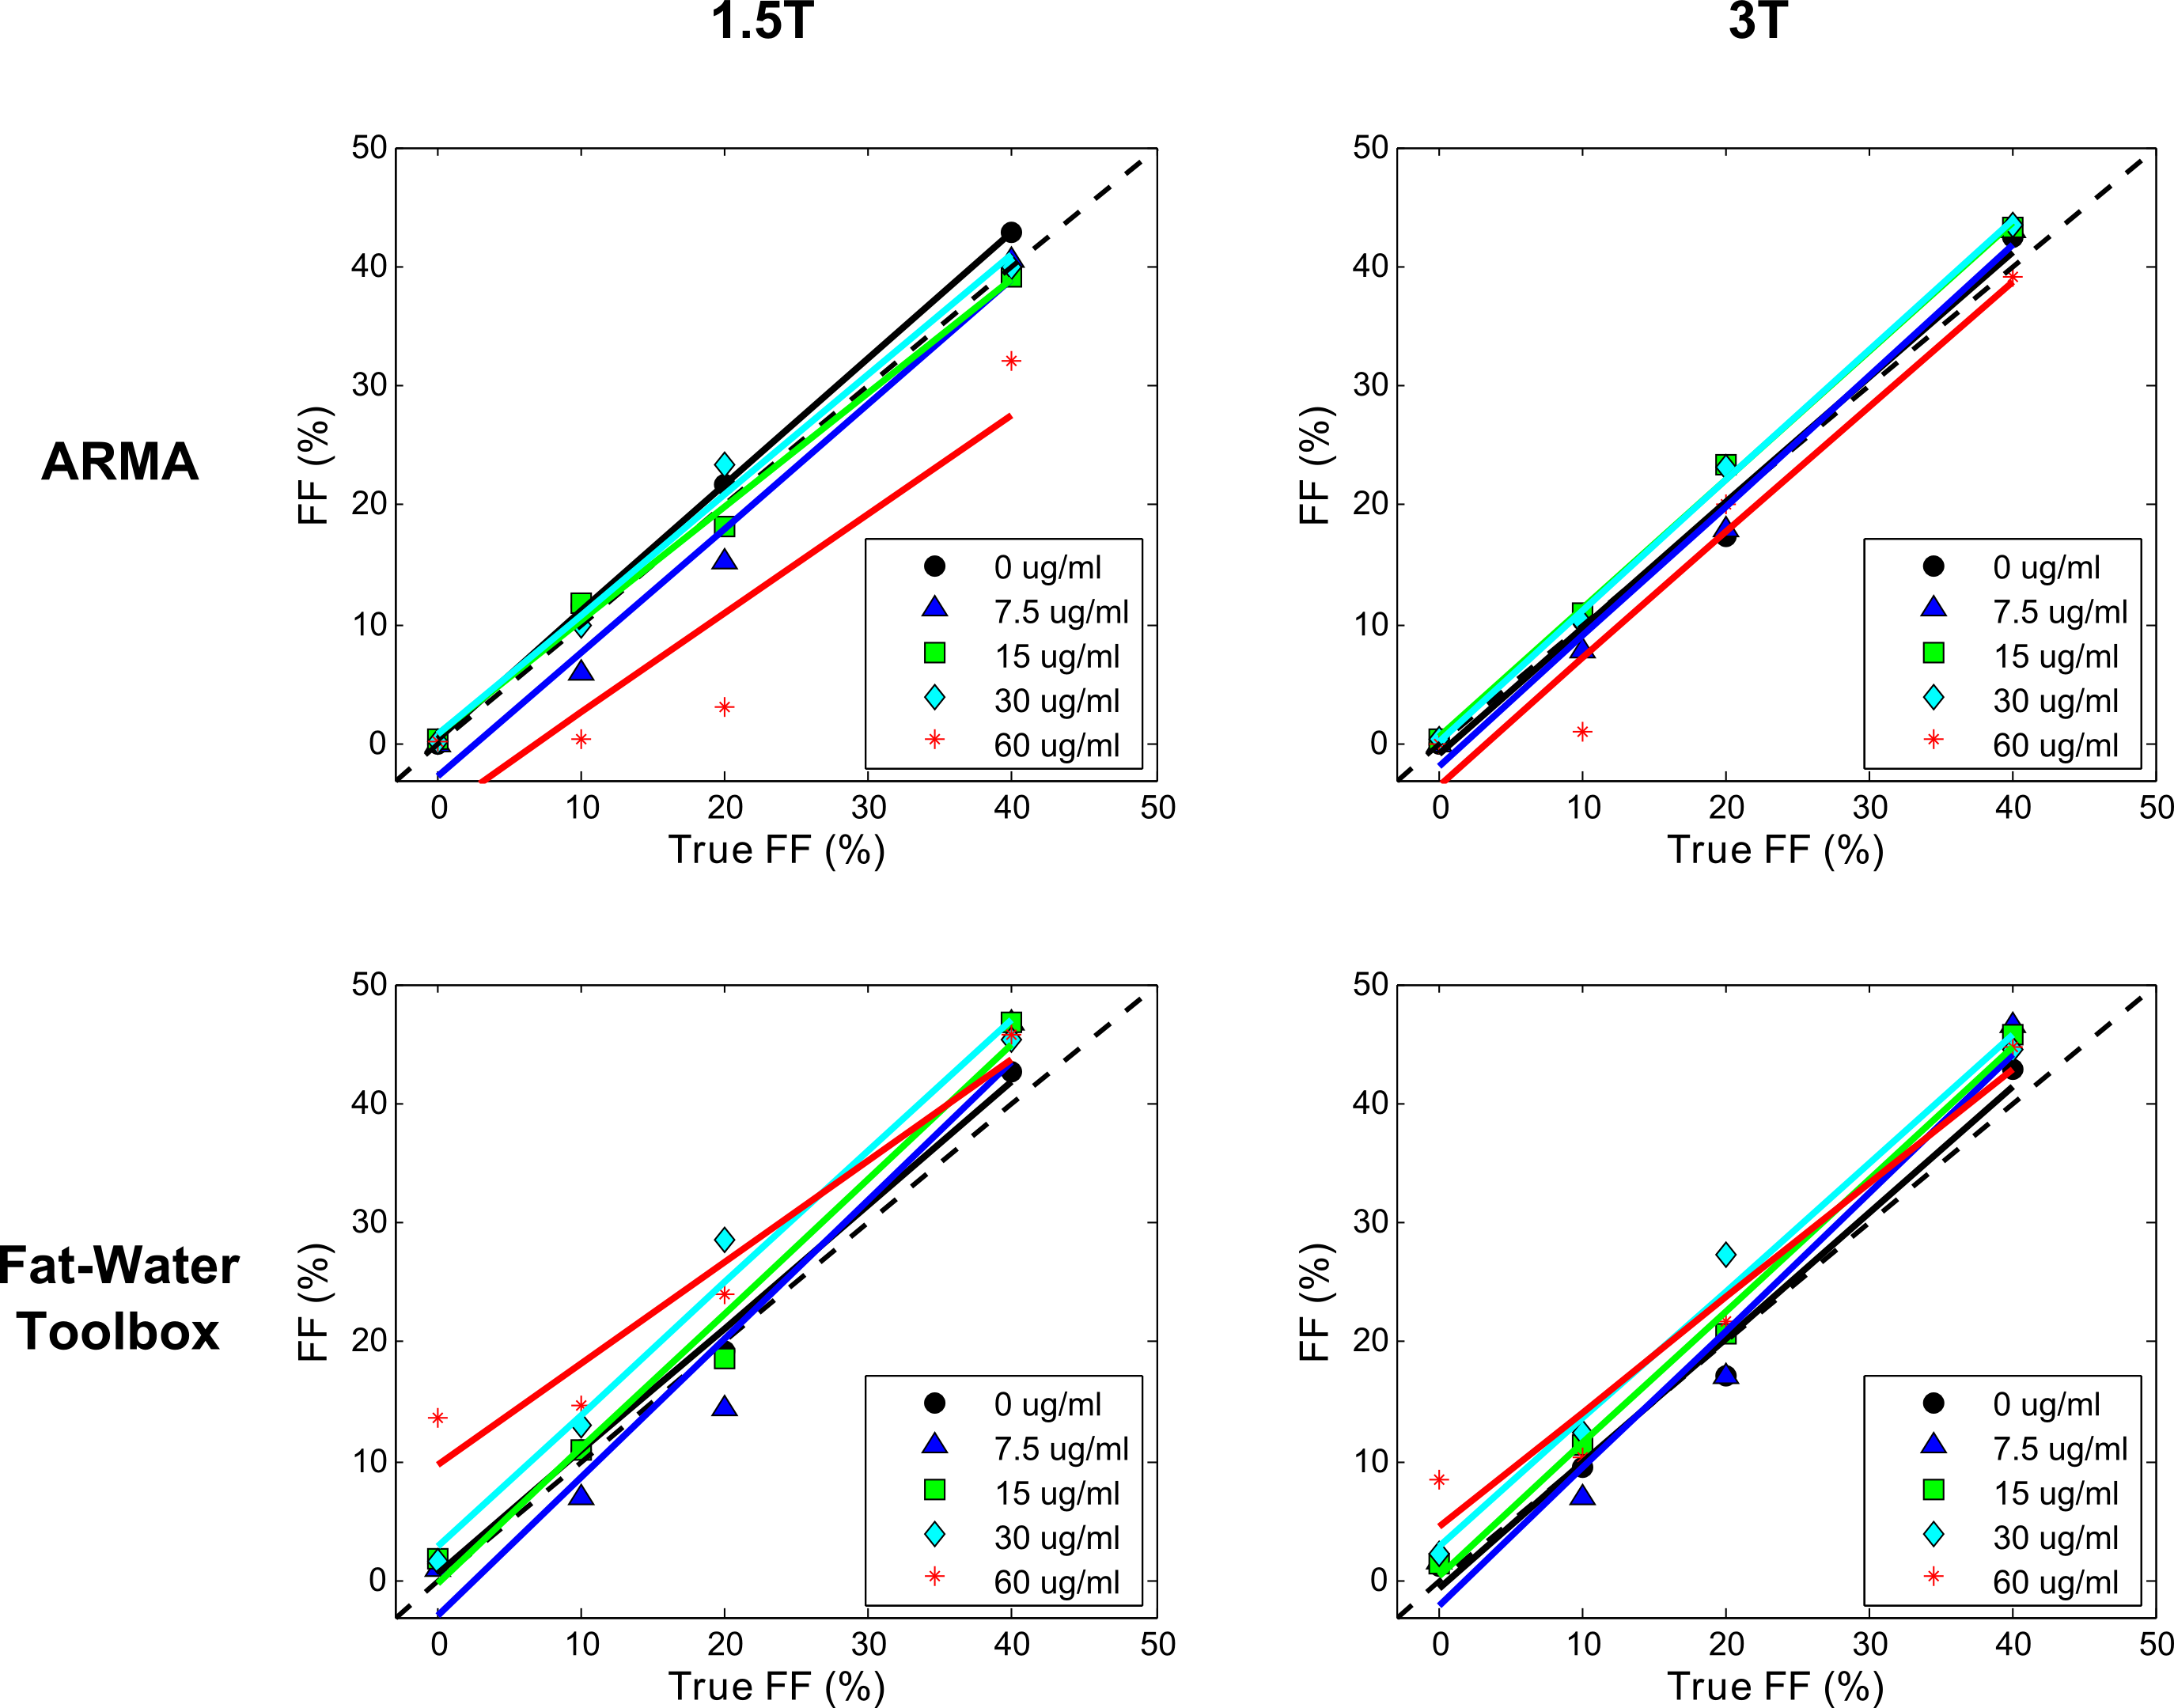
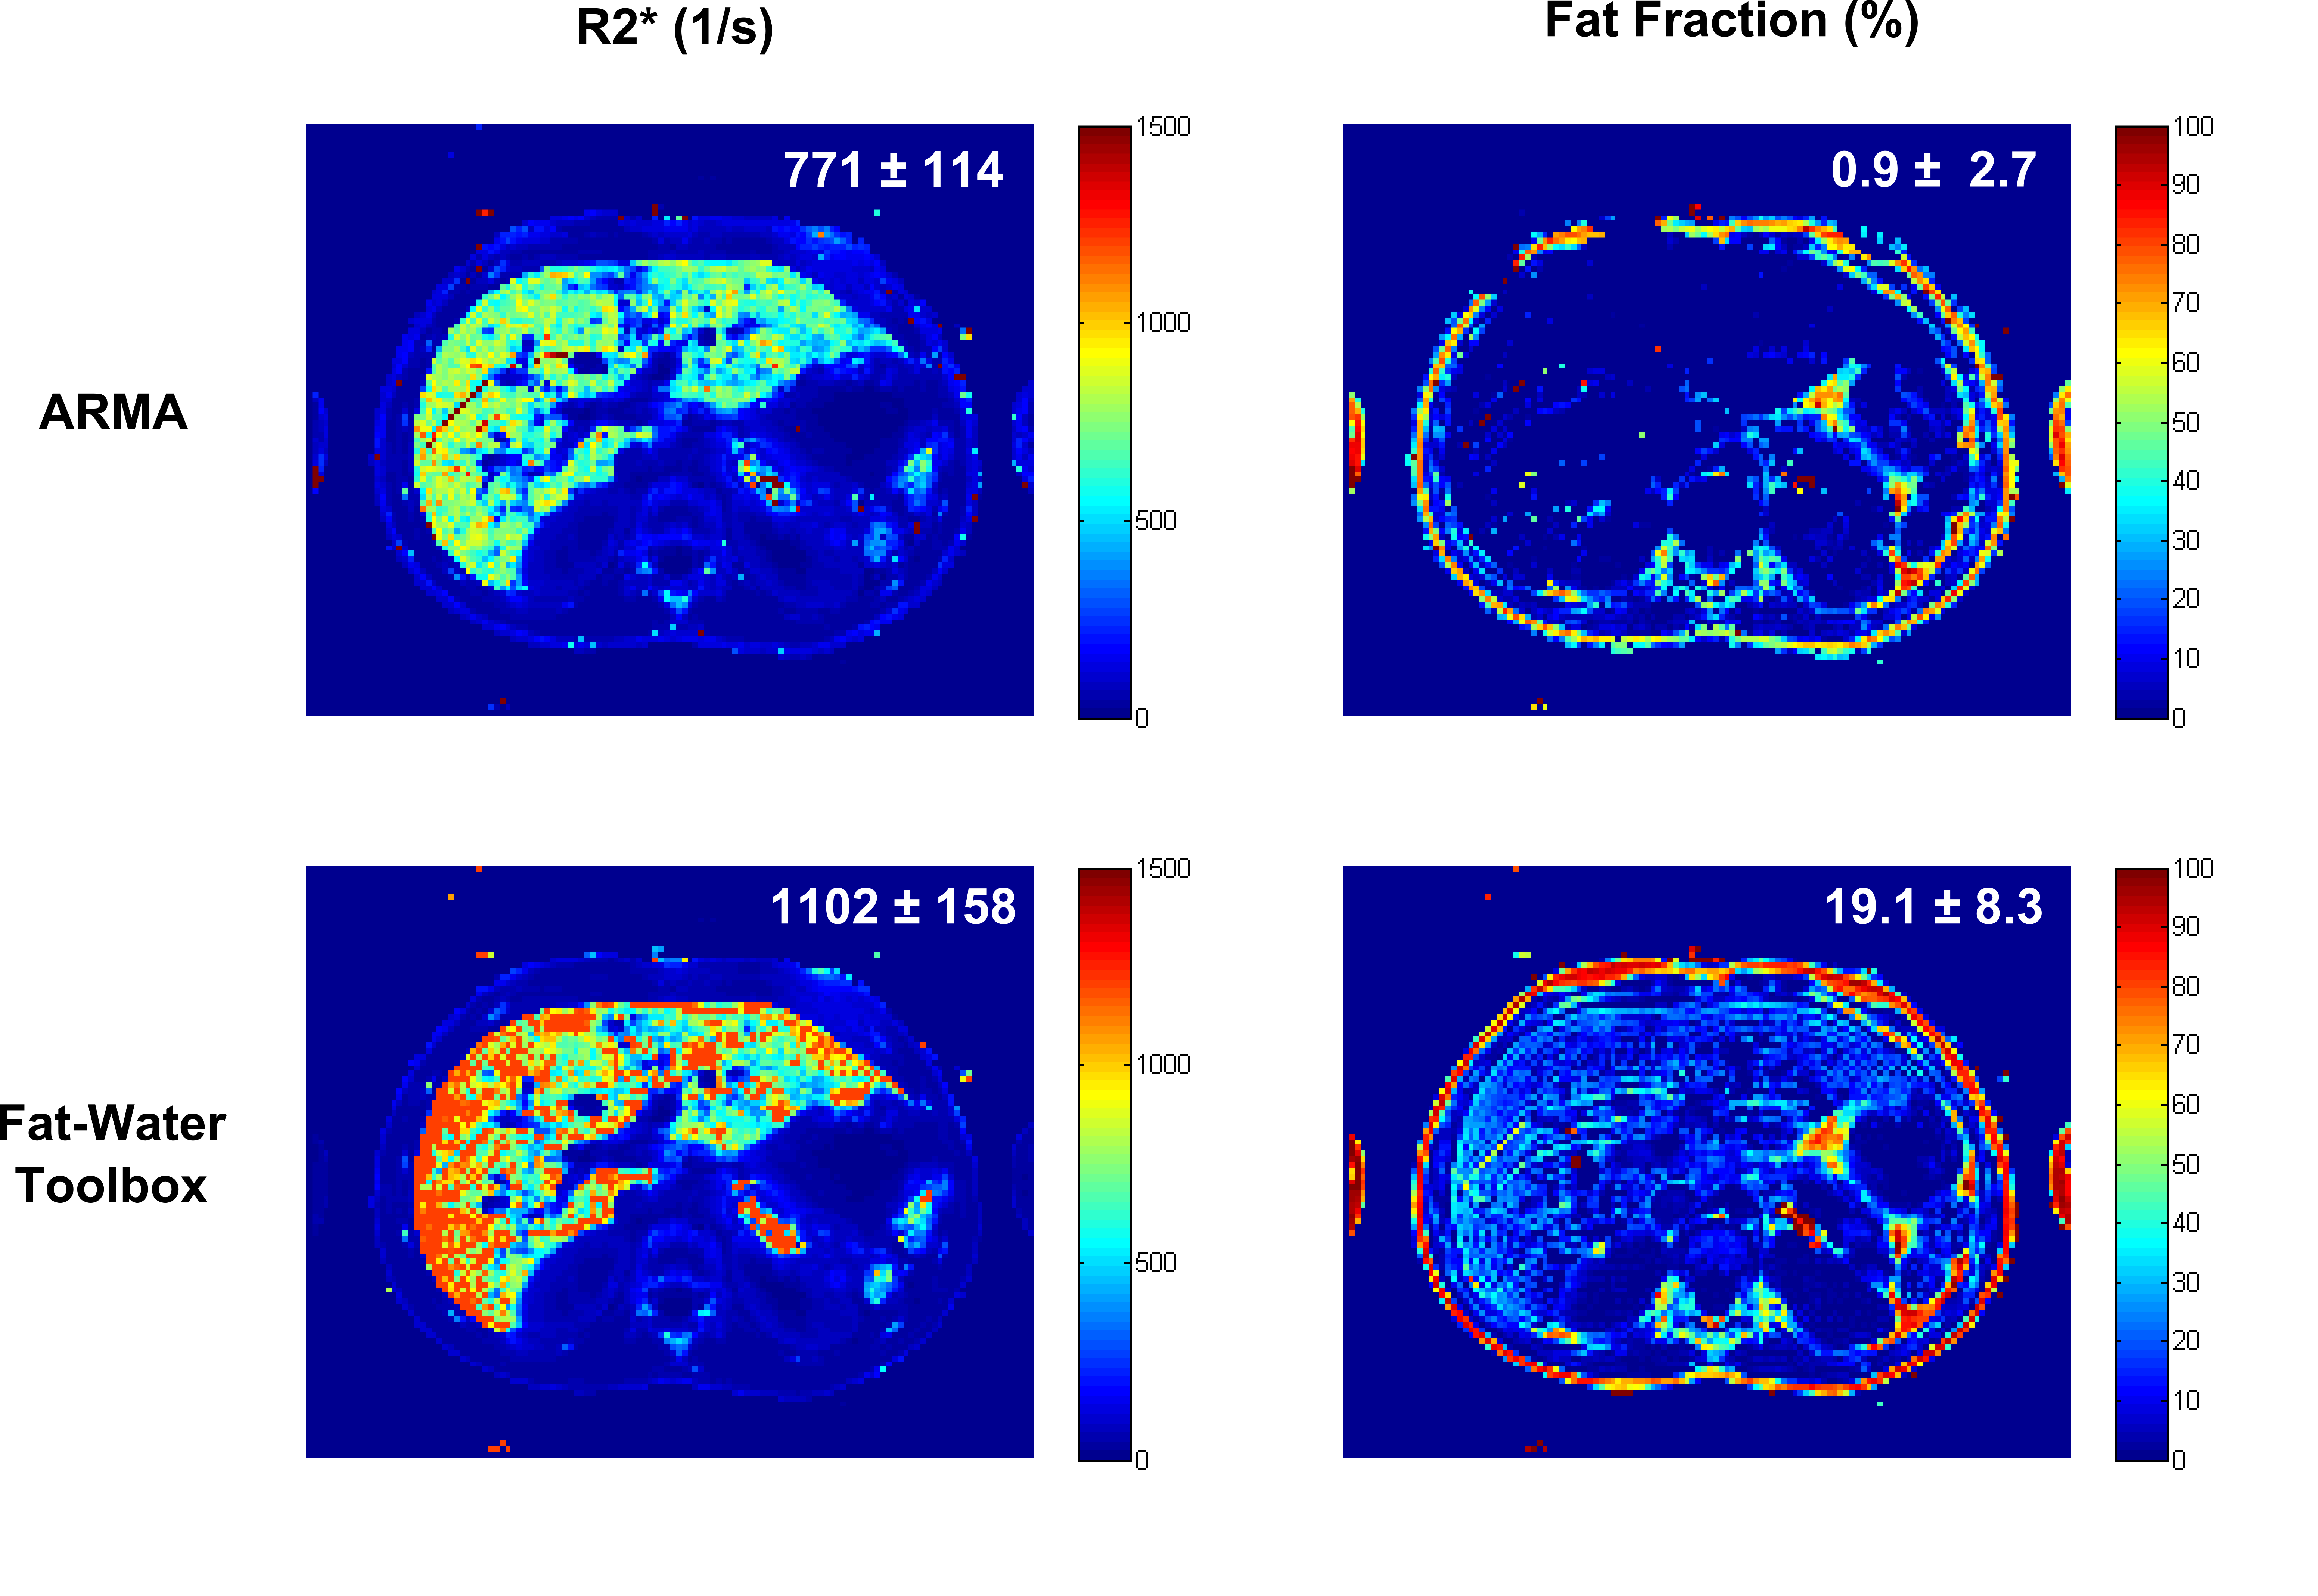
For the patient with mild hepatic iron and fat, the mean R2*s using both methods were in good agreement but the FF calculated using ARMA was slightly smaller compared to the Toolbox (Fig.3). The reason might be that ARMA does not assume relative amplitudes of the multi-peak fat spectrum11 whereas the Toolbox uses prior information about the relative fat amplitudes. Therefore, any inability to detect the low amplitude fat peaks might lead to slight underestimation. Unfortunatley, no gold-standard FF measurement from biopsy or spectroscopy was available as a reference. For the patient with severe HIC and no steatosis (Fig.4), ARMA produced a homogeneous liver R2* map and the mean R2* was close to NLSQ R2* (745±89s-1) with a FF ~0%. In contrast, the liver R2* map calculated by the Toolbox was not homogeneous and appeared to overestimate R2*. Further, the Toolbox produced a mean FF ~19% where there is no fat as confirmed by post-MRI liver biopsy. The patient data was collected using only single-shot mGRE (ΔTE=1.51ms) compared to the dual-shot echo-shifted approach (ΔTE=0.72ms) used in phantoms; therefore, inaccurate FFs in presence of even moderate HIC (R2*>500 s-1) are expected. In these cases, short TE1 and ΔTE protocols could be used to improve R2* and FF assessment.10
Conclusion
Preliminary data suggests that ARMA can be used for simultaneous iron and fat quantification at 1.5T and 3T. In severe iron overload cases, both, ARMA and the Toolbox might produce inaccurate FF results, however in vivo ARMA seemed to provide a more robust R2* quantification.Acknowledgements
No acknowledgement found.References
1. Wood JC, Enriquez C, Ghugre N, et al. MRI R2 and R2* mapping accurately estimates hepatic iron concentration in transfusion-dependent thalassemia and sickle cell disease patients. Blood. 2005; 106: 1460-5.
2. Hankins JS, McCarville MB, Loeffler RB, et al. R2* magnetic resonance imaging of the liver in patients with iron overload. Blood. 2009; 113: 4853-5.
3. Hernando D, Kramer JH and Reeder SB. Multipeak fat-corrected complex R2* relaxometry: theory, optimization, and clinical validation. Magnetic resonance in medicine. 2013; 70: 1319-31.
4. Taylor BA, Hwang KP, Hazle JD and Stafford RJ. Autoregressive moving average modeling for spectral parameter estimation from a multigradient echo chemical shift acquisition. Medical physics. 2009; 36: 753-64.
5. Taylor BA, Loeffler RB, Song R, McCarville MB, Hankins JS and Hillenbrand CM. Simultaneous field and R2 mapping to quantify liver iron content using autoregressive moving average modeling. Journal of magnetic resonance imaging : JMRI. 2012; 35: 1125-32.
6. Krafft AJ, Taylor BA, Lin H, Loeffler RB and Hillenbrand CM. A Systematic Evaluation of an Auto Regressive Moving Average (ARMA) Model for Fat-water Quantification and Simultaneous T2* Mapping. International Society of Magnetic Resonance in Medicine. Salt Lake City, Utah2013.
7. Hu HH, Bornert P, Hernando D, et al. ISMRM workshop on fat-water separation: insights, applications and progress in MRI. Magnetic resonance in medicine : official journal of the Society of Magnetic Resonance in Medicine / Society of Magnetic Resonance in Medicine. 2012; 68: 378-88.
8. Hines CD, Yu H, Shimakawa A, McKenzie CA, Brittain JH and Reeder SB. T1 independent, T2* corrected MRI with accurate spectral modeling for quantification of fat: validation in a fat-water-SPIO phantom. Journal of magnetic resonance imaging : JMRI. 2009; 30: 1215-22.
9. Krafft AJ, Loeffler RB, Song R, et al. Does fat suppression via chemically selective saturation affect R2*-MRI for transfusional iron overload assessment? A clinical evaluation at 1.5T and 3T. Magnetic resonance in medicine. 2015.
10. Hernando D. Limits of liver fat quantification in the presence of severe iron overload. ISMRM. 2014.
11. Hamilton G, Yokoo T, Bydder M, et al. In vivo characterization of the liver fat (1)H MR spectrum. NMR in biomedicine. 2011; 24: 784-90.
Figures