0325
Geometric distortion due to B0 inhomogeneity in liver MR imaging under inhalation and exhalation breath-hold1Medical Physics and Research Department, Hong Kong Sanatorium & Hosptial, Hong Kong, Hong Kong
Synopsis
Geometric accuracy is critical for radiotherapy and is one major concern in the application of MRI in radiotherapy. Since the geometric distortion and B0 inhomogeneity are related, we aim to evaluate the geometric distortion due to ΔB0 variation at inhalation and exhalation breath-hold. Based on our results, larger geometric distortion was noted during inhalation than exhalation.
Purpose
Geometric accuracy is one major concern when applying MRI for radiotherapy purpose. MR geometric distortion is related to various factors, and B0 inhomogeneity (ΔB0) is one of them. Besides ΔB0 due to magnet imperfection, B0 inhomogeneity can be also related to organ shape, tissue-specific magneticMethod
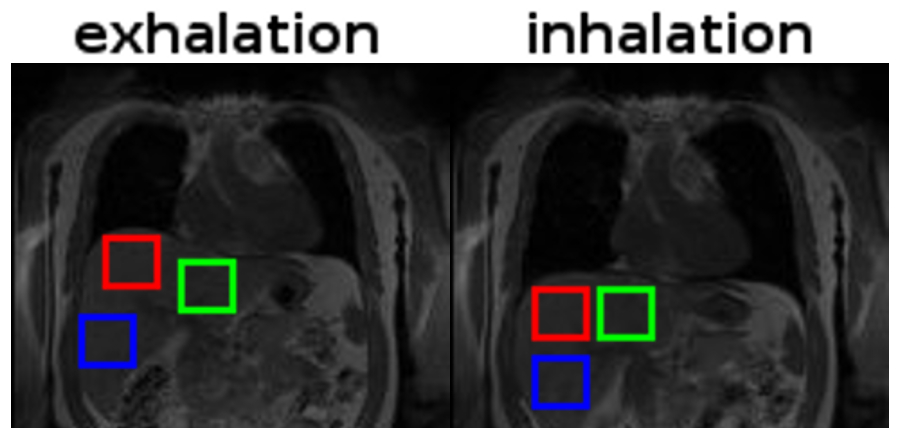
Liver imaging was conducted in 7 healthy volunteers using a 1.5T Siemens MR scanner (Aera, Siemens Healthineers, Erlangen, Germany). Coronal images at inhalation breath-hold and exhalation breath-hold were acquired using a dual echo GE sequence (TR=70-137ms, TE1/TE2 = 4.76/9.52ms, slice thickness = 8-10mm, 5-11 slices, 38-48cm FOV, matrix=192x192 or 110x110, Bandwidth=260 or 1000Hz/pixel, phase encoding (PE) direction = left-right). The corresponding ΔB0 map was first calculated from phase images using customized Matlab script (Mathworks, Natick, MA) and then geometric distortion along frequency encoding (FE) direction (ΔdFE) was derived. For each image set, three square ROIs, with two ROIs at the right liver lobe (proximal and distal to the lung, hereafter RLp and RLd) and one ROI at the left liver lobe (LL), were drawn (Figure 1). To avoid phase wrapping, all ROIs were chosen away from the interface with large susceptibility difference. A Wilcoxon signed-rank test was performed to compare the ΔdFE at inhalation and exhalation breath-hold in three ROIs.Results
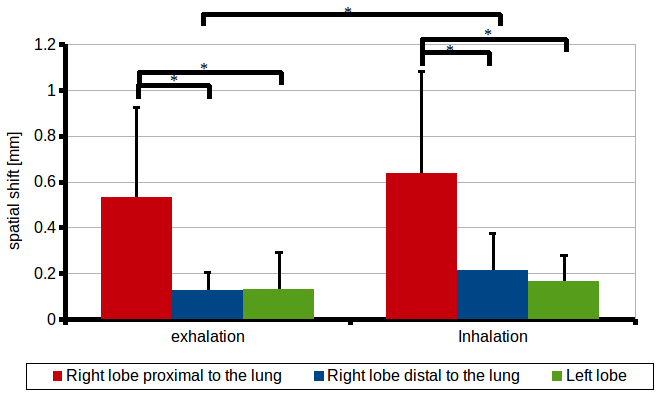
As illustrated in Figure 2, the measured ΔdFE at inhalation in the RLd was significantly higher than that at exhalation (0.21±0.16mm and 0.13±0.08mm, P<0.05). Larger ΔdFE was also observed in the RLp (inhalation: 0.64±0.44mm and exhalation: 0.53±0.39mm, P=0.11) and LL (inhalation: 0.16±0.11mm and exhalation: 0.13±0.16mm, P=0.30). Significantly higher ΔdFE was also observed in RLp (inhalation: 0.64±0.44mm and exhalation: 0.53±0.39mm) when comparing to LL (inhalation: 0.16±0.11mm, P<0.05 and exhalation: 0.13±0.16mm, P<0.05) and RLd (inhalation: 0.21±0.16mm, P<0.05 and exhalation: 0.13±0.08mm, P<0.05). When comparing between RLd and LL, no significant difference in ΔdFE was observed at inhalation (RLd: 0.21±0.16mm and LL: 0.16±0.11mm, P=0.14) and at exhalation (RLd: 0.13±0.08mm and LL: 0.13±0.16mm, P > 0.05).Discussion
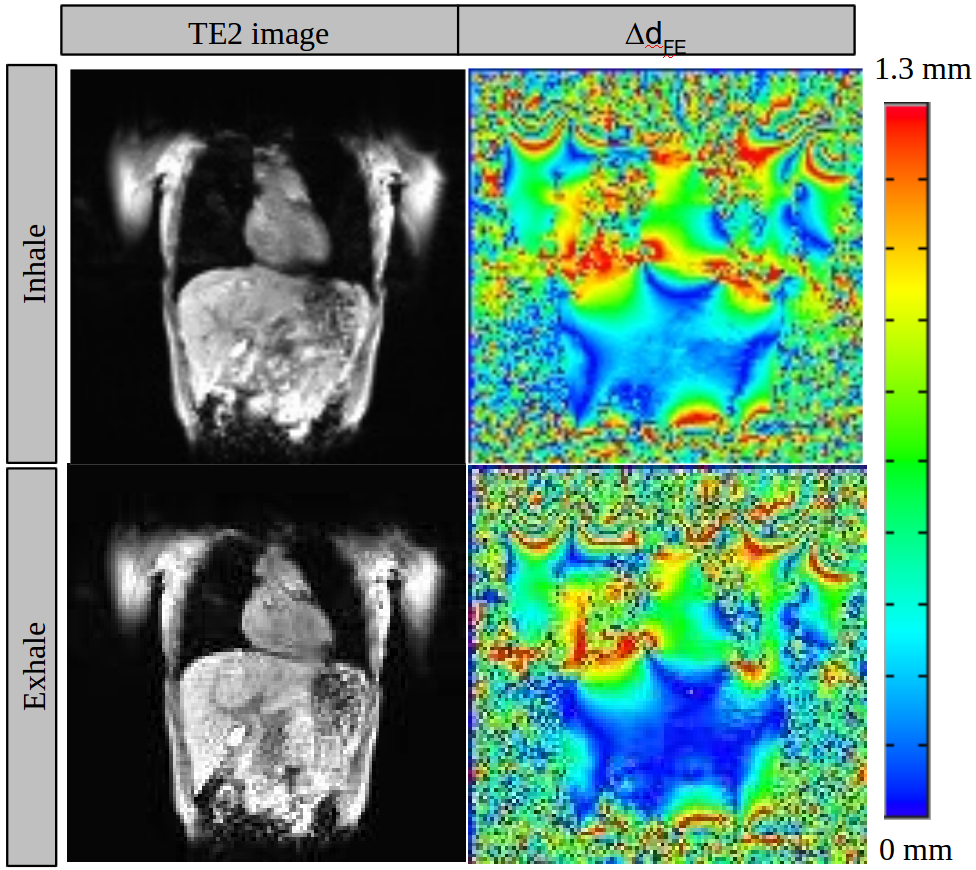
In this study, we have presented the geometric distortion pattern in the liver due to ΔB0 variation at inhalation and exhalation. For all ROIs, larger ΔdFE was observed at inhalation breath-hold than at exhalation breath-hold, which may be related to the amount of air presence in the lung. As illustrated in Figure 3, the largest geometric distortion was observed mostly at the location with large magnetic susceptibility difference (e.g. liver-lung interface). The largest ΔdFE was observed at the RLp because RLp was chosen at a location close to the liver-lung interface. On the other hand, ΔdFE of LL was smaller than ΔdFE of RLp though ROIs of LL and RLp were chosen at a similar proximity to the lung. The smaller ΔdFE observed in LL than in RLp might be explained by the lower tissue magnetic susceptibility difference between the heart and the liver. Note that LL is more prone to cardiac motion but this passive motion of LL should be negligible in the ΔTE of 4.76ms. There are several limitations in this study: (1) the mismatch in the each ROI location between inhalation and exhalation breath-hold was ignored; (2) geometric distortion could only be assessed along FE direction and (3) small sample size used in this study. Nonetheless, compared to the reported 12 to 26 mm of the liver respiratory motion along SI by Rohlfing et al [3], our observed ΔdFE was generally small (mostly less than 1mm) for both inhalation and exhalation breath-hold for all ROIs, indicating the small contribution of geometric distortion due to ΔB0 variation to the positional uncertainty of the liver during respiration.Conclusion
The geometric distortion in liver due to ΔB0 variation at inhalation and exhalation has been obtained in this study. For all ROIs and both respiratory states, the calculated ΔdFE (along SI direction) was generally less than 1mm.Acknowledgements
No acknowledgement found.References
[1] Bolan PJ, Henry P, Baker EH, et al. Measurement and correction of respiration-induced B0 variations in breast 1H MRS at 4 Tesla. MRM 52: 1239-1245 (2004)
[2] Stanescu T and Jaffray D. Investigation of the 4D composite MR image distortion field associated with tumor motion for MR-guided radiotherapy. Medical Physics 43: 1550-62 (2016)
[3] Rohlfing T, Maurer C, O’Dell W, et al. Modeling liver motion and deformation during the respiratory cycle using intensity-based registration of gated MR images. Med. Phys. 32: 427-32 (2004)
Figures