0324
3D Pancreatic Perfusion MRI using Through-Time Spiral GRAPPA Acceleration1Radiology, Case Western Reserve University, Cleveland, OH, United States, 2Biomedical Engineering, Case Western Reserve University
Synopsis
In this study, free-breathing 3D pancreatic perfusion quantification was achieved using a rapid non-Cartesian parallel imaging technique. The method was applied to 11 asymptomatic subjects and the values are in good agreement with literature values. Significant differences in both Ktrans and Kep were noticed between different locations in the pancreas, but no significant difference was found in the volume of distribution (Ve).
Purpose
Pancreatic perfusion quantification using dynamic contrast-enhanced (DCE) MRI has value in evaluation of conditions as acute and chronic pancreatitis, pancreatic cancer, and evaluation of pancreatic grafts after transplant (1-4). Non-invasive and accurate estimation of pancreatic perfusion poses technical challenges, mainly due to physiological motion and the requirement for both high spatial and temporal resolution. A rapid 3D acquisition method using a fast spiral readout in combination with through-time spiral GRAPPA reconstruction has been developed and implemented for free-breathing liver perfusion quantification (5). The purpose of this study was to evaluate the utility of this rapid non-Cartesian parallel imaging technique for high spatiotemporal resolution pancreatic perfusion imaging.Methods
This is a retrospective study to investigate 3D pancreatic perfusion imaging using the DCE-MRI data previously acquired for free-breathing liver perfusion imaging (5). Eleven asymptomatic subjects (M:F, 8:3; mean age, 20.6 years) were included in this study. The MRI experiments were performed on a Siemens 3T Skyra scanner using a body/spine array coil with 30 receive coils. The rapid DCE-MRI data were acquired using a variable-density stack-of-spirals gradient echo acquisition undersampled in-plane by an acceleration factor of 6, and then reconstructed using the 3D through-time spiral GRAPPA method (6). For each subject, 100-120 volumes were acquired continuously with a temporal resolution of ~2 seconds, and the whole scan required approximately 4 minutes. After the 5th volume was acquired, 0.1 mmol/kg Gadobenate (Multihance, Bracco Diagnostics, Princeton, NJ) was injected at 3 mL/s followed by 20 mL of saline flush. Other imaging parameters included: FOV=42×42 cm; matrix size 224×224; slice thickness 3 mm; number of partitions, 60; partial Fourier in the partition direction, 6/8.
After the undersampled data were reconstructed offline, the free-breathing abdominal images were co-registered to remove the respiratory motion using a multi-reference method (5). This method was applied to reduce the effects of dynamic contrast changes on registration. Arterial input function was characterized for each subject using the slices near the end of imaging slab to minimize in-flow artifacts. Region-of-interest (ROI) at the head, body and tail of pancreatic parenchyma was drawn by a radiologist with 9 years of experience and overall 8~16 ROIs were drawn for each subject dependent on the size of pancreas. Perfusion quantification was then performed using a single-input tracer kinetic model and three perfusion parameters including the rate constant of contrast agent from blood plasma to extracellular space (Ktrans), the rate constant of contrast agent from extracellular space to blood plasma (Kep), and volume of distribution (Ve =Ktrans/Kep) were quantified (1).
Results
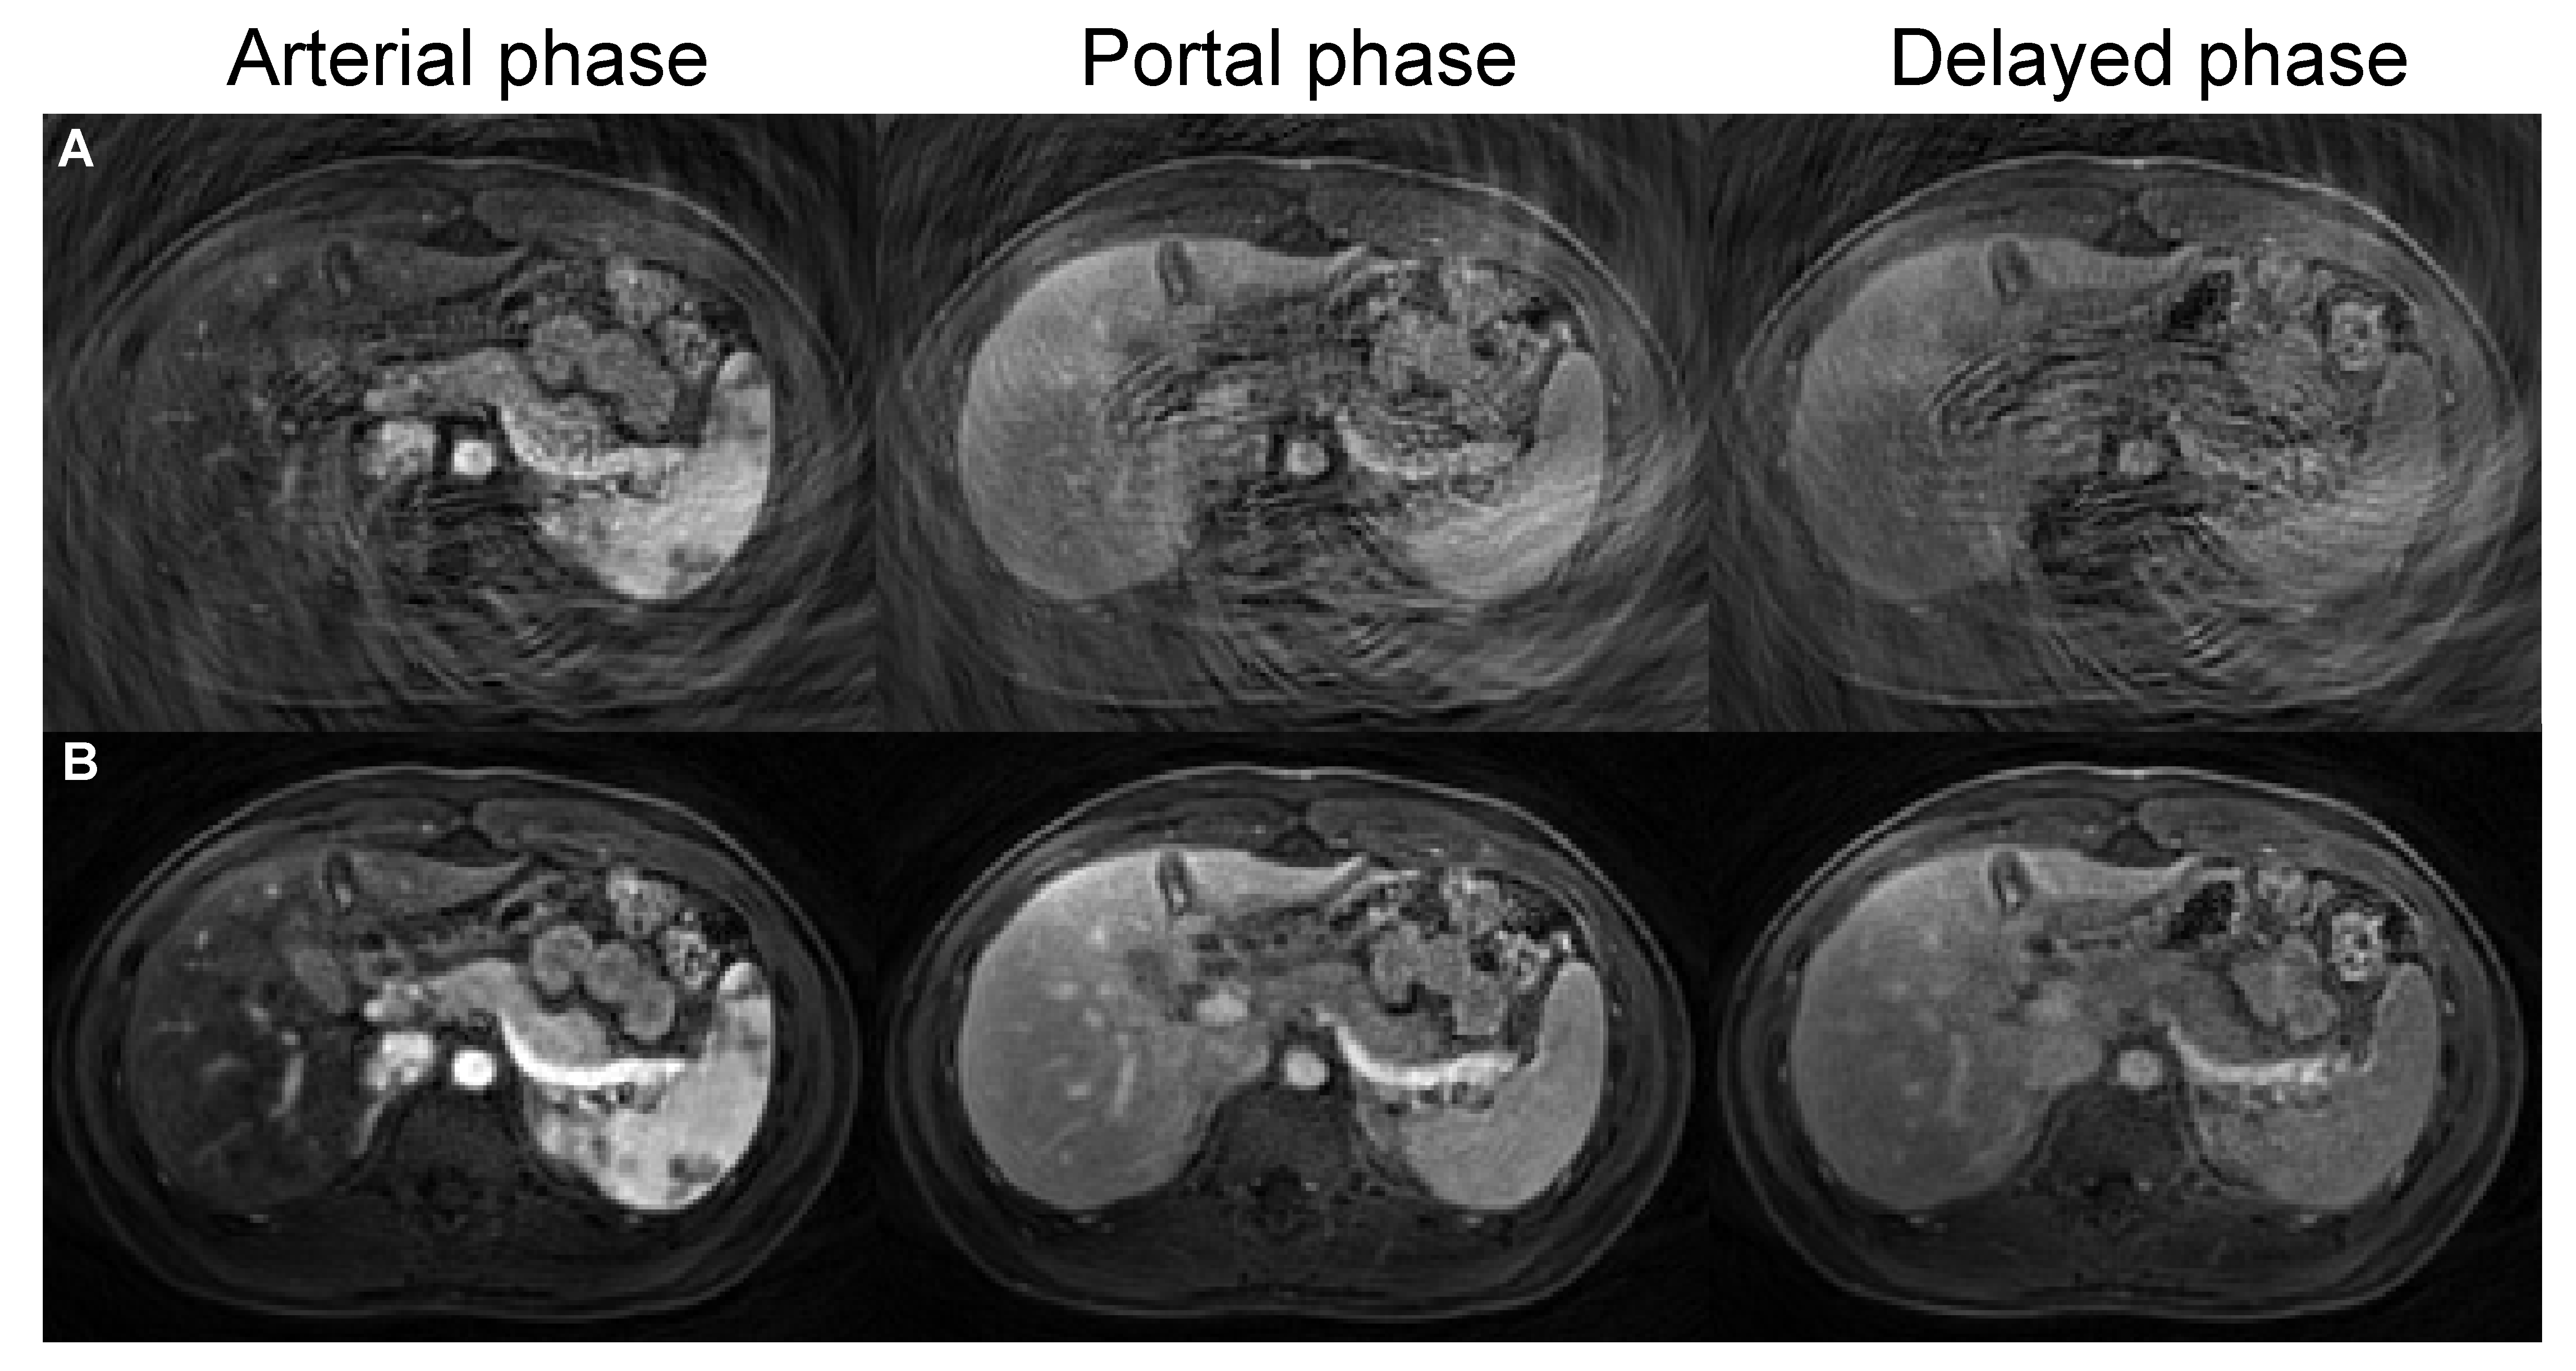
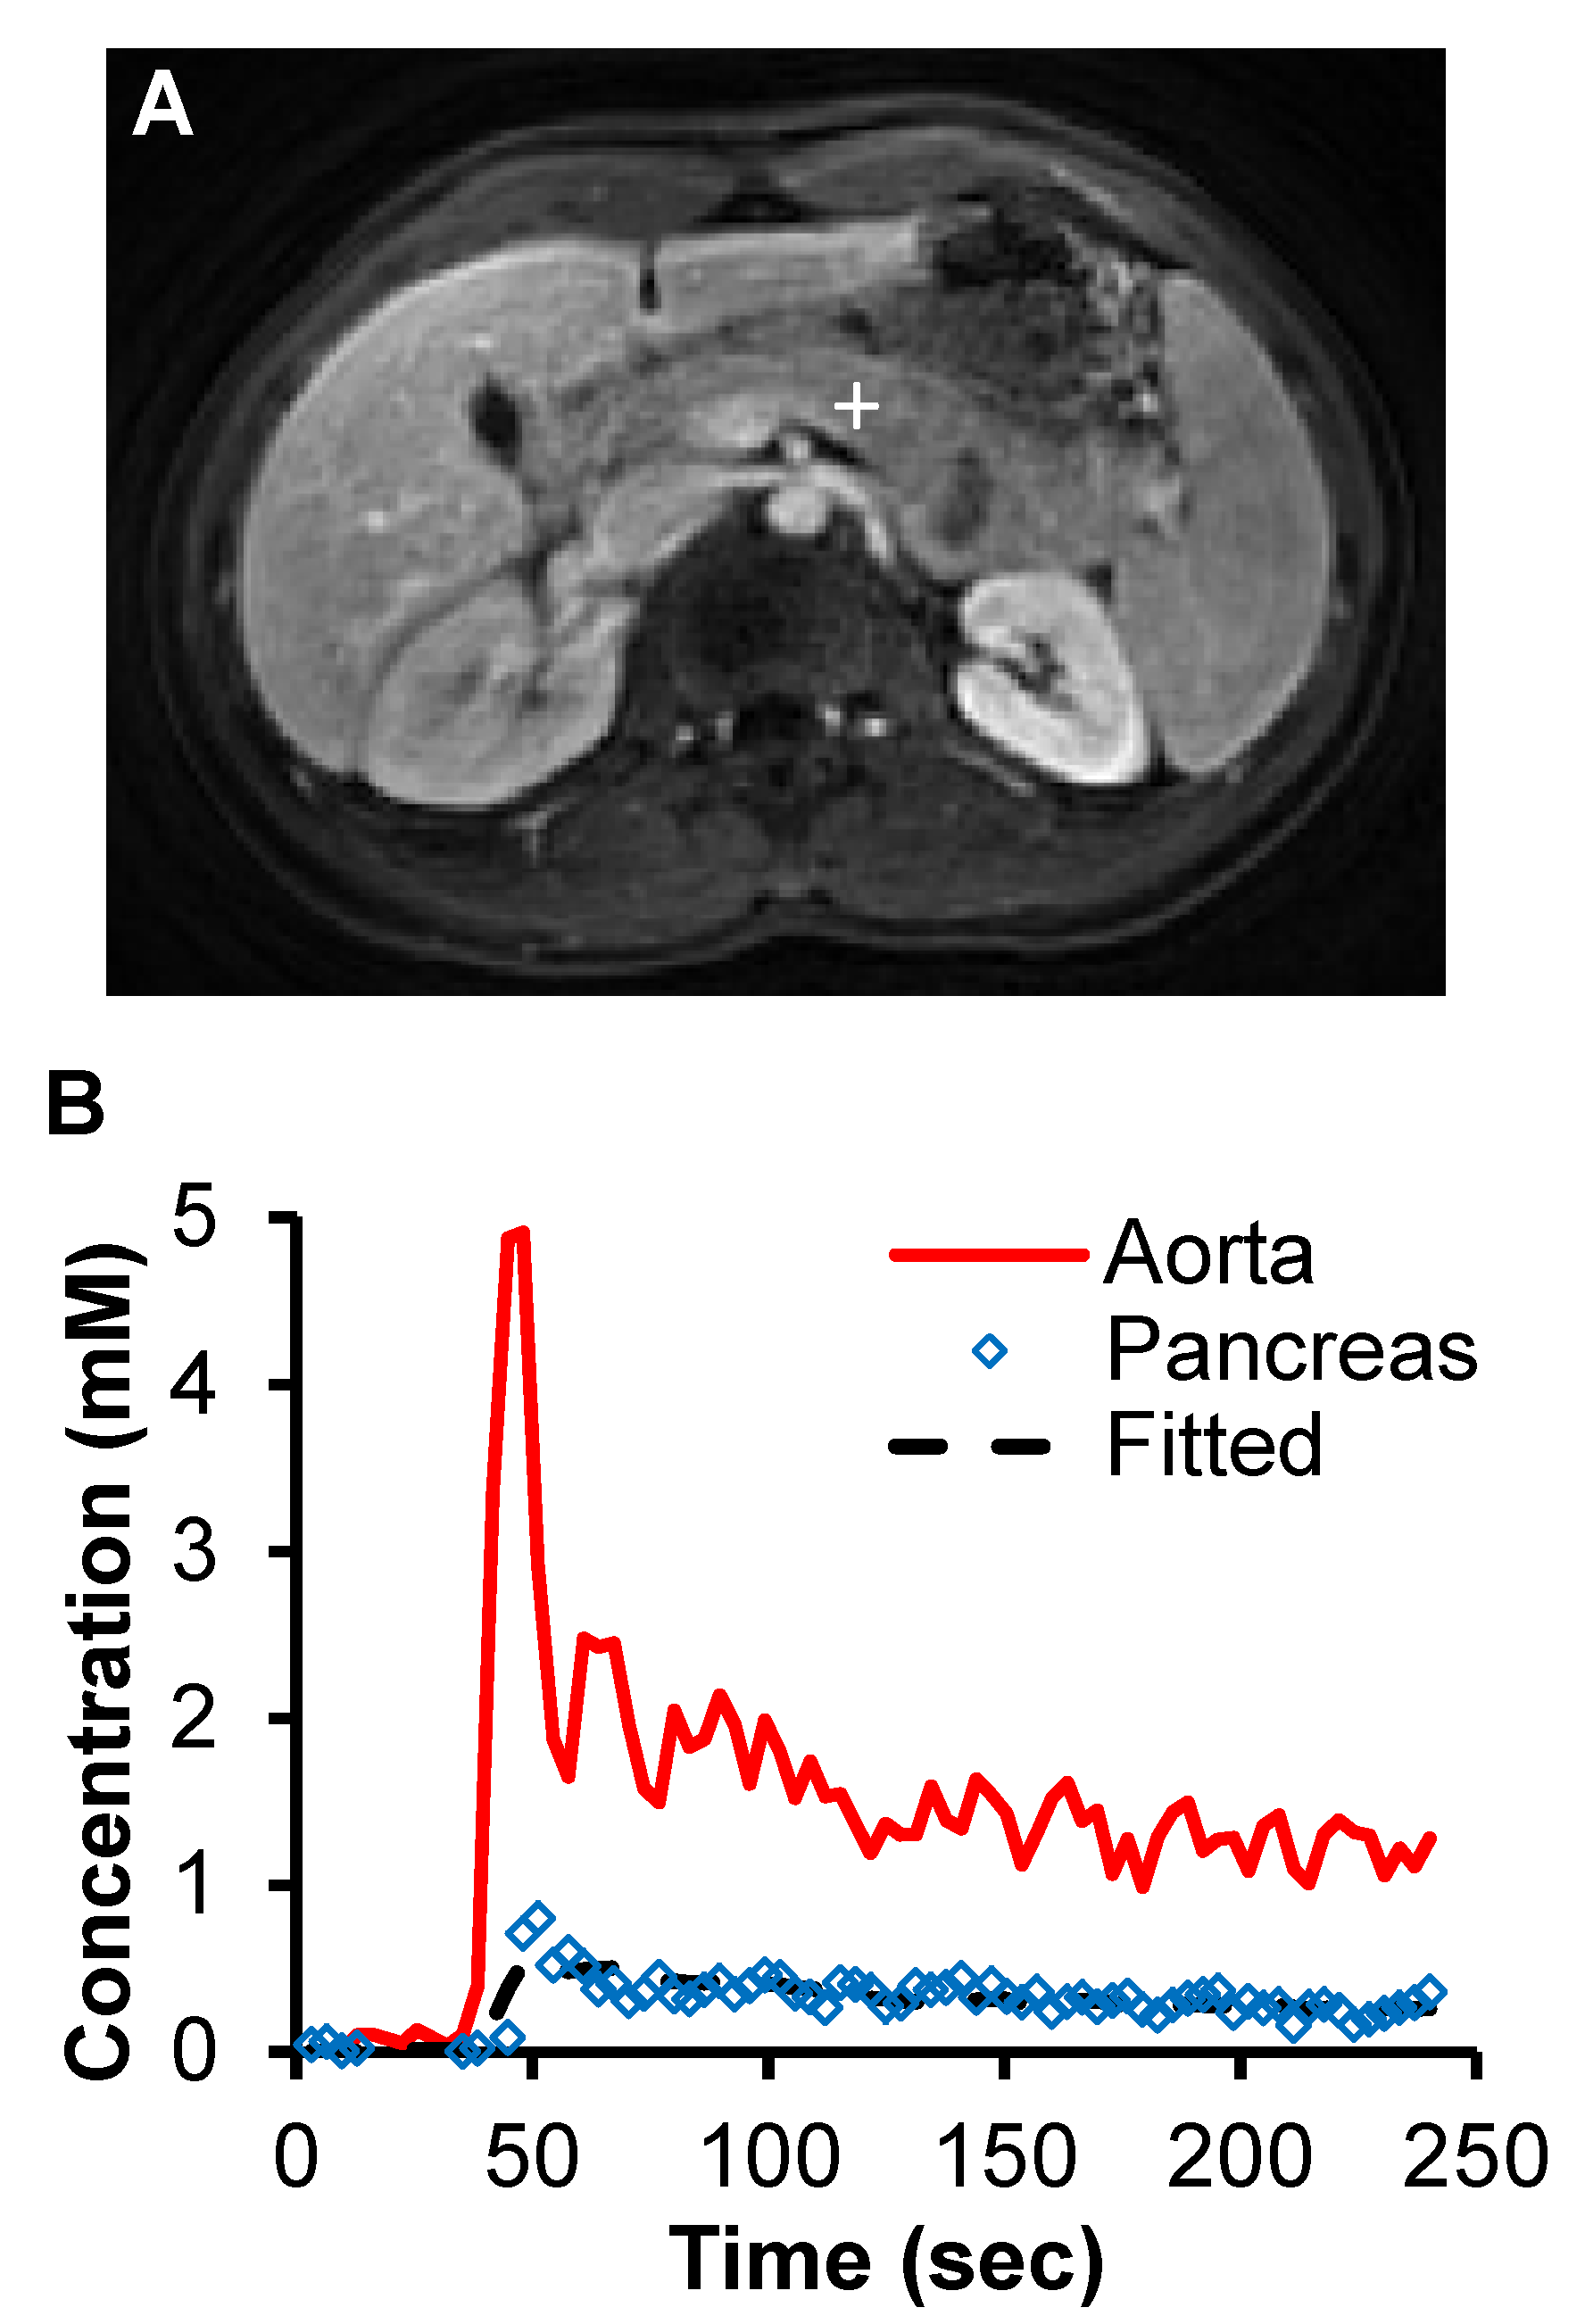
Fig. 1 shows representative zero-filled undersampled images and through-time spiral GRAPPA reconstructed pancreas images acquired at arterial, portal and delayed phases from a normal subject. After the spiral GRAPPA reconstruction, the aliasing artifacts due to undersampling were removed and subtle contrast dynamic changes in pancreas were captured with the high temporal resolution of 2 seconds/volume. Fig. 2 shows representative time courses of aorta and one voxel in the body of pancreas. The model fit to the pancreatic time course was also plotted and the fitting yielded a Ktrans, Kep, and Ve of 0.92/min, 6.1/min and 0.15, respectively.
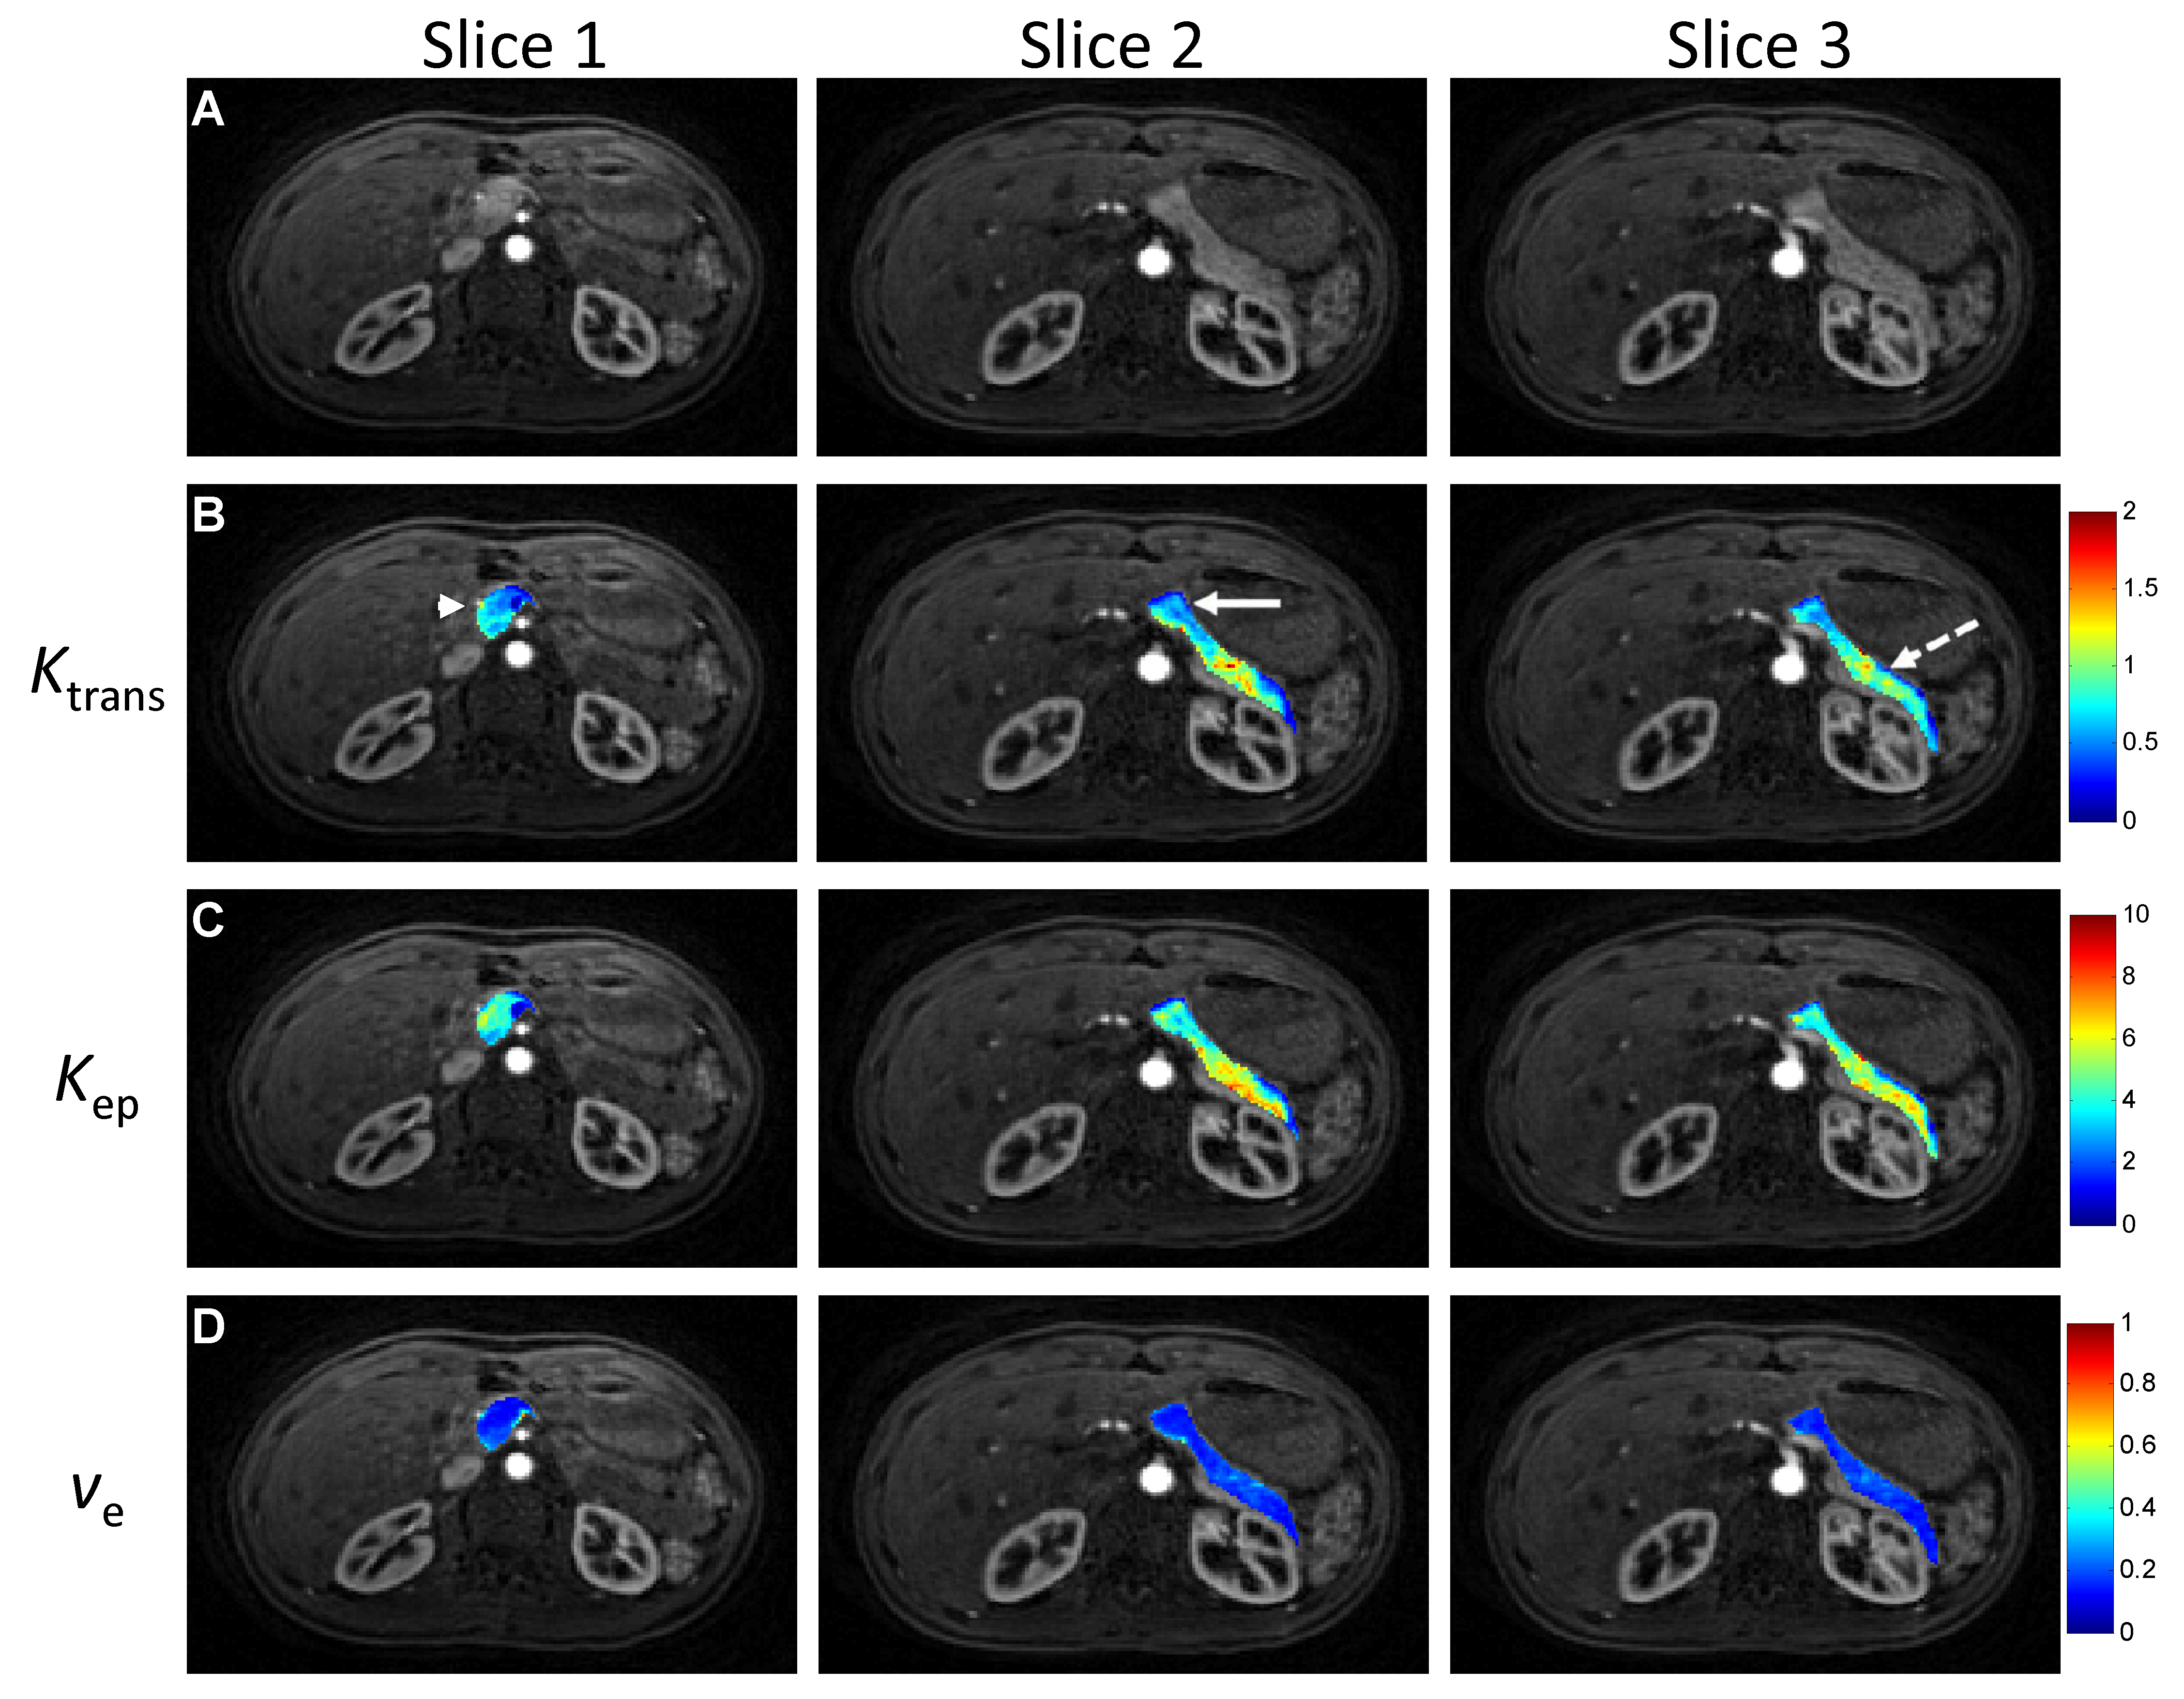
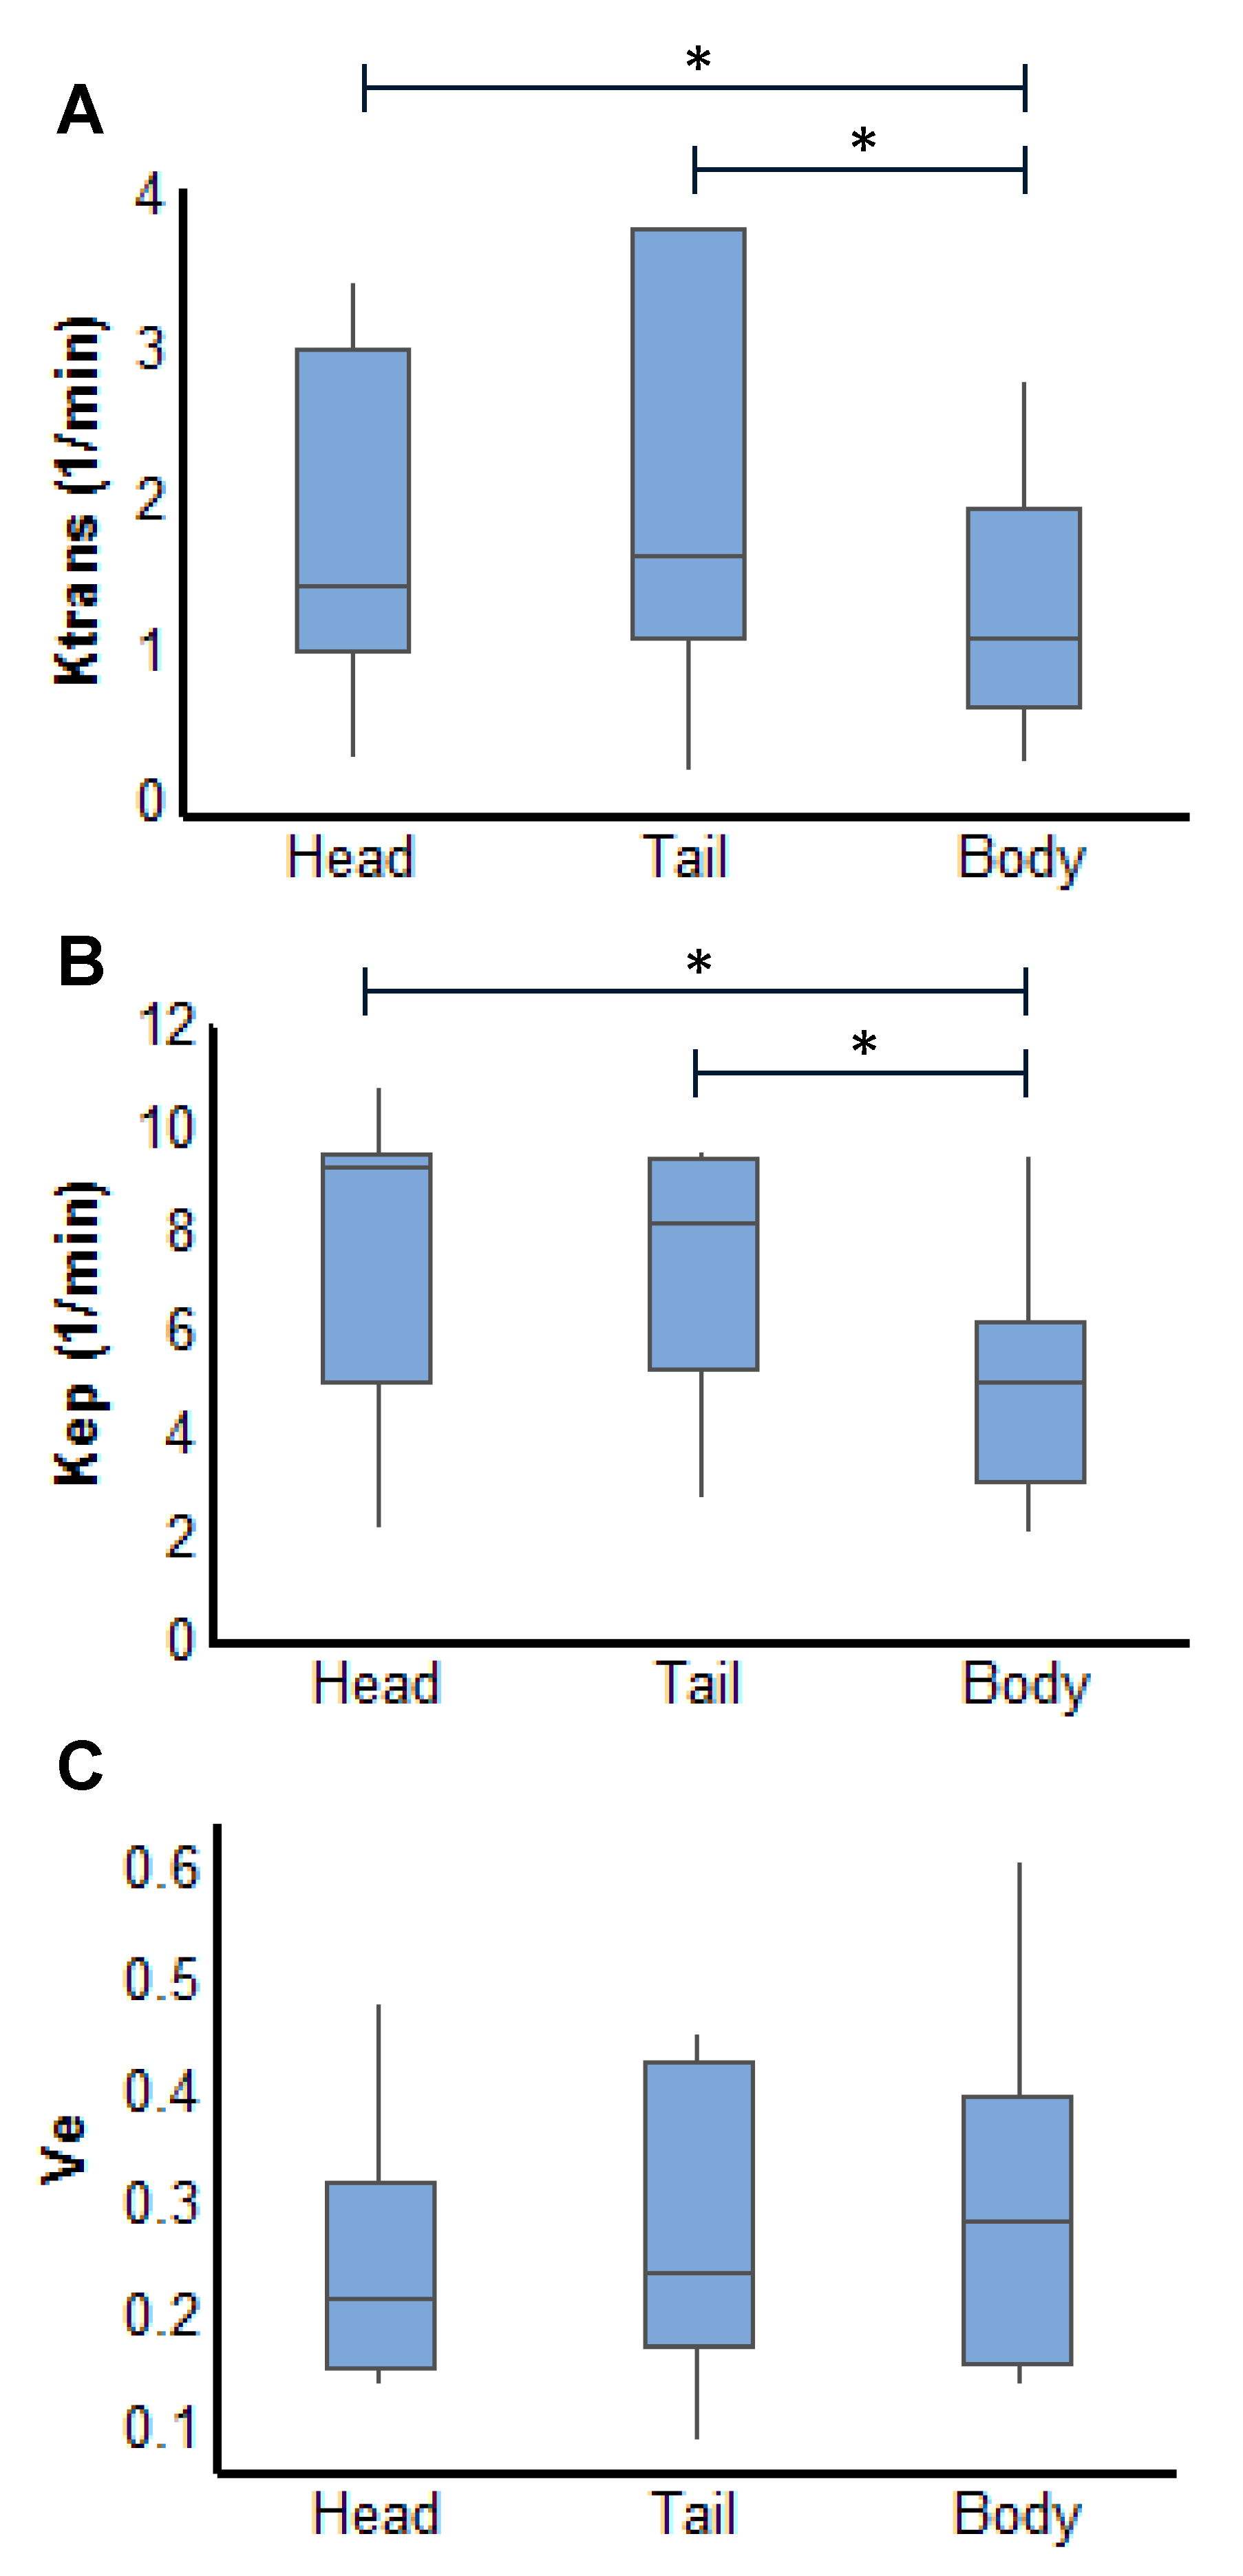
Fig. 3 shows representative perfusion maps for pancreas spanning three slices from the same subject. The summary of all the perfusion parameters obtained from 11 subjects is presented in Fig. 4. As shown in the figure, significant lower Ktrans and Kep in pancreatic body was noticed as compared to the values obtained from pancreatic head and tail (P < 0.05). No significant difference in Ve was observed between different locations in the organ.
Discussion and Conclusion
In the current study, free-breathing 3D whole pancreas perfusion quantification was achieved using a rapid non-Cartesian parallel imaging technique. The significant difference in the perfusion parameters between different locations in pancreas is likely due to the heterogeneity of blood supply to the organ (7). The pancreatic head is supplied by the the superior mesenteric artery, whereas body and the tail are supplied by the celiac axis. While this pilot study focused on the evaluation of using this fast imaging technique for pancreatic perfusion quantification, a systematic study is needed in the future to further evaluate the initial findings and interrogate the effect of administration of stimulants as secretin on pancreatic perfusion (7). In addition, the current imaging protocol with a 2-sec temporal resolution was designed to cover the whole liver parenchyma. In the future, it can be further optimized to cover just the pancreas to achieve improved spatial and temporal resolution for better characterization of pancreatic perfusion.Acknowledgements
Siemens Healthcare and NIH grants 1R01DK098503, R00EB011527, 1R01HL094557, and 2KL2TR000440.References
1. Akisik MF, et al. Radiol, 2010;256:441–449.
2. Kim JH, et al. Radiol, 2012;266:185-196.
3. Coenegrachts K, et al. JMRI, 2004;20:990–997.
4. Heverhagen JT, et al. Radiol. 2004 Oct;233:273-80.
5. Chen Y, et al. Invest Radiol, 2015;50:367-375.
6. Seiberlich N, et al. MRM, 2011;66:1682-1688.
7. Bali MA, et al. Radiol, 2008;247:115-21.
Figures