0322
Diffusion imaging detects differences in disease trajectory between two mouse models of pancreatic cancer1Radiology, NorthShore University HealthSystem, Evanston, IL, United States, 2NorthShore University HealthSystem, Evanston, IL, United States, 3Medicine, University of Illinois at Chicago
Synopsis
Multiparametric MR microimaging deteced differences in pancreatic microstructure between two mouse models of pancreatic cancer, EL-KRASG12D (EK) and p48-Cre/LSL-Kras (KC) mice, that overexpress mutant KRas via different mechanisms. MR signatures characteristic of acinar-ductal metaplasia, fibrosis, cystic neoplasms and precancerous lesions revealed different trajectories of disease development between the two genetically engineered mice.
Introduction
Pancreatic cancer (PC) remains a lethal malignancy, primarily due to the lack of early detection which results in late diagnosis and poor prognosis. Thus, a crucial need exists for better understanding of early changes in disease progression as well as the development of imaging technology that can visualize morphological and cellular changes in the pancreas during the early stages of PC. Nearly 90% of human PCs have a mutation in the Kras oncogene. Mice that are genetically modified to express mutant Kras develop lesions resembling those in human PC. The aim of our study is to compare the MR signatures of two well-known mouse models of PC using MR microscopy in order to understand how gene mutations that promote PC affect pancreatic microstructure over the entire organ. Using multiparametric high resolution MR imaging, we characterized pancreata from EL-KRAS (EK) [1] and p48-Cre/LSL-Kras (KC) mice [2] which target mutant KRAS to the pancreas via unique approaches.Experimental Methods
Formalin-fixed pancreata from EK and KC mice (3-4M, 8M, 12M; n=4) were examined using MR microscopy after rehydration. Images were acquired on a Bruker Avance 600MHz microimager using a 3D RARE8 pulse sequence with fat suppression. Imaging parameters were: TR 2500ms, RARE factor 8, effective TE 40ms, FOV 20mm x 16mm x 3.55mm, 320x256x100 matrix size, corresponding to a voxel size of 62μm x 62μm x 35μm. Images were analyzed using VolView (Kitware) to visualize the pancreatic architecture three-dimensionally. Mean diffusivity (Trace) was measured from diffusion-weighted images along the three gradient axes (TR/TE 2500ms/16.5ms; b = 1000s/mm2, δ=3ms, Δ=7ms, slice thickness 0.5mm, in-plane resolution 62µm x 62µm, 12-16 slices). T2 maps were acquired from the same slices used in diffusion imaging with a Hahn spin-echo sequence and 16 echoes (TR= 6000ms; minimum TE = 10ms). Mean diffusivity from Trace maps and T2 relaxation time were obtained for four major structures (acinar lobules, ducts, hyperintense lesions, and hypointense lesions) by manually selecting regions of interest. Two-sample t-tests assuming equal variance were run between the age groups to compare diffusivity and T2.Results and Discussion
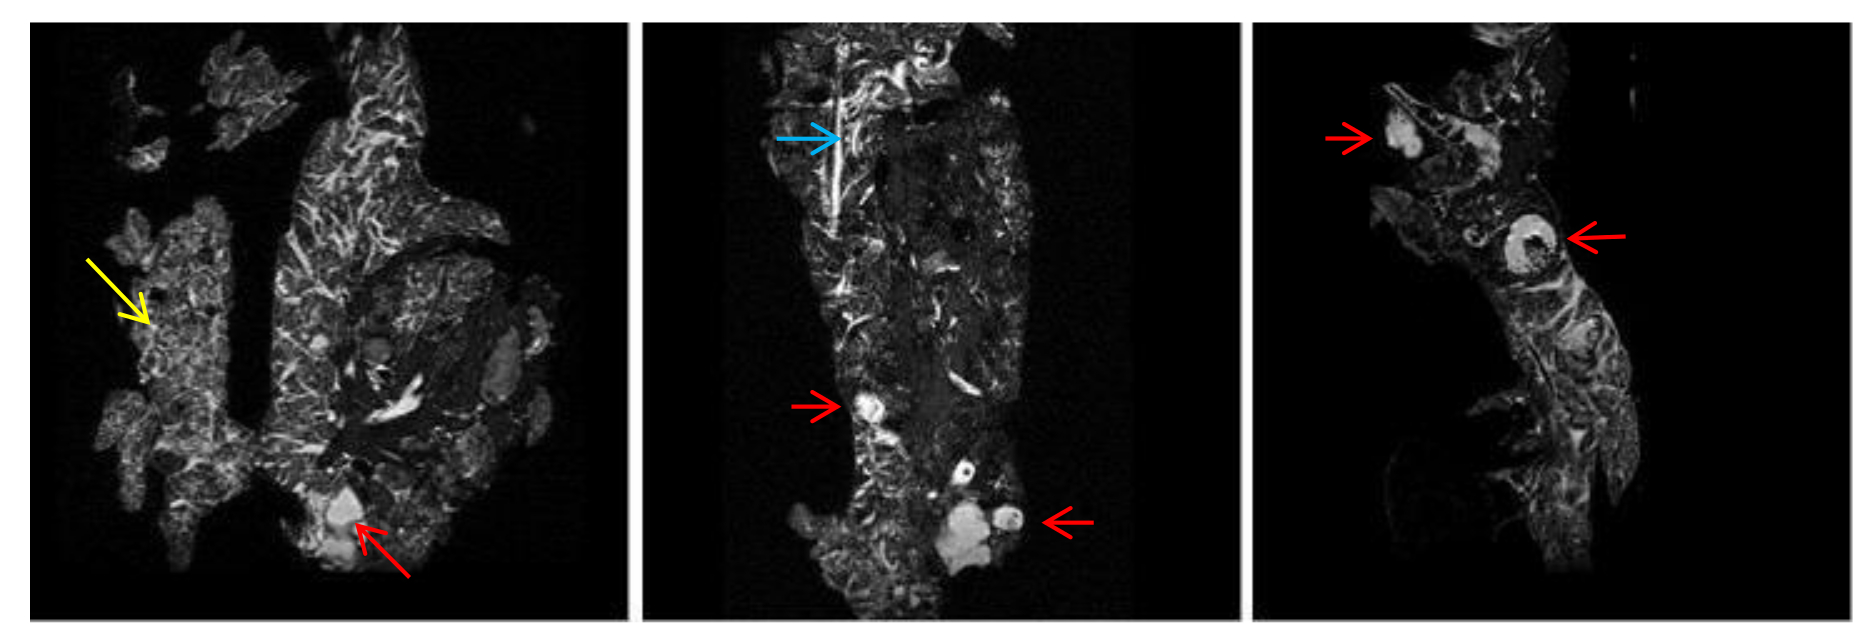
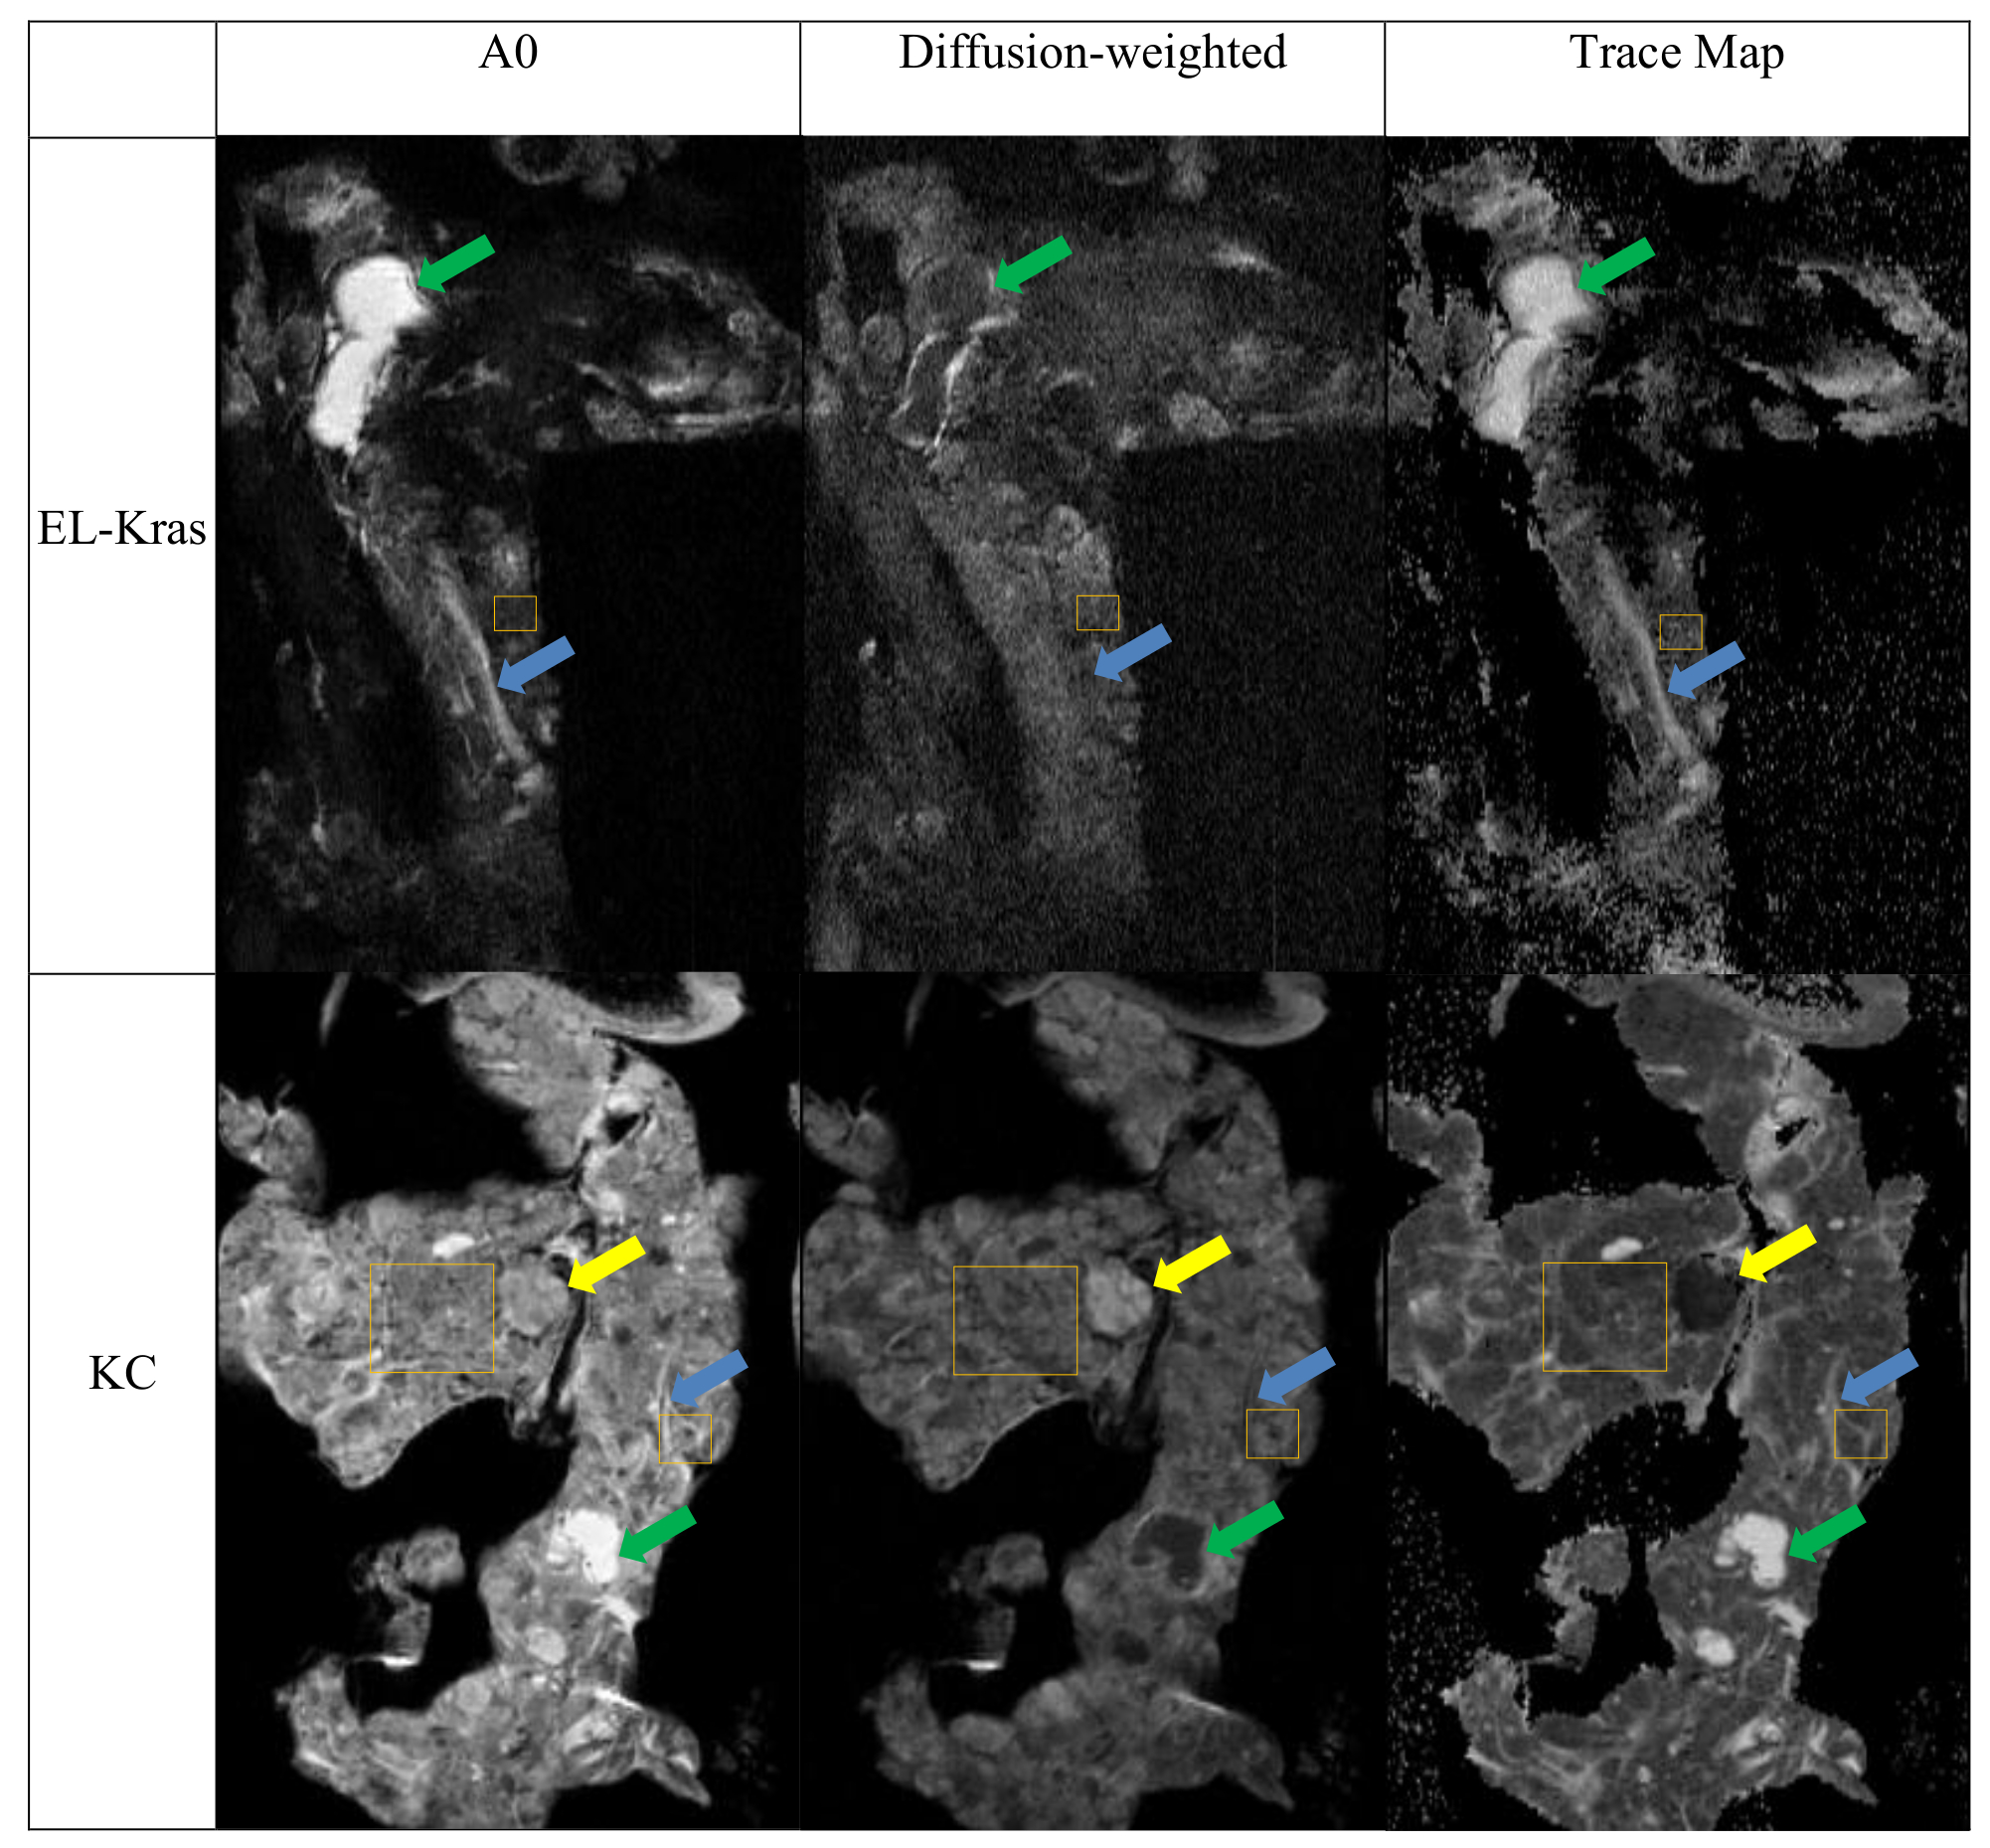
MR microimages reveal progressive changes in the pancreas of EK and KC mice that follow different trajectories with advancing age (Figures 1 & 2). EK mice begin to develop cystic lesions, which were identified as fluid-filled using diffusion imaging (Figure 3), in the splenic end of the pancreas at 4 months. These lesions spread to the body and duodenal end at 8 and 12 months. 3D volume rendering revealed that cystic lesions were located near pancreatic ducts. Acinar to ductal metaplasia (ADM) and cystic papillary neoplasms (CPN) which predominantly differentiate along the ductal cell lines are common in the exocrine pancreas of genetically engineered mouse models of PC.
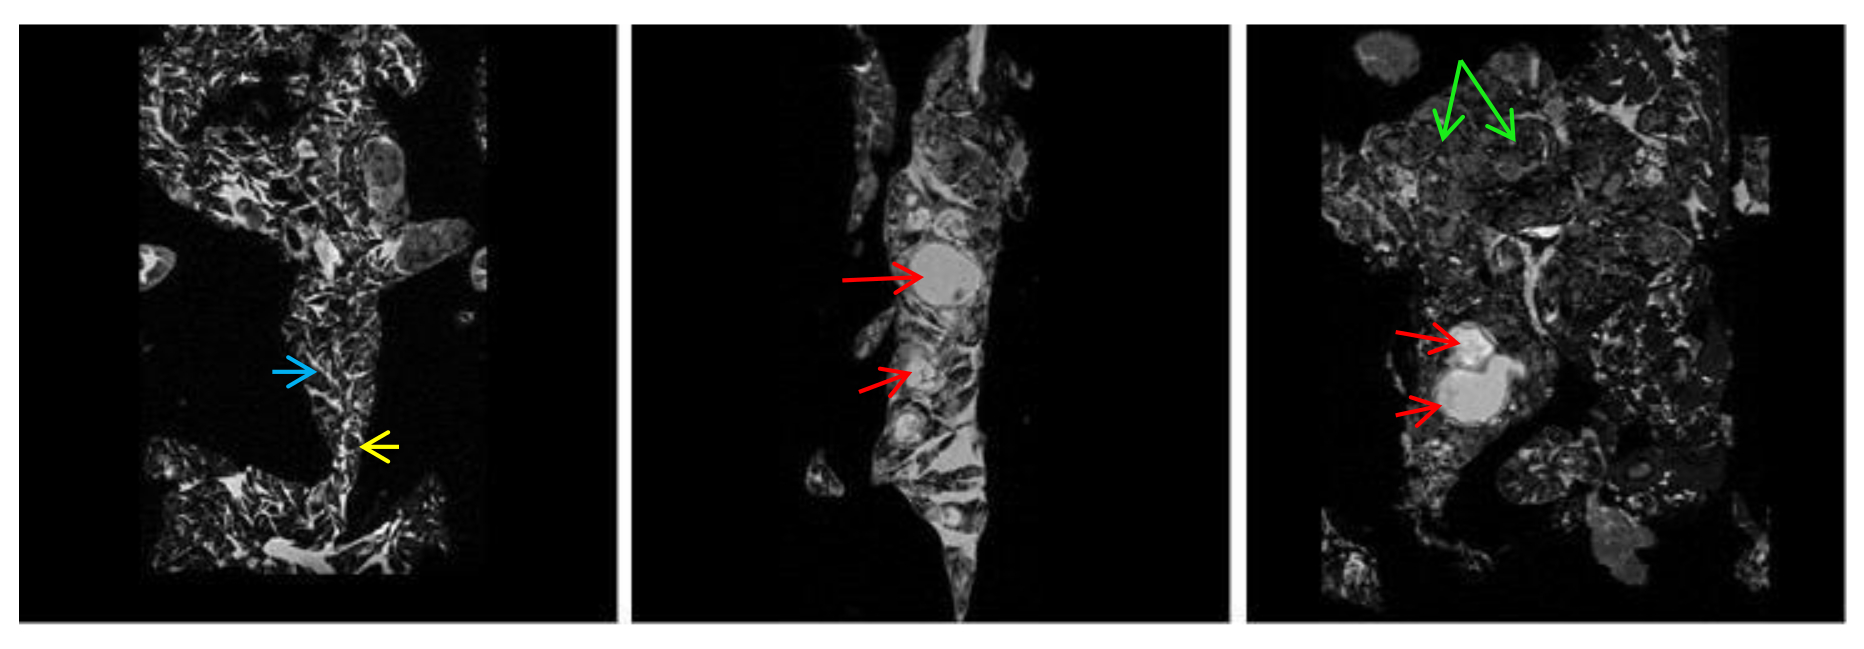
Cystic lesions of the ductal type begin to appear in KC mice only at 8 months but they are larger, more numerous and occur over the entire pancreas (Figure 2). In addition, only KC mice developed lesions of high cellularity which displayed little signal attenuation when diffusion gradients were applied (Figure 3). These hypercellular lesions resemble human intraductal papillary mucinous neoplasms (IPMN) associated with inflammatory and fibrotic changes.
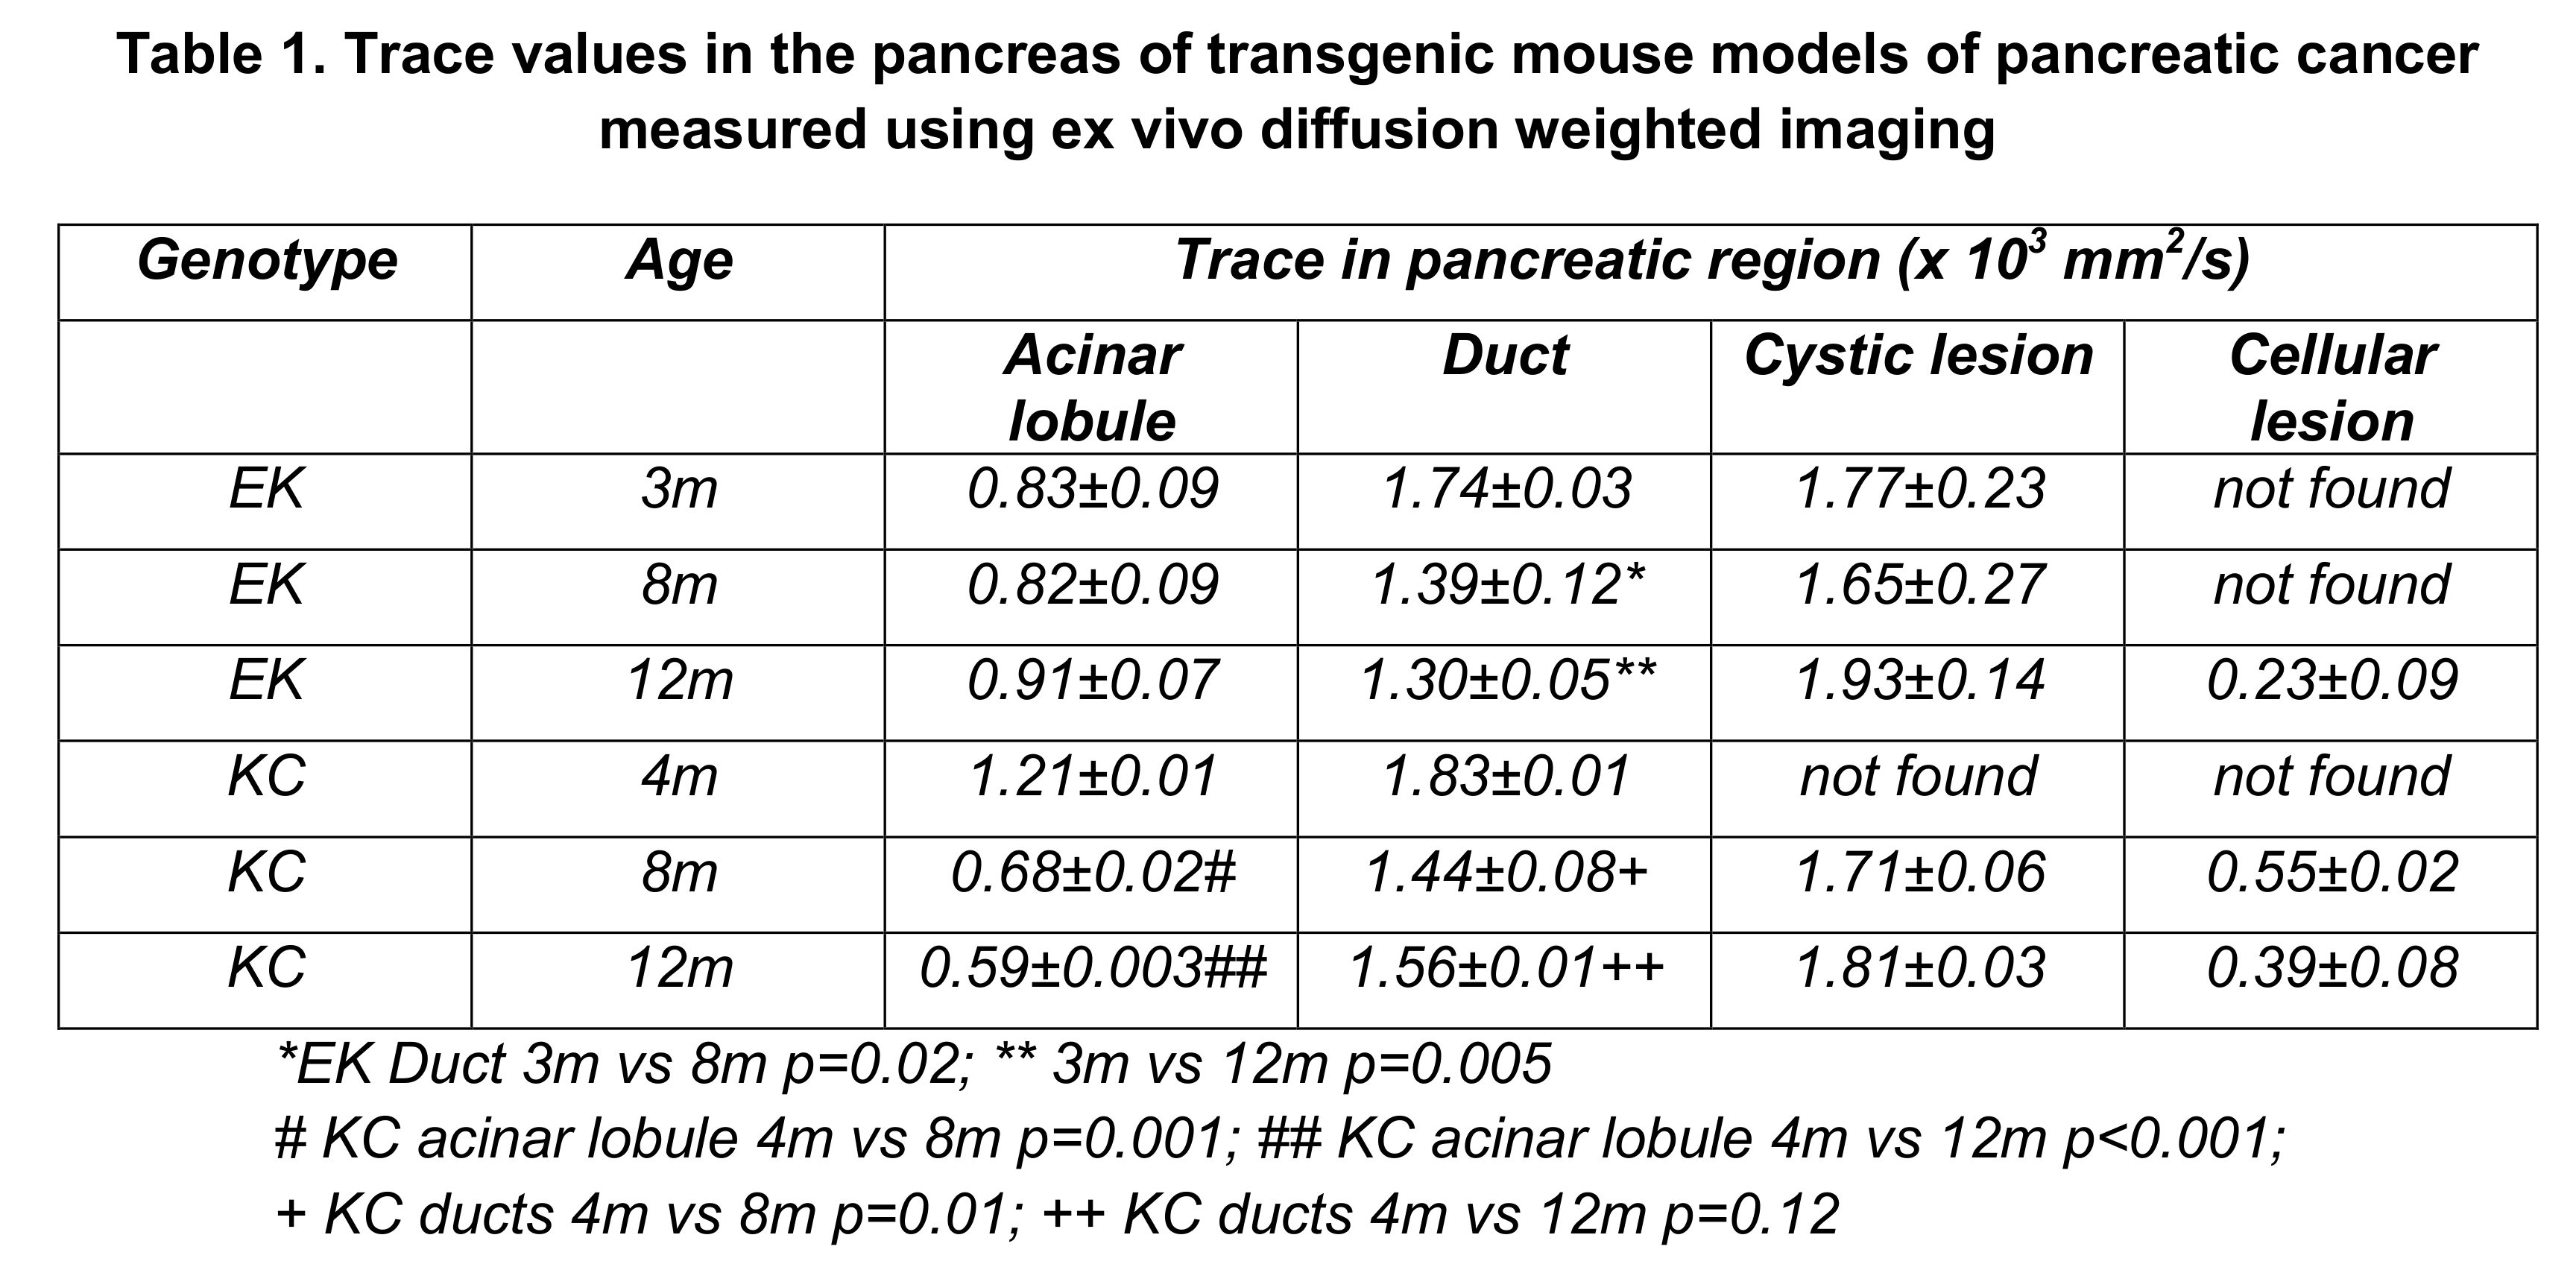
Trace in the acinar regions of normal pancreas in B6 mice is 1.17x10⁻³mm2/s whereas it is much lower in EK mice even at 3months (Table 1). The lower Trace in EK mice acinar regions is most likely associated with mutant Kras-related cellular changes such as elevated fibrosis. These changes did not progress further in EK mice. In contrast, KC mouse acinar region showed normal Trace at 4months but progressively lower diffusivity at 8 and 12 months. The observed acinar diffusivity differences between EK and KC mice indicate that pathological changes begin later in KC mice compared to EK mice, but advance to greater severity. Trace of ductal fluid showed significant changes with age in both genotypes. Cystic lesions had high diffusivity and cellular, hypointense lesions had very low diffusivity.
T2 relaxation times of acinar regions further confirmed the different trajectories of pathology in EK and KC mice. T2 progressively declined in acinar cells of KC mice (4M:45.50ms, 8M:40.19ms, 12M:29.80ms), most likely reflecting increasing fibrosis and mucin production in older KC mice (verified histologically by trichrome and AB/PAS stains, respectively). On the other hand, no age related alteration in T2 was detected in EK mouse parenchyma (40.50-41.43ms).
In summary, MR microimaging captured tissue alterations in the pancreas of EK and KC mice which indicate different pathological trajectories beginning with disease onset. Microstructural features of the exocrine pancreas, namely acinar cells, ducts, cystic lesions and hypercellular lesions had characteristic MR signatures.
Acknowledgements
This work was supported in part by R01 CA161283 (PJG).References
1. Grippo PJ, Nowlin PS, Demeure MJ, Longnecker DS, Sandgren EP. Preinvasive pancreatic neoplasia of ductal phenotype induced by acinar cell targeting of mutant Kras in transgenic mice. Cancer Res. 2003;63:2016-9.
2. Hingorani SR, Petricoin EF, Maitra A, Rajapakse V, King C, Jacobetz MA, Ross S, Conrads TP, Veenstra TD, Bitt BA, Kawaguhi Y, Johann D, Liotta LA, Crawford HC, Putt ME, Jacks T, Wright CV, Hruban RH, Lowy AM, Tuveson DA. Preinvasive and invasive ductal pancreatic cancer and its early detection in the mouse. Cancer Cell 2003;4:437-50.
Figures