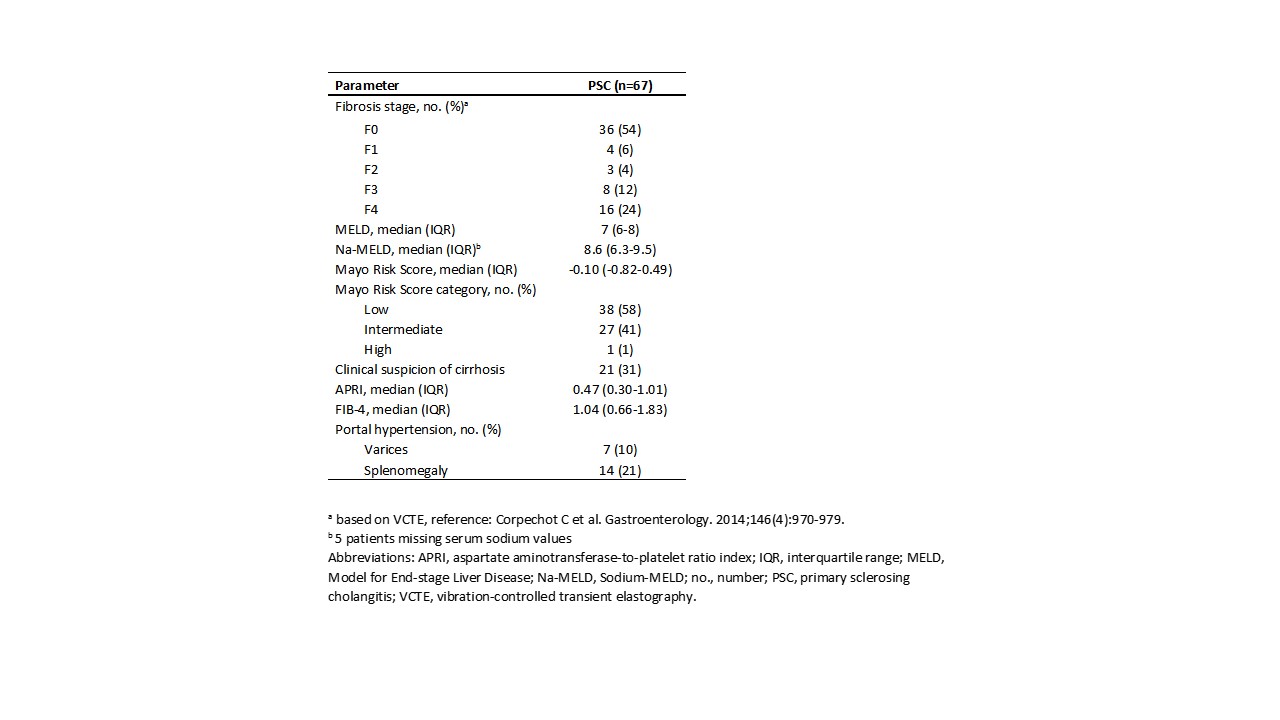
0321
The Development And Prognostication Of Magnetic Resonance Elastography Thresholds In Primary Sclerosing Cholangitis1UHN, University of Toronto, Toronto, ON, Canada
Synopsis
Primary sclerosing cholangitis (PSC) is a chronic, progressive, cholestatic liver disease which causes bile duct structuring and eventually causes liver cirrhosis requiring liver transplantation. Due to heterogeneity of liver fibrosis distribution and lack of optimal method to assess disease severity accurate disease stratification is challenging. Magnetic resonance elastography (MRE) has shown very good results for quantification of hepatic fibrosis. MRE may provide a unique means of stratification and prognostication in PSC with its ability to assess a larger volume of hepatic tissue compared to biopsy or transient elastography(VCTE) and this what we explored in this prospective study.
Background
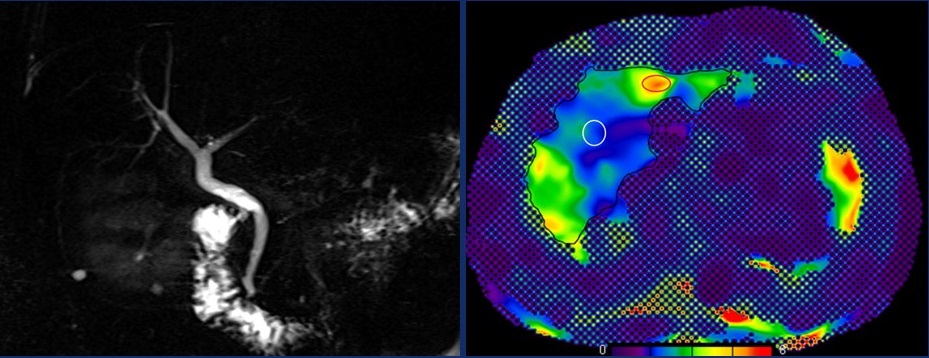
Primary sclerosing cholangitis (PSC) is a chronic, progressive, cholestatic liver disease with inherently challenging staging due to heterogeneous distribution of fibrosis and lack of methods[1,2] to accurately stratify patients across the disease spectrum. The Mayo risk score is used to prognosticate transplant-free survival but is reliable mostly for advanced disease[4]. Magnetic resonance elastography (MRE) is a promising technique for quantification of hepatic fibrosis[4,5]. MRE may provide a unique means of stratification (Fig.1)and prognostication with its ability to assess a larger volume of hepatic tissue compared to biopsy or transient elastography(VCTE)[6]Purpose
1) Develop and internally validate optimal MRE cut-off values for early and advanced fibrosis in PSC by comparing three measures of MRE stiffness against non-invasive tests for fibrosis. 2) Determine the prognostic value of MRE as defined by the Mayo Risk score.Methods
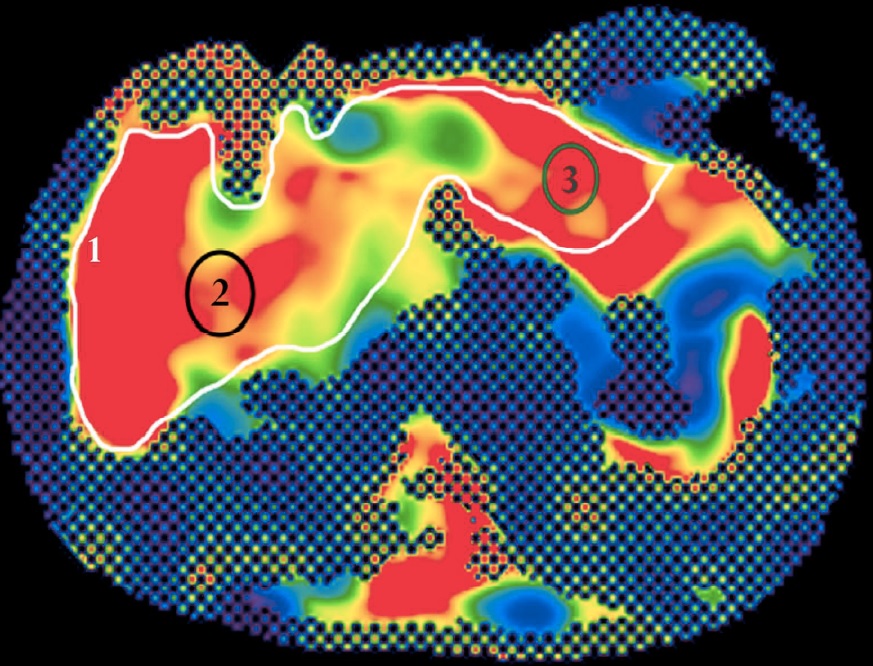
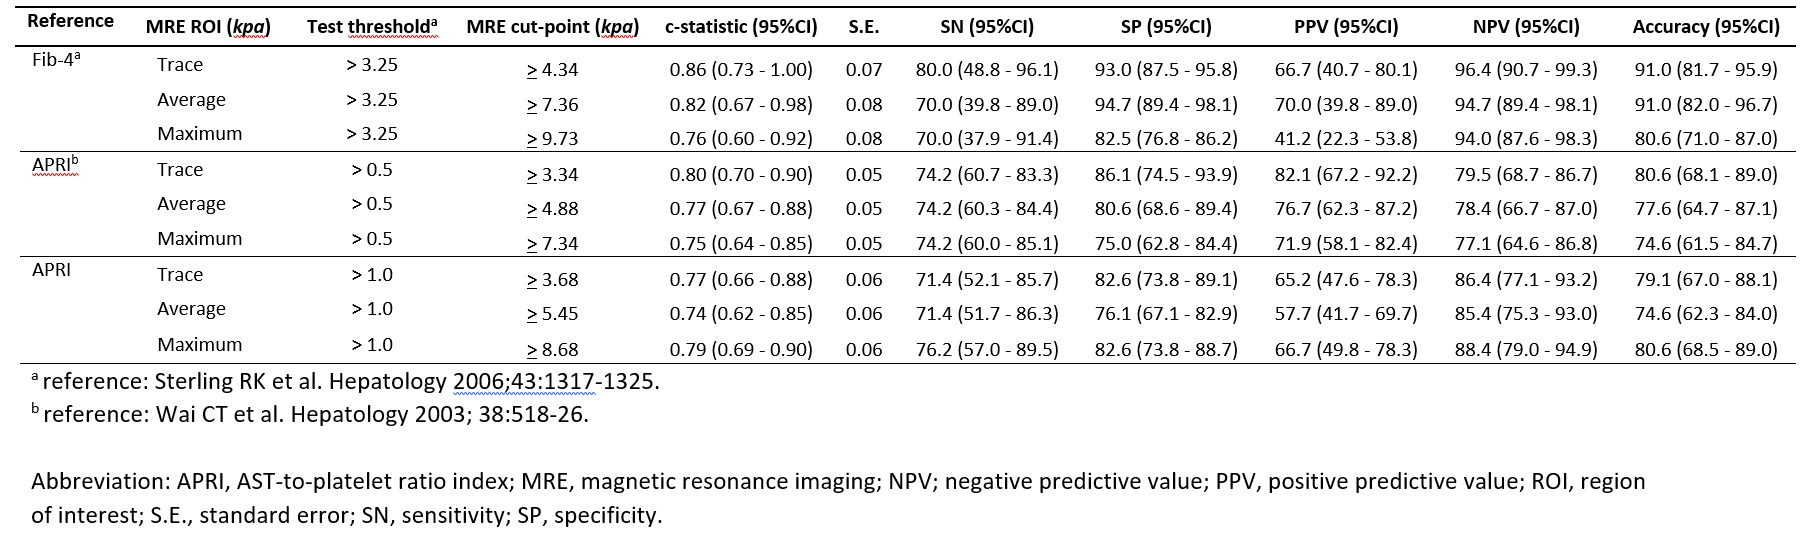
A prospective cohort of patients with PSC were enrolled to undergo MRE and VCTE. All clinical MRI/MRE examinations were done on the same 1.5T MRI unit (Siemens Avantofit, Siemens Healthcare, Erlangen, Germany). MRE shear wave(60Hz) propagation through the liver was imaged with a multislice breath-hold 2D GRE MRE sequence (TR/TE=50/23ms; flip angle 25°, bandwidth 260 Hz/Px, matrix 128×128, acceleration factor - 2, FOV=40 cm with acquisition time of 22s per slice). 4-5 10mm slices were obtained through the mid two-thirds of the liver. Quantitative stiffness maps were generated automatically by software included in the MRE package MRE stiffness (kPa) was measured using three methods(Fig.2): Trace (freehand crossectional contouring), Average (mean of stiffness on random oval ROIs) and Maximum (targeted recording of ROI with highest stiffness value) utilizing post processing software(OsiriX). VCTE was performed on the same day of clinic or within three months of the MRE. Laboratory investigations collected within 12 months of the MRE, history of inflammatory bowel disease (IBD) and outcomes such as first decompensating event, liver-related death, transplant or wait-listing for transplant (both requiring Na-MELD >14). As biopsy is not standard of care, they were not protocolized for this study. The AST-to-platelet ratio index (APRI) and Fib-4 were calculated at baseline as part of non-invasive assessment of fibrosis and Mayo Risk scores, were calculated at baseline and at the end of follow-up as surrogate measures of outcome. Spearman’s correlation and c-statistics were produced comparing each ROI method with VCTE, APRI and Fib-4 to evaluate the optimal reference standard. Internal validation was performed using bootstrapping to assess the optimal cut-off value for early and advanced fibrosis. Univariable and multivariable linear regression were performed to determine independent predictors for MRE stiffness and Mayo Risk Score at end of follow-up.Results
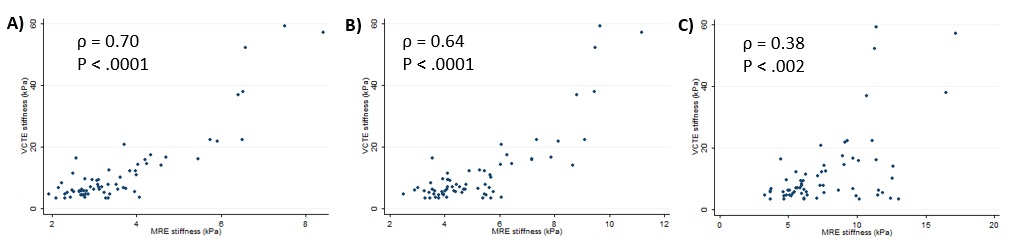
67 patients with PSC were prospectively imaged in the study. The surrogate indices of disease severity and fibrosis are shown in Fig.3. The Trace ROI method had the highest c-statistic, sensitivity and specificity, for most stages of fibrosis amongst the MRE stiffness calculation methods [F4: c-statistic 0.92 (95% confidence interval [CI] 0.83-1.00), sensitivity 87.5 (95%CI 66.0 - 96.8), specificity (96.1 (95%CI 89.6 – 99.0)], using VCTE as the reference standard (Fig.4). Using bootstrapping, cut-points for each stage of fibrosis was internally validated (Fig.5); many these values overlapped with the cut-points derived from the original AUROC.On multivariable analysis Linear regression demonstrated that measures of cholestasis (abnormal ALP and bilirubin) as well as portal hypertension are associated with higher MRE values. ALP twice the upper limit of normal [β 1.55 (95%CI 0.95 - 2.17)], abnormal bilirubin [β 1.27 (95%CI 0.41 – 2.14)] and thrombocytopenia [β 0.79 (95%CI 0.12 – 1.46)] were independent predictors of MRE stiffness using the Trace method. MRE stiffness was the strongest independent predictor of final Mayo risk score [β 0.44 (95%CI 0.27 – 0.61), P < .001].Discussion
Our study suggests that the Trace ROI method for calculating MRE stiffness has overall higher sensitivity, specificity, PPV, NPV and accuracy in differentiating between the different stages of fibrosis. This may be particularly true in PSC, which is considered a disease with diffusely heterogenous fibrosis using traditional histologic staging methods[3].MRE stiffness can be influenced by severity of cholestasis and portal hypertension, in a manner that is analogous to VCTE. Although it was not possible to correalte with long term outcomes such as transplantation,death, higher MRE stiffness values were correlated significantly with higher Mayo risk scores.Conclusion
Trace ROI method for evaluation of MRE stiffness had the greatest sensitivity and specificity for distinguishing early and advanced fibrosis using VCTE as the reference. MRE stiffness was an independent predictor of higher final Mayo risk score. MRE may be a valuable tool for long-term evaluation and non-invasive risk stratification.Acknowledgements
NoneReferences
1.Burak KW, Angulo P, Lindor KD. Is there a role for liver biopsy in primary sclerosing cholangitis? The American journal of gastroenterology 2003;98:1155-8.
2.Chapman R, Fevery J, Kalloo A, Nagorney DM, Boberg KM, Shneider B, et al. Diagnosis and management of primary sclerosing cholangitis. Hepatology 2010;51:660-78.
3.Kim WR, Therneau TM, Wiesner RH, Poterucha JJ, Benson JT, Malinchoc M, et al. A revised natural history model for primary sclerosing cholangitis. Mayo Clinic proceedings 2000;75:688-94.
4.Low G, Kruse SA, Lomas DJ. General review of magnetic resonance elastography. World journal of radiology 2016;8:59-72.
5. Venkatesh SK, Yin M, Ehman RL. Magnetic resonance elastography of liver: technique, analysis, and clinical applications. Journal of magnetic resonance imaging : JMRI 2013;37:544-55.
6.Sandrin L, Fourquet B, Hasquenoph JM, Yon S, Fournier C, Mal F, et al. Transient elastography: a new noninvasive method for assessment of hepatic fibrosis. Ultrasound in medicine & biology 2003;29:1705-13.
Figures