0318
Improved Characterization of Contrast Uptake in Human Pancreatic Cancer1Radiology and Biomedical Imaging, GE Healthcare and UCSF, Larkspur, CA, United States, 2Radiology and Biomedical Imaging, UCSF
Synopsis
We present an improved method for quantifying contrast agent uptake in highly desmoplastic pancreatic tumors in human patients. The new method separates the T1 and T2* effects of the Gadolinium-based contrast agent; uses fast acquisition and non-rigid registration to minimize motion effects; and two point Dixon imaging to separate the water component on a pixel by pixel basis.
Introduction
The highly desmoplastic nature of pancreatic tumors leads to slow uptake of both therapeutic and diagnostic agents. The assessment of contrast agent uptake and extracellular volume fraction may provide a quantitative measurement of tumor desmoplasia in pancreatic cancer. Gadolinium-based contrast agents produce both T1 and T2* effects, which can complicate the assessment of contrast agent uptake and extracellular volume fraction, particularly considering the effects of respiration and other involuntary motion on image quantitation from multiple acquisitions, as well as chemical shift effects due to the presence of both fat and water within the target field of view. The variable flip angle method inherently separates the effects of T1 and T2*. The use of fast two point Dixon volumetric imaging allows isolation of the water component in the presence of significant B0 inhomogeneities, and advanced non-rigid registration methods allow better quantitation of the T1 changes. Combining the axial acquisition of the target volume with a sagittal acquisition to measure the plasma concentration in the descending aorta allows characterization of the extracellular volume fraction. The acquisitions are fast and easily integrated into a more traditional contrast uptake protocol, as both acquisitions (pre-injection and equilibrium phase) take place outside the time-critical interval following injection, and the processing is well-suited to automation. We present here results on four subjects before and after treatment with a standard chemotherapeutic protocol.Methods
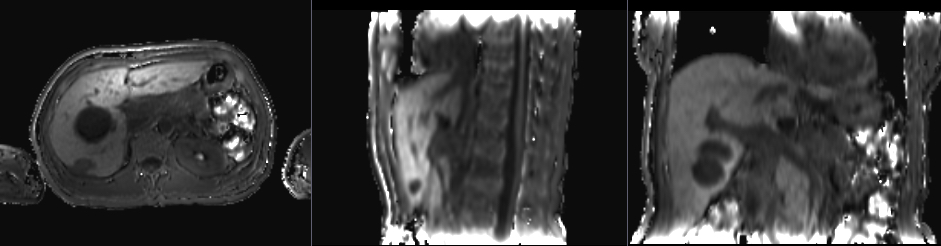
Patients were scanned on an MR-PET system (GE Healthcare, Waukesha WI USA) running software version MP24.1 with informed consent under a protocol approved by the UCSF Committee on Human Research. Fast dual echo 3D gradient echo (LAVA-FLEX) were acquired with 4 different flip angles (3, 6, 12, and 15 degrees) in both axial and sagittal orientations over the abdomen using the central matrix array with an embedded posterior array. The first echo time was 1.788 ms and the repetition time was 4.393 ms. Each volume was acquired on a 256x160x128 matrix with a 250 kHz bandwidth. The water component of each volume was generated by weighted subtraction of the two echoes and transferred offline for further processing. Two sets of 8 volumes were acquired, one before injection of Gadevist. Each volume was acquired in roughly 13 seconds, for a total additional scan time of less than two minutes before and two minutes after injection of Gadevist and acquisition of time course volumes.
Each of the 8 axial volumes was registered using a multistage (6, 12, and 27 DOF) registration to the 6 degree volume, the final stage employing local B splines, using slicer v4.6 (http://www.slicer.org) on a Macintosh computer (Apple, Cupertino CA USA). The sagittals were similarly registered to the 6 degree sagittal volume. The 6 degree volumes were then individually bias corrected using the N4ITK algorithm and axial and sagittal masks were generated using binary thresholding, dilation, and erosion.
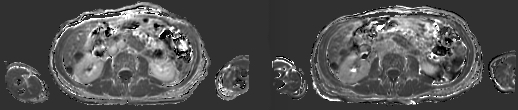
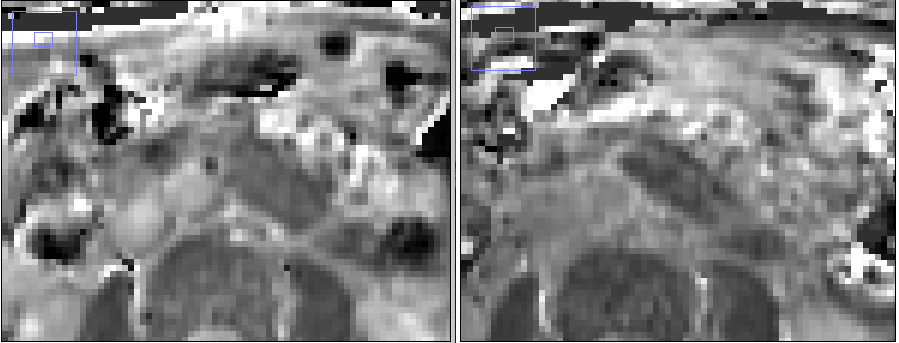
The different flip angles were then analyzed via the Variable Flip Angle method1,2,3, yielding maps of E1 from the slope of linear fit, and the product M0E2*(1-E1) from the intercept. R1 was derived from the log of E1 divided by the TR. The difference between the pre- and post-Gd volumes was then calculated pixel by pixel. From the sagittals, a region of interest was defined over the descending aorta far from the heart, and the blood R1 value was determined. ECVF was then calculated as $$$(1-Hct){\Delta R_{1,tiss}}\over{\Delta R_{1,blood}}$$$. The processing described here was implemented in python using a Jupyter notebook to allow archiving of the processing for each study.
Results and Conclusions
We acquired datasets from five patients to date, with additional post-treatment studies from two of the patients. Despite varying degrees of necrosis, the pancreas could still be appreciated in all the studies, and showed clear evidence of slow contrast agent uptake. The sagittal acquisitions in 6 of the studies provided reasonable values for the blood plasma concentration, but there is still some evidence of flow effects which can render this measurement somewhat unreliable.
The fast volumetric imaging methods demonstrated here proved quite robust and were well tolerated by all subjects studied. The consistency of the R1 maps across the liver and spleen also indicates the robustness of the registration approach. The registration itself converged quickly in all cases. The dual VFA method reduces the complexity in analyzing the contrast uptake effects, simplifying the determination of ECVF. Further improvements in fast R1 mapping, as well as gating the sagittal acquisitions, will allow more robust determination of the plasma concentration.
Acknowledgements
No acknowledgement found.References
1. Homer J and Beevers MS J Mag Res (1969) 63:2 1985 287-97
2. Fram EK, Herfkens RJ, Johnson GA et al. Mag Res Im 5 1987 201-208
3. Deoni, SCL, Rutt BK, and Peters TM Mag Res Med 49 2003 515-26
4. Flett AS, Hayward MP, Ashworth MT et al. Circulation 122 2010 138-44
5. Frydrychowicz A, Lubner MG, Brown JJ et al J Mag Res Im 35:3 2012 492-511
6. Varenika V, Fu Y, Maher JJ et al. Radiology 266:1 2013 151-8
Figures