0316
MRI Tracking and Quantitative Analyzing Natural Killer Cell Infusion for Hepatocellular Carcinoma Treatment in a Rodent Model1Department of Radiology, Tianjin Xiqing Hospital, Tianjin, People's Republic of China, 2Department of Radiology, Feinberg School of Medicine, Northwestern University, Chicago, IL, United States, 3Department of Radiology, Shanghai General Hospital, Shanghai Jiaotong University, Shanghai, People's Republic of China, 4Department of Liver Disease and Digestive Interventional Radiology, Xijing Hospital, Xi’an, United States, 5Department of Medicine, Division of Hematology/Oncology, Feinberg School of Medicine, Northwestern University, Chicago, IL, United States, 6Department of Radiology, Affiliated Third Hospital of Suzhou University, Changzhou, People's Republic of China, 7Robert H. Lurie Comprehensive Cancer Center
Synopsis
This paper presents the first evidence that transcatheter IHA NK cell local delivery for HCC adoptive transfer immunotherapy in a rat model.
We use a clinically feasible method by combining FDA-approved drugs heparin, protamine and ferumoxytol to compound HPF nanocomplexes for magnetic NK cell labeling so that their biodistribution can be visualized and quantized in vivo with MRI.
We demonstrated: a) transcatheter IHA NK cell infusion improved their homing efficacy to target tumors; b) quantitative analysis result of serial MRI monitoring of NK cell migrate to target tumors could serve as a key early biomarker for predicting longitudinal response.
PURPOSE
To verify the following hypotheses in a rat model of hepatocellular carcinoma: a) transcatheter intrahepatic arterial (IHA) natural killer (NK) cell infusion improves NK cell homing efficacy to target tumors and b) quantitative analysis result of serial MRI monitoring of NK cell migrate to target tumor could serve as a key early biomarker for predicting longitudinal response.METHODS
All studies were approved by our institutional animal care and use committee and were performed in accordance with the NIH guidelines.
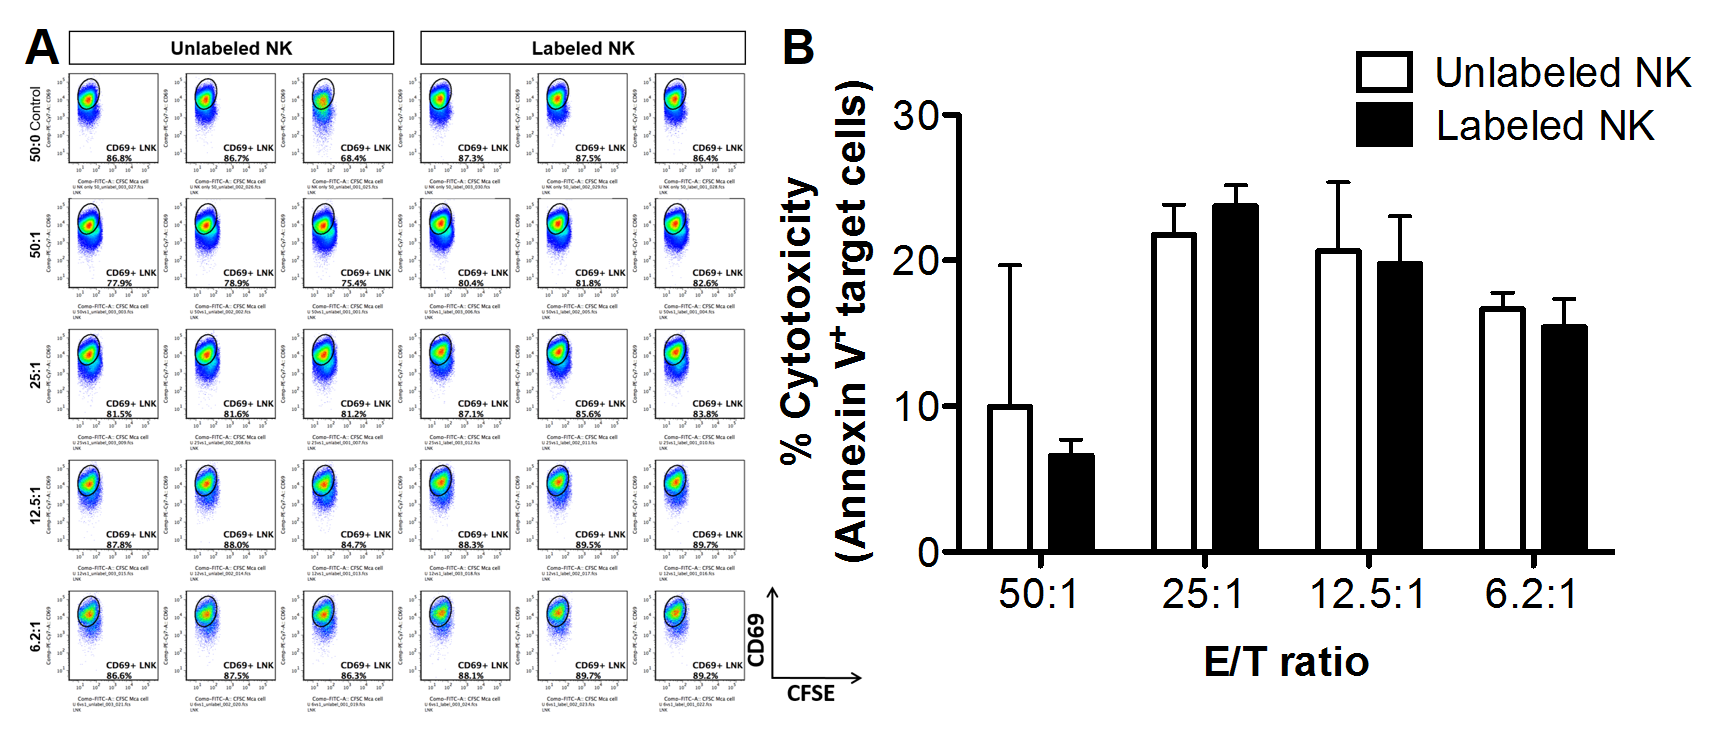
Heparin, Protamine and Ferumoxytol were used to form HPF nanocomplexes.1 Mouse NK (LNK cell line) cells2 were labeled with HPF nanocomplexes.1,3 HPF labeled and unlabeled LNK cells were co-cultured with carboxyfluorescein succinimidyl ester labeled McA-RH7777 cells to assess LNK cell cytotoxicity.
McA cells were visually implanted in left median and left lateral lobes in 18 SD rats. After 7 days, these rats were separated into three groups: transcatheter IHA LNK infusion group (IHA group), intravenous LNK infusion group (IV group) and transcatheter IHA saline infusion group (control group). The rat was anesthetized and mini-laparotomy was performed. A microcatheter was placed in common branch of proper hepatic artery.4 After selective catheterization in left hepatic artery, 4.0×10⁶ labeled LNK cells (IHA group) or 0.5mL PBS was infused (control group). IV group, 4×10⁶ labeled LNK cells was infused via tail vein.
In vivo tracking labeled LNK cell biodistribution in rat liver was performed using a 7.0T MRI scanner, before and after 24h, 48h and 8day. Anatomical images and T2*/R2* mapping was performed. Tumor mean R2* value was measured. Immediately after 8day post-infusion MRI, all rats were euthanized. Livers were harvested. Sections including tumor tissues were sliced for CD56 immunohistochemistry staining.4
Statistical calculations were performed using SAS 9.4. Student’s t-test and Pearson correlation coefficients were calculated. Statistical significance was defined as p˂0.05.
RESULTS
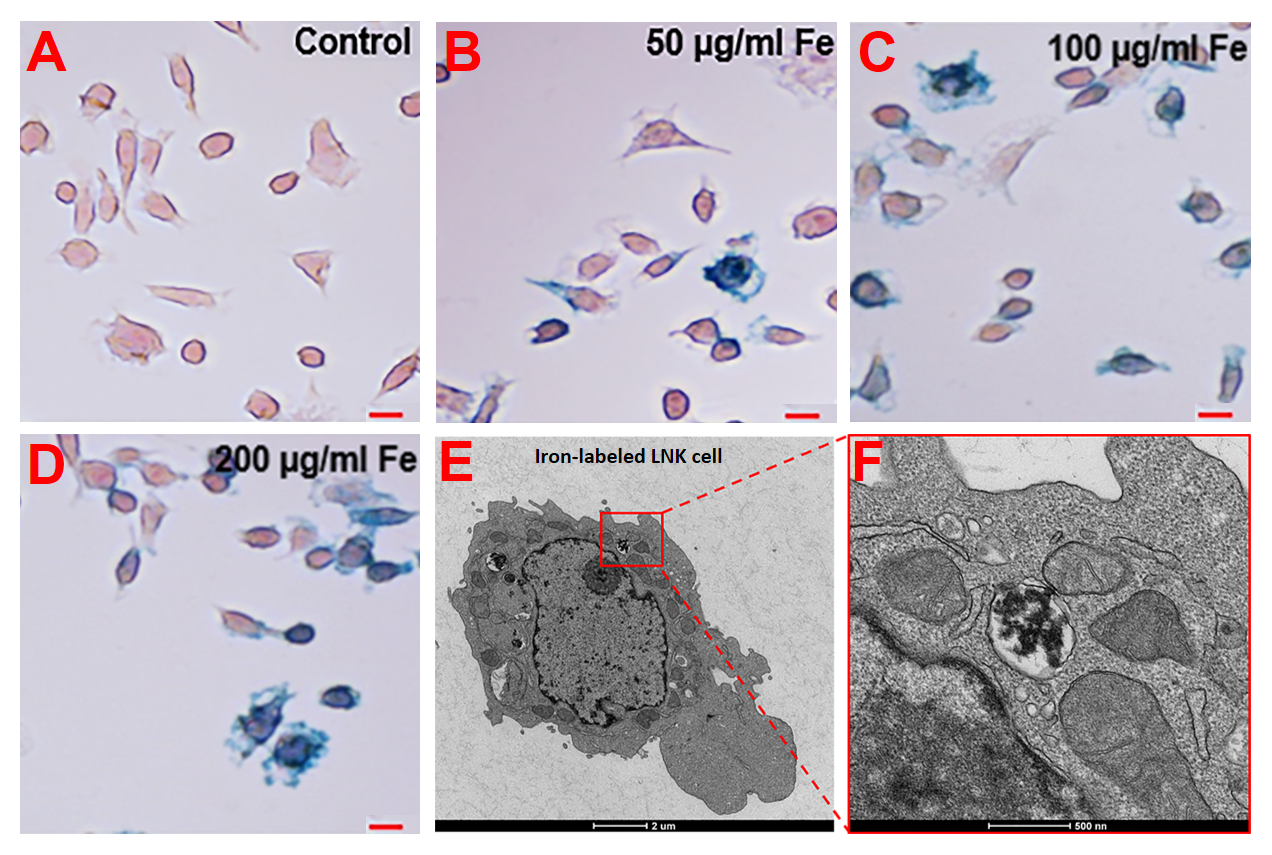
Prussian blue staining was performed to detect iron-positive HPF-labeled LNK cells (Figure 1A-D).5,6 TEM imaging were used to verify intracellular iron uptake (Figure 1E, 1F). There were no significant differences in cytotoxicity between labeled and unlabeled LNK cells (all p˃0.05) (Fig. 2B).
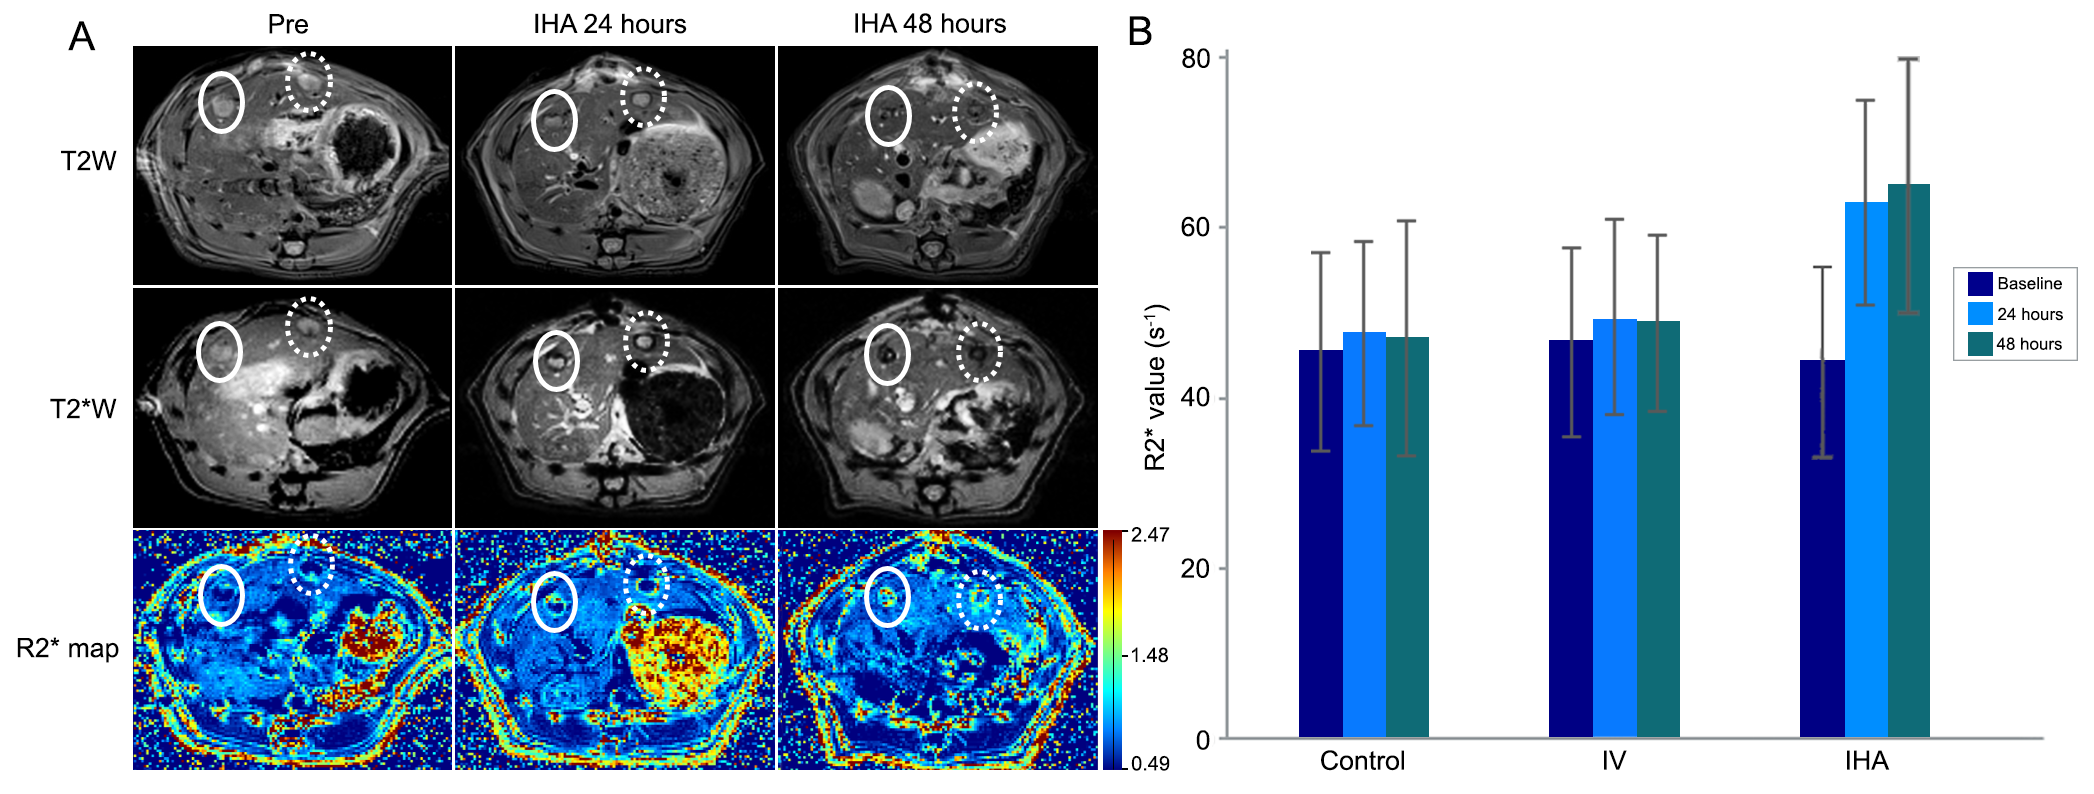
For IHA group, a significant difference in R2* values was found between before and 24/48h after infusion (baseline vs. 24h, p=0.0007; baseline vs. 48h, p=0.0010), but there was no significant difference in tumor R2* values between 24h and 48h (p=0.7335) (Fig. 3B). For IV group, there were no significant differences in R2* values between baseline and 24/48h, and between 24h and 48h (all p˃0.05). For control group, there were no significant differences of R2* values between baseline and 24/48h (all p˃0.05). Moreover, there were significant differences in tumor R2* values between IHA, IV, and control group at both 24h and 48h post-infusion time-points (all p˂0.05) (Fig. 3B).
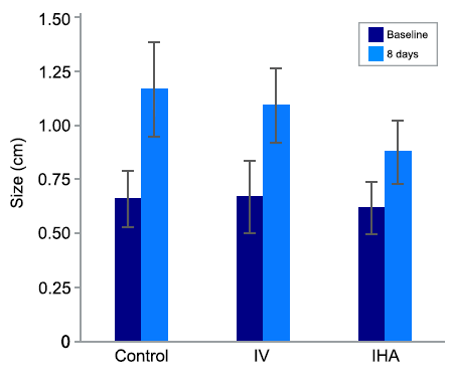
Post-infusion 8 days, there were significant differences in tumor size change between the IHA, IV, and control group (all p<0.05) (Fig. 4). Moreover, there was a strong correlation between tumor ∆R2* value and tumor growth inhibition in both IV and IHA group (IV group, R2=0.65; IHA group, R2=0.71).
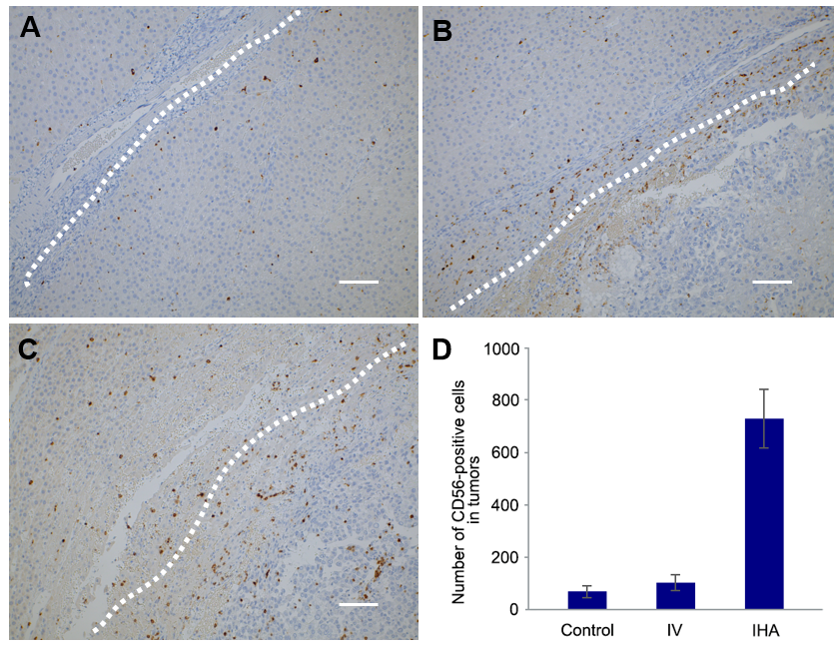
There were a significantly larger number of positive-stained LNK cells measured within tumors for IHA group than IV and control group (Fig. 5A-C). The quantitative measurements of CD56-positive LNK cells are shown in Fig. 5D.
DISCUSSION
Natural killer cell-based adoptive transfer immunotherapy (NK-ATI) is a promising approach for HCC treatment.7-10 However, conventional IV delivery method limit NK cells ultimately reach the target tumor.4 Because of hepatic arteries supply ~90% of blood flow to HCC,4 transcatheter IHA delivery may selectively infuse NK cells to target HCC lesions to improve therapeutic outcome.
In vivo noninvasive tracking of NK cell migration to tumors will be critical in predicting early therapeutic responses. We combined FDA-approved drugs to form HPF nanocomplexes for magnetic cell labeling so that HPF-labeled NK cells homing to the targeted tumor could be visualized by MRI.1,11 The quantitative MR images measurements (R2* values) permitted in vivo tracking of HPF-labeled NK cells for NK-ATI, which led to an increase in the tumor R2* values. This tumor R2* increase, measured on 24h of NK delivery, correlated strongly with therapeutic responses (tumor growth inhibition).
CONCLUSION
Clinically applicable HPF-labeled NK cells can be tracked with MRI in vivo. Transcatheter IHA NK infusion augment NK cell homing efficiency to liver tumors and tumor R2* value changes can serve as an important early biomarker for prediction therapeutic response.Acknowledgements
Parts of this work was supported by the grants R01CA196967 and R01CA209886 from the USA National Cancer Institute and funds from the National Natural Science Foundation of China (NSFC81420108020) the Center for Translational Imaging at Northwestern University.
References
1. Thu MS, Bryant LH, Coppola T, et al. Self-assembling nanocomplexes by combining ferumoxytol, heparin and protamine for cell tracking by magnetic resonance imaging. Nat Med. 2012;18(3):463-467.
2. Tsutsui H, Nakanishi K, Matsui K, et al. IFN-gamma-inducing factor up-regulates Fas ligand-mediated cytotoxic activity of murine natural killer cell clones. The Journal of Immunology. 1996;157(9):3967-3973.
3. Zhang Z, Li W, Procissi D, et al. Antigen-loaded dendritic cell migration: MR imaging in a pancreatic carcinoma model. Radiology. 2015;274(1):192-200.
4. Sheu AY, Zhang Z, Omary RA, Larson AC. MRI-monitored transcatheter intra-arterial delivery of SPIO-labeled natural killer cells to hepatocellular carcinoma: preclinical studies in a rodent model. Invest Radiol. 2013;48(6):492-499.
5. Li K, Gordon AC, Zheng L, et al. Clinically applicable magnetic-labeling of natural killer cells for MRI of transcatheter delivery to liver tumors: preclinical validation for clinical translation. Nanomedicine (Lond). 2015;10(11):1761-1774.
6. Zhang Z, Hancock B, Leen S, et al. Compatibility of superparamagnetic iron oxide nanoparticle labeling for (1)H MRI cell tracking with (3)(1)P MRS for bioenergetic measurements. NMR Biomed. 2010;23(10):1166-1172.
7. Leung W. Infusions of allogeneic natural killer cells as cancer therapy. Clin Cancer Res. 2014;20(13):3390-3400.
8. Ljunggren HG, Malmberg KJ. Prospects for the use of NK cells in immunotherapy of human cancer. Nat Rev Immunol. 2007;7(5):329-339.
9. Srivastava S, Lundqvist A, Childs RW. Natural killer cell immunotherapy for cancer: a new hope. Cytotherapy. 2008;10(8):775-783.
10. Sutlu T, Stellan B, Gilljam M, et al. Clinical-grade, large-scale, feeder-free expansion of highly active human natural killer cells for adoptive immunotherapy using an automated bioreactor. Cytotherapy. 2010;12(8):1044-1055.
11. Gutova M, Frank JA, D'Apuzzo M, et al. Magnetic resonance imaging tracking of ferumoxytol-labeled human neural stem cells: studies leading to clinical use. Stem Cells Transl Med. 2013;2(10):766-775.
Figures