0314
In vivo tracking of iron oxide labeled T-cells infiltrating preclinical tumor models1Biomedical Imaging, Genentech, South San Francisco, CA, United States, 2In vivo Pharmacology, Genentech, South San Francisco, CA, United States, 3Center for Advanced Light Microscopy, Genentech, South San Francisco, CA, United States, 4Pathology, Genentech, South San Francisco, CA, United States
Synopsis
The discovery of immune checkpoint pathways such as CTLA4 and PD1/PDL1, which control T-cell activation and activity, has fuelled interest in their modulation to achieve sustained anti-tumor immunity. This requires sufficient T-cell infiltration and activity in tumors. However, these processes are incompletely understood, in part due to the terminal nature of current analysis techniques. We therefore optimized labeling of activated T-cells with iron oxide nanoparticles, transferred labeled T-cells into tumor bearing hosts and performed serial MRI. Although, hypointense spots could be detected in the tumor rim following T-cell transfer, quantification is complicated by vascular abnormality induced susceptibility changes.
Purpose
To investigate the feasibility of longitudinal T-cell tracking in solid tumors following in vitro labeling with superparamagnetic iron oxide nanoparticles (SPIOs).Methods
Ovalbumin specific CD8+ T-cells were isolated from OTI splenocytes. T-cells were activated for 48h with CD3/CD28 beads (Dynabeads, Thermo Fisher Scientific) and expanded for 4 days. T-cells were incubated with different SPIOs (fluidMAG-D, fluidMAG-DX, fluidMAG-UC, fluiMAG-OS, Chemicell) for 24 hours. Following incubation, T-cells were washed 4 times with PBS, re-suspended in media for in vitro assays or in saline for in vivo injection. To assess labeling effects on cytotoxic function, labeled and control T-cells were added to MC38 ovalbumin (MC38-OVA) expressing adenocarcinoma cells (0.2:1, 0.8:1, 1.6:1, 4:1, 8:1, 16:1 25:1) for 6 hours followed by in-vitro viability measurements. In-vivo Imaging Studies: C57BL\6 mice (n=7) were inoculated with 5E5 EG7-OVA cells and NSG mice (n=7) with 1E5 MC38-OVA cells s.c. on the hind leg. Tumor volumes were monitored via ultrasound (Vevo2100, Visualsonics, MS550D, 40MHz). Once tumors had reached a volume > 100 mm3, baseline MRI was performed followed by i.v. infusion of 1E7 labeled T-cells or saline for control. Animals were imaged 1, 3, and 7 days after T-cell transfer using a 9.4T horizontal bore scanner (Agilent, Santa Clara, CA) with a 72 mm volume Tx and a 20 mm surface Rx coil (Agilent). Tumors were embedded in dental paste to reduce susceptibility artefacts from the tumor/air boundary. For multispectral analysis, T2 and ADC mapping were performed following a previously published protocol (1). For T2-mapping a spin-echo sequence was used: TR 3000ms, TE 8, 28, 48, 68 ms, NSA 1, while a fast spin-echo sequence was used for ADC: TR 3000 ms, effective TE 36 ms, ETL 4, maximum diffusion gradient 35 G/cm, δ/Δ 3.3/30 ms, 6 b-values (82, 196, 357, 566, 823, 1129) NSA 2. T2* mapping was performed using a multi-echo GE sequence; TR 900, TE 3, 7, 11, 15, 19, 23 ms, FA 64°, NSA 3.Results
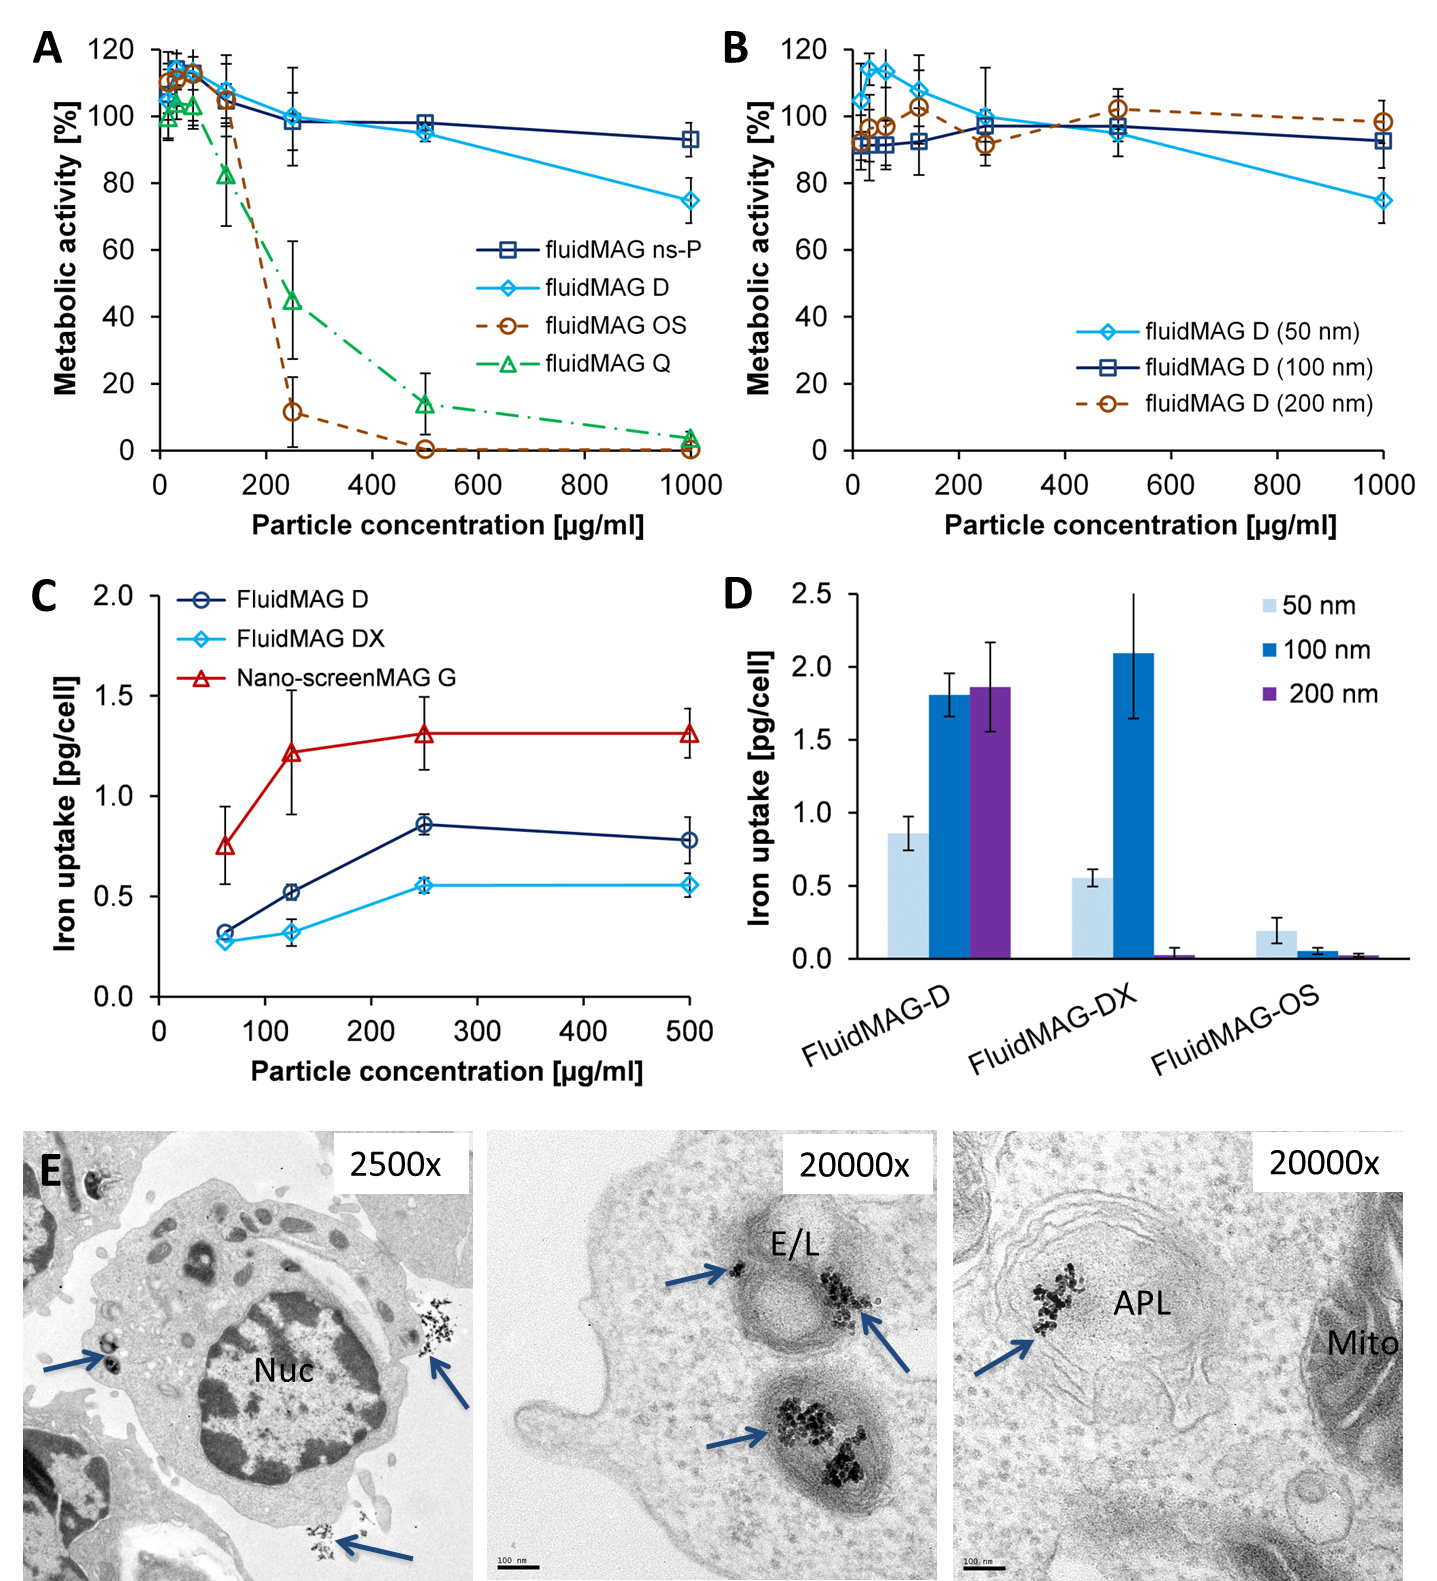
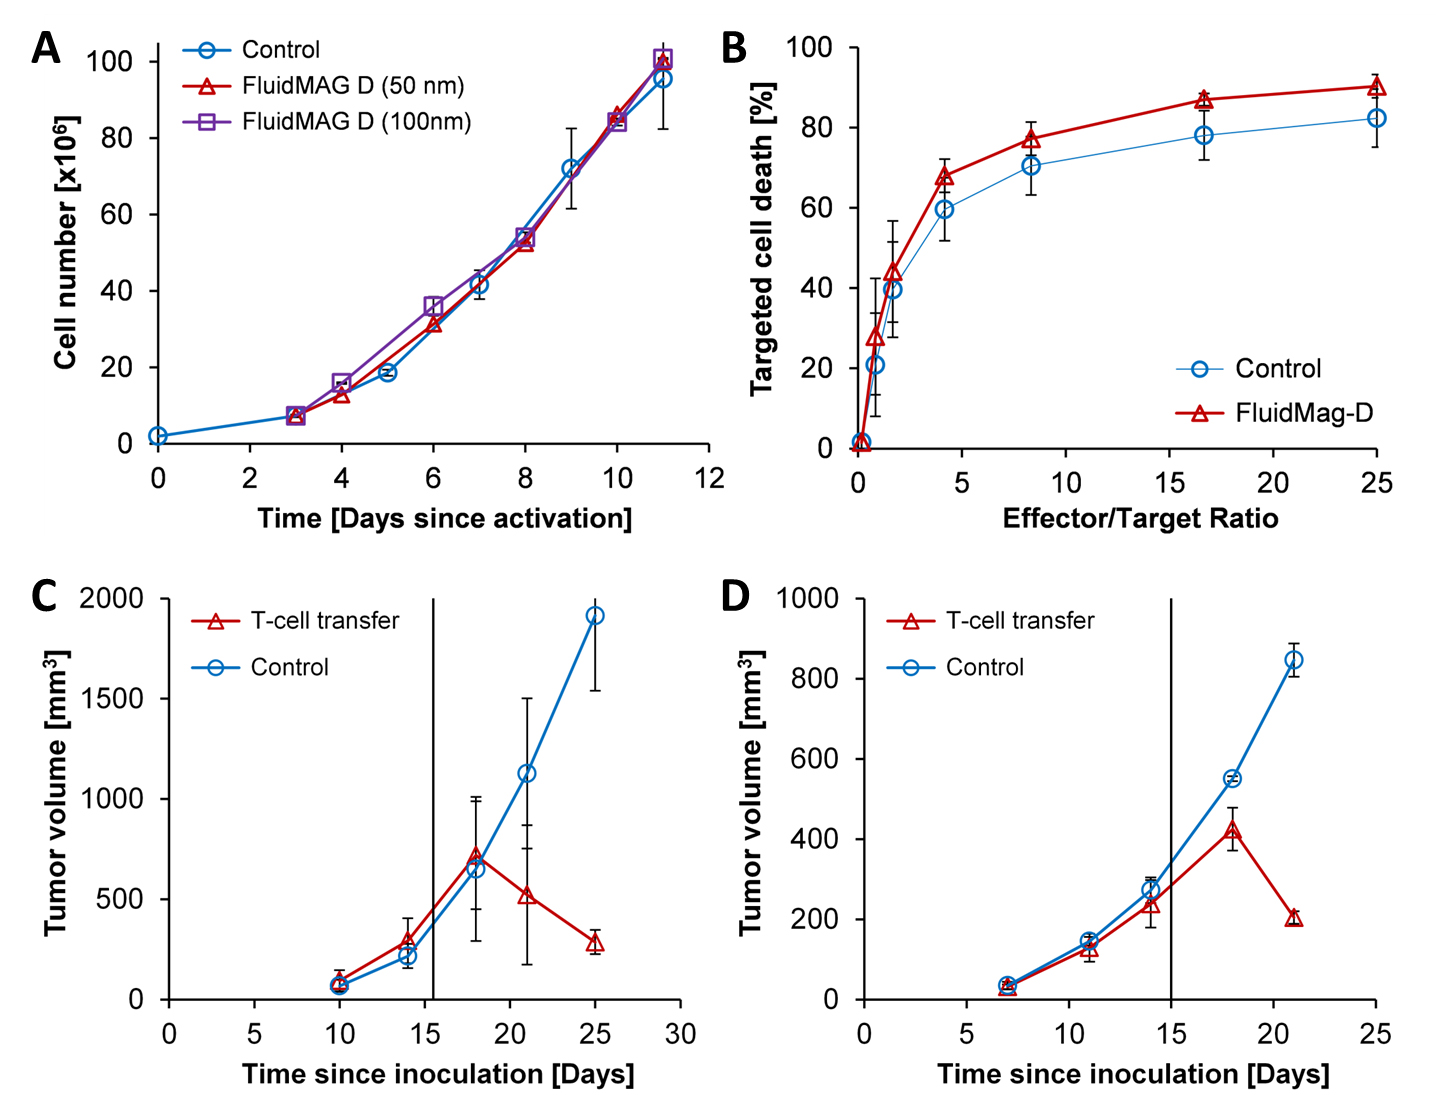
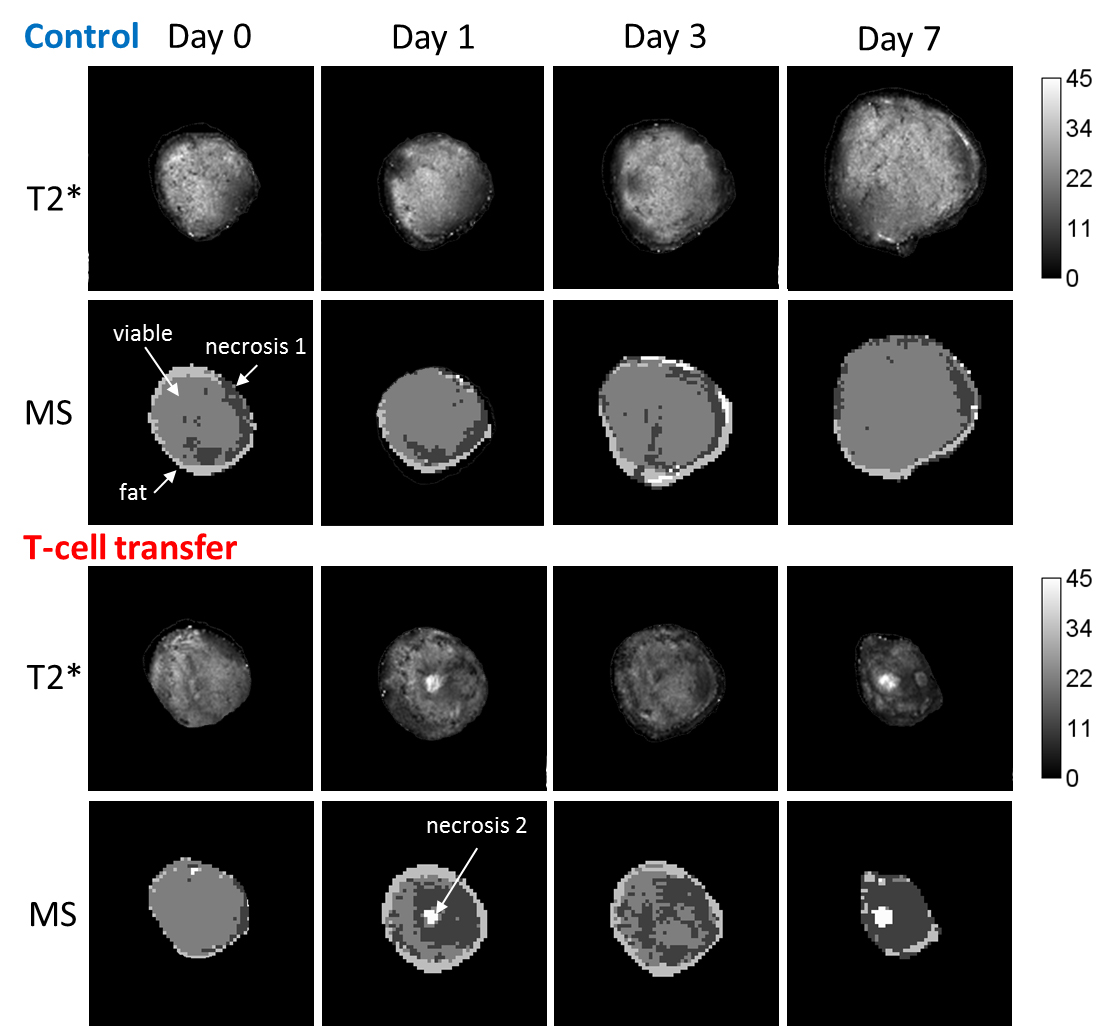
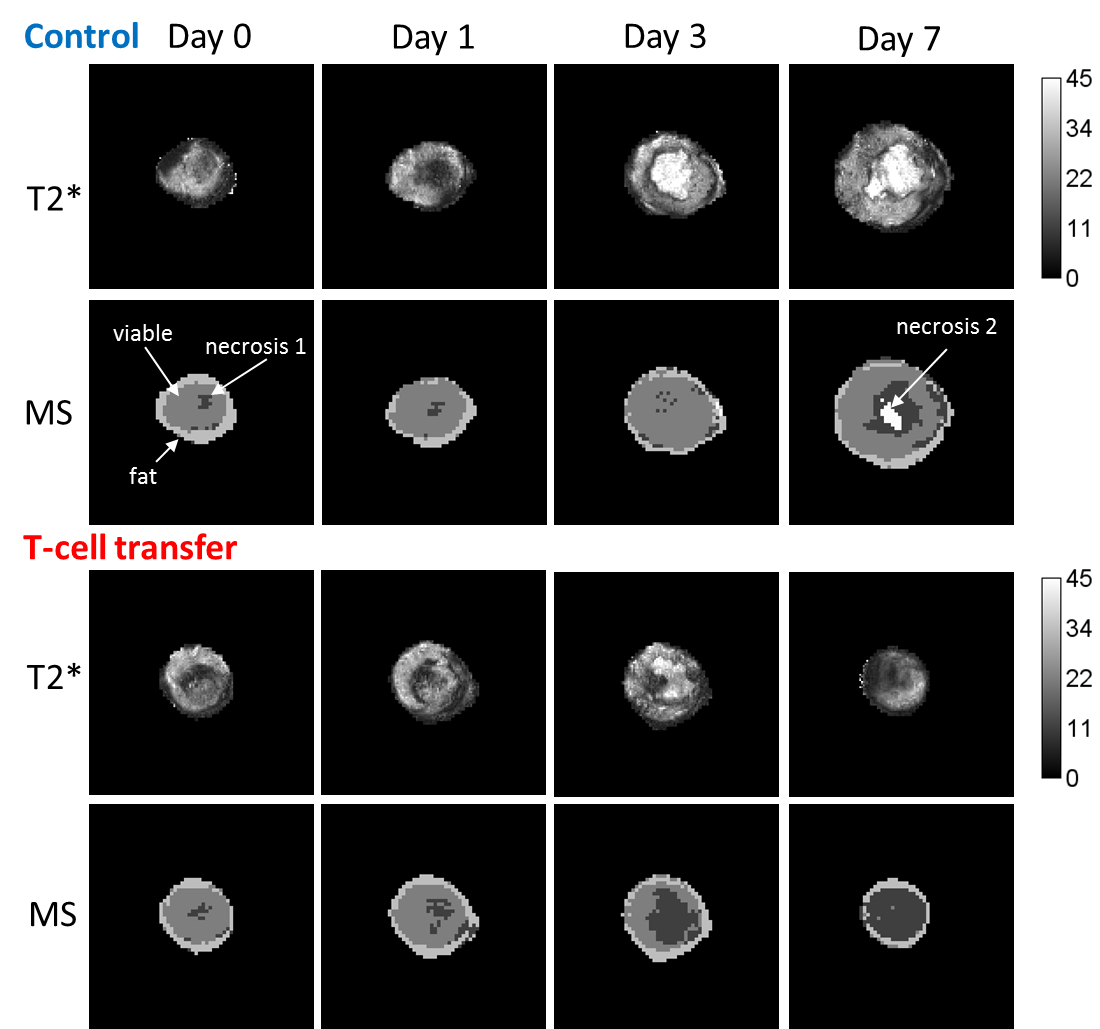
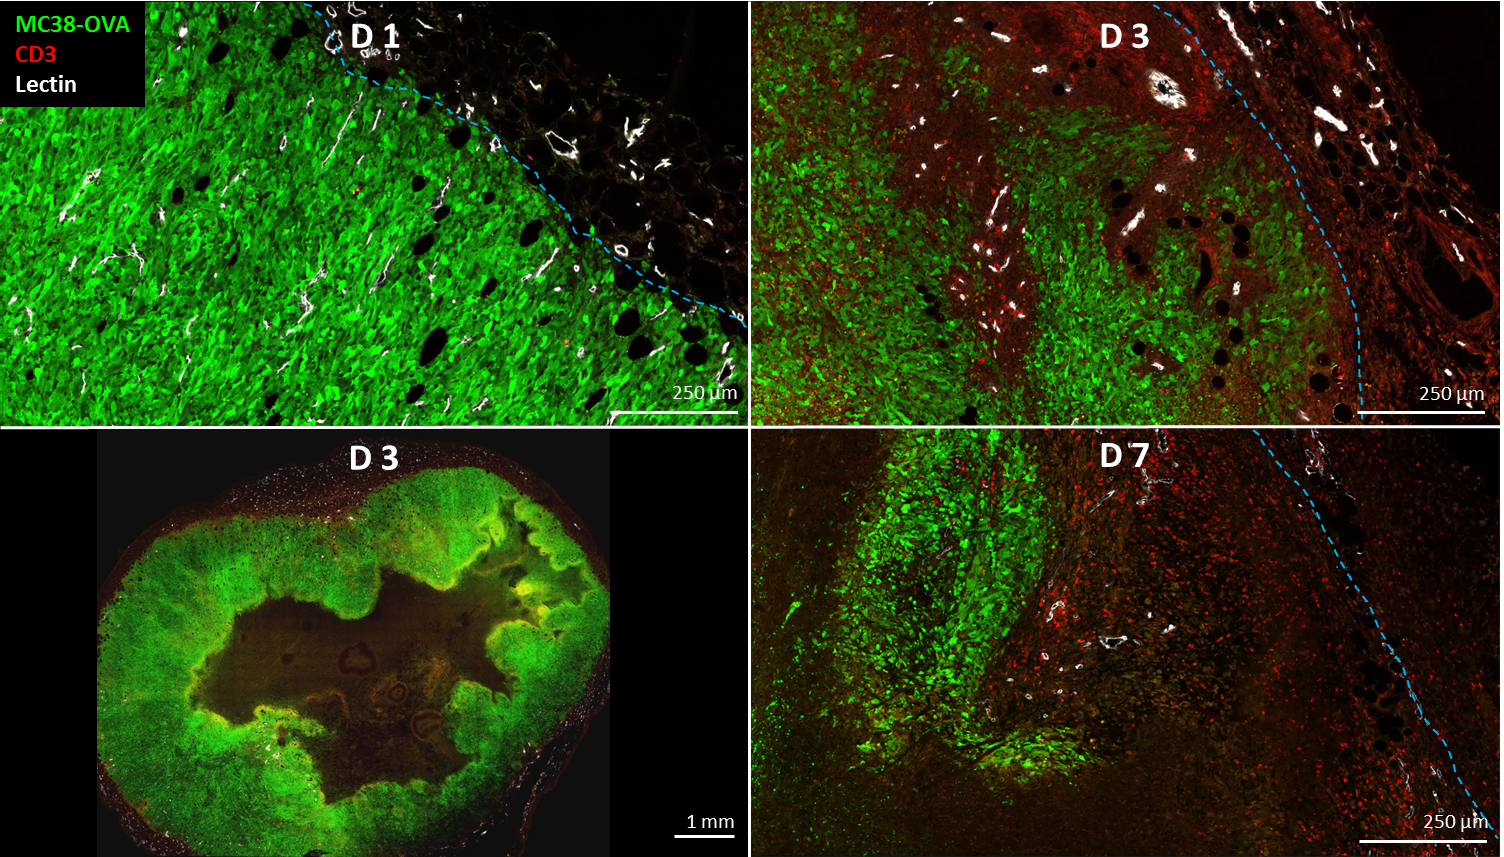
T-cell labeling with SPIOs carrying small negative or positive zeta-potentials did not effect cell viability, neither was viability effected by particle size (Figure 1A,B). However, particle uptake was size dependent reaching a maximum of 2 pg iron/cell for 100 nm particles. Furthermore, iron uptake increased with higher incubation concentrations plateauing at 250 µg/ml SPIOs. (Figure 1C,D). We next confirmed particle internalization by transmission electron microscopy, which showed accumulation in endosome/lysosome like structures (Figure 1E). Despite maintaining viability, other cell functions may be affected by labeling. However, we did not observe any differences for growth rates or cytotoxic activity between labeled and control cells (Figure 2A,B). Following ex vivo characterization, in vivo imaging was performed. Labeled T-cells were infused after baseline MRI in either C57BL/6 (n=4, saline control n=3) or NSG mice (n=4, saline control n=3) with EG7-OVA or MC38-OVA tumors respectively. T-cell transfer led to rapid tumor regression starting 3 days after T-cell transfer (Figure 2C). In line with this treatment effect, hypointense spots appeared in the tumor rim of EG7-OVA tumors one day after cell transfer indicating T-cell infiltration. This was supported by multispectral tissue classification, which showed increased necrosis in the T-cell transfer group (Figure 3). In contrast to EG7-OVA, MC38-OVA control tumors developed necrotic cores without receiving T-cells. Although T2* relaxivities declined in MC38-OVA tumors following T-cell transfer, hypointense spots were not readily identifiable (Figure 4), which might be explained by T-cell accumulation in the outer 250-500 µm of MC38-OVA tumor rims (Figure 5).Discussion
Iron uptake was comparable to previously published estimates and may be difficult to improve for small non-phagocytic cells (2,3). T-cell detection was further constrained by label dilution through cell division. Nonetheless, detection of labeled T-cells was feasible in EG7-OVA tumors. However, T-cell detection was not practical in MC38-OVA tumors due to hypointense tumor cores and rims. Embedding tumors in dental paste, which has been shown to reduce susceptibility artifacts, did not fully resolve this issue. Hypointense cores are consistent with, necrosis, hemorrhage or other vascular abnormalities prior to T-cell transfer. The lack of detectability in this model was likely due to T-cell accumulation in the hypointense outer rim of tumors. Furthermore, specificity was limited by small hypointense spots (consistent with vascular abnormalities) which could be detected prior to T-cell transfer in EG7-OVA and MC38-OVA tumors. Substantially higher iron uptake or alternative labeling strategies such as fluorine will be required to resolve these issues.Conclusion
Detection and quantification of SPIO labeled T-cells requires tumor models with homogenous T2* relaxivities which may be difficult to achieve in fast growing tumors or following therapeutic interventions.Acknowledgements
We would like to thank Stephen Santoro and Shannon Turley (Department of Cancer Immunology) for helpful discussions.References
1. Carano RA, Ross AL, Ross J, Williams SP, Koeppen H, Schwall RH, Van Bruggen N. Quantification of tumor tissue populations by multispectral analysis. Magn Reson Med 51:542-51 (2004).
2. Kircher MF, Allport JR, Graves EE, Love V, Josephson L, Lichtman AH, Weissleder R. In vivo high resolution three dimensional imaging of antigen specific cytotoxic T-lymphocyte trafficking to tumors. Cancer Res 63:6838-46 (2003).
3. Smirnov P, Lavergne E, Gazeau F, Lewin M, Boissonnas A, Doan BT, Gillet B, Combadiere B, Clement O. In vivo cellular imaging of lymphocyte trafficking by MRI: a tumor mode approach to cell-based anticancer therapy. Magn Reson Med 56:498-508 (2006).
Figures