0313
Correlated quantitative assessment of glioblastoma-angiogenesis by T2-mapping and in vivo multiphoton microscopy1Neuroradiology, University Hospital Heidelberg, Heidelberg, Germany, 2German Cancer Research Center (DKFZ), Heidelberg, Germany, 3Neurology Clinic and National Center for Tumor Diseases, University Hospital Heidelberg, Heidelberg, Germany, 4Clinical Cooperation Unit Neurooncology, German Cancer Consortium (DKTK), Heidelberg, Germany, 5Clinical Cooperation Unit Neuroimmunology and Brain Tumor Immunology, German Cancer Research Center (DKFZ), Heidelberg, Germany, 6E010 Radiology, German Cancer Research Center (DKFZ), Heidelberg, Germany, 7Neurooncology (G370), German Cancer Research Center, Heidelberg, Germany
Synopsis
Microvasculatures in healthy cortical tissue, in untreated and in antiangiogenically treated glioblastoma multiforme are compared in a mouse model. From T2-maps, the information entropy is determined for each tissue type. In addition, capillaries are directly imaged through in vivo multiphoton microscopy to obtain sets of microvascular parameters. The T2-entropy is lowest in healthy tissue and significantly higher in glioblastoma, with a moderate decrease in treated tumors. Several vascular characteristics correlate with the T2-entropy. The correlations provide insight into the influence of microvasculature on MR-dephasing.
Purpose
Although it is well-known that the presence of blood vessels has a strong influence on signal dephasing in MRI1,2, the detailed effects of irregularly shaped vessel networks is less well-understood. In this work, we study the information entropy as obtained from quantitative maps of relaxation time T2 as a potential biomarker to differentiate healthy cortical tissue from glioblastomas.Methods
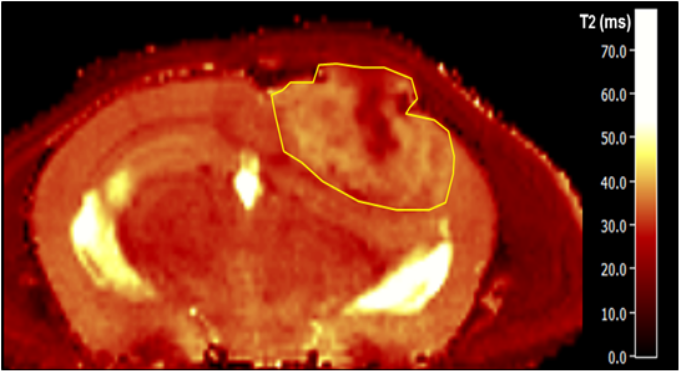
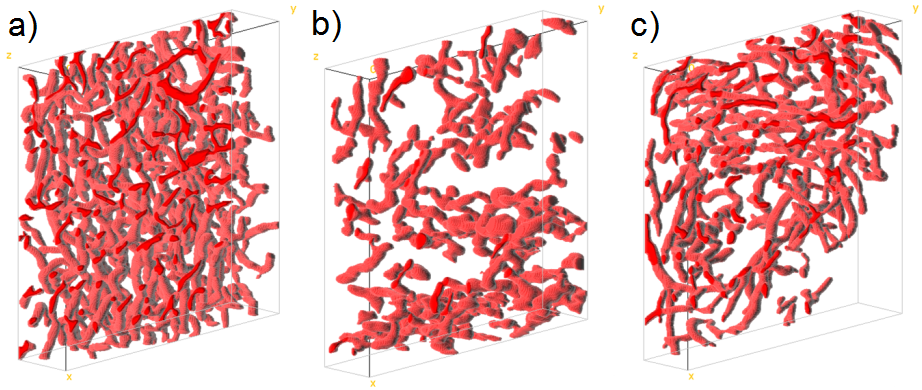
8-10 week old NMRI nu/nu nude mice were intracranially injected with 50 000 glioblastoma cells (U87-tdTomato/GFP). Starting from day 21 after injection, some animals (n=3) were treated every three days with an anti-Ang-2/-VEGF-A antibody by intraperitoneal injection (5 mg/kg bodyweight). T2-maps (0.1 mm in-plane-resolution) were acquired using a single-spin-echo RARE-sequence at 9.4 Tesla (BioSpec 94/20 USR, Bruker BioSpin) and the T2-values were used to determine the information entropy3 in a region of interest within a specific tissue type, see Fig. 1. Multiphoton microscopy (1.2 µm in-plane-resolution) was used to image the capillaries in the respective tissue through an intracranial window (Zeiss LSM7MP microscope)4. Upon segmentation (Fig. 2), different microstructural signature parameters such as the mean vessel radius, the mean distance between branching points, fractional vessel volume and the lacunarity, among others, were determined from the capillary network. Vessel segmentation and statistical analysis were conducted using ImageJ and custom-made Matlab code.Results
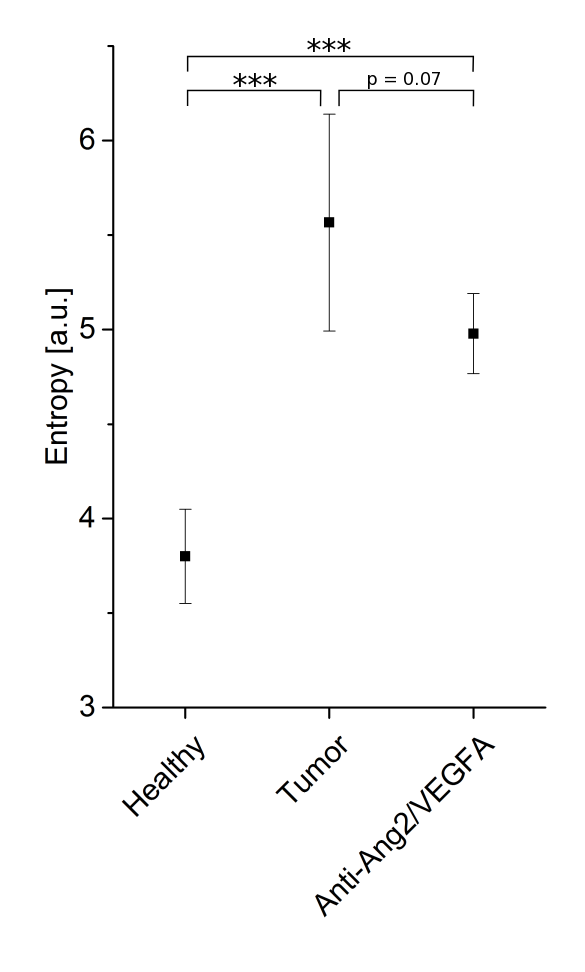
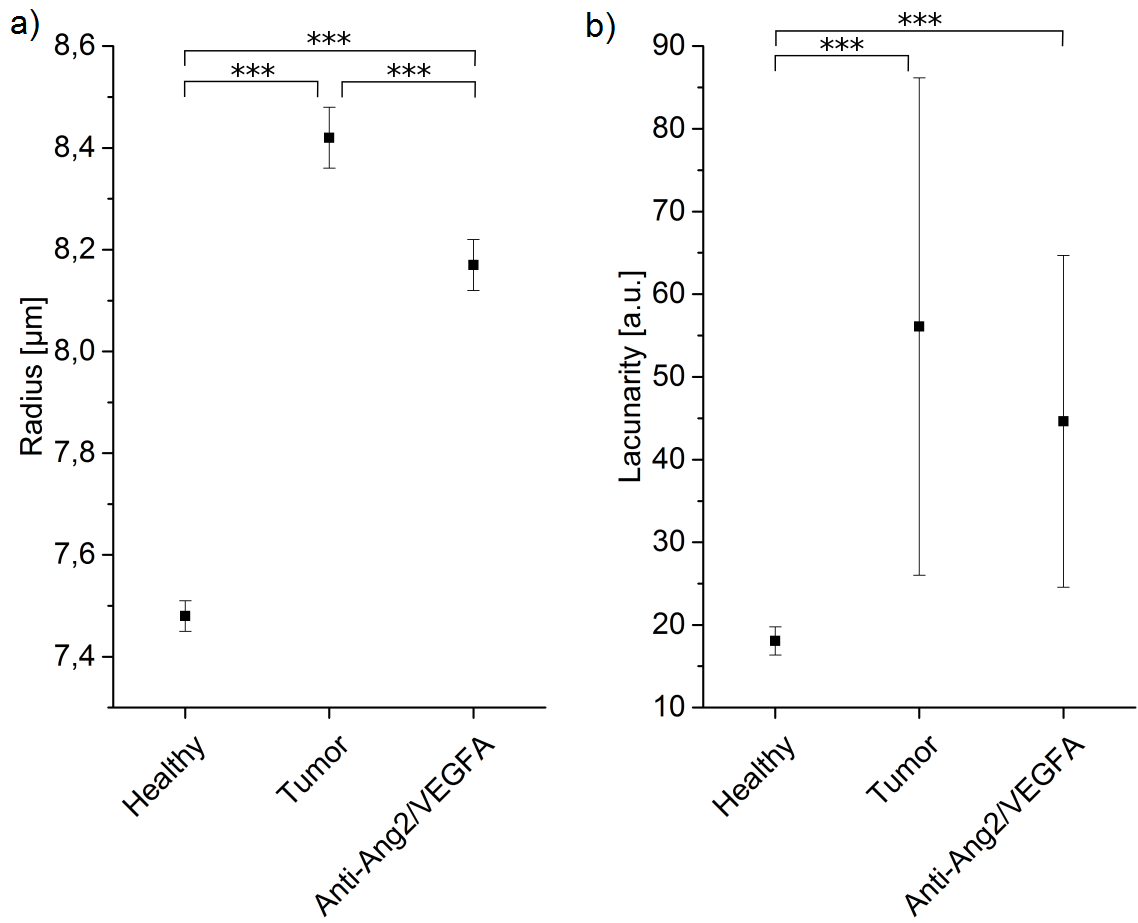
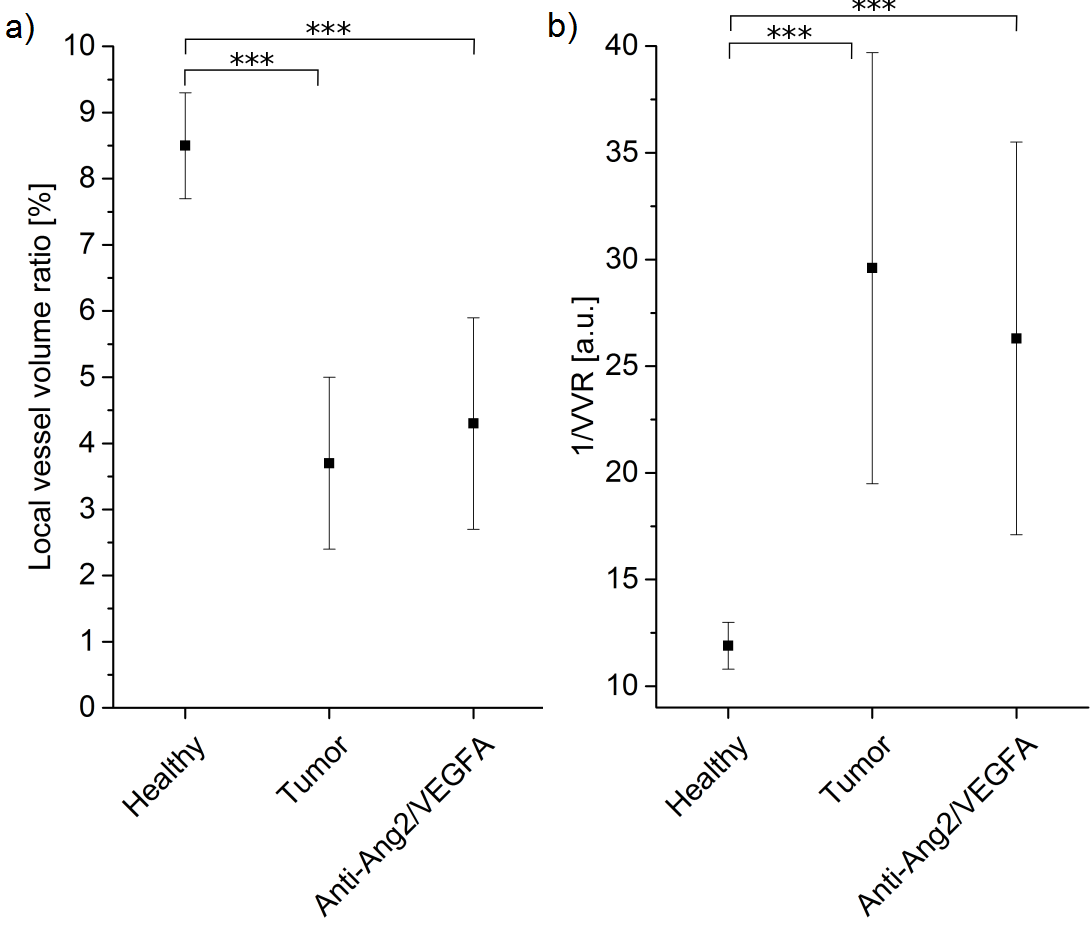
The T2-information entropy was found to increase significantly in glioblastomas (n=3 untreated mice), as compared to healthy brain tissue (n=5 healthy mice) and to decrease again upon antiangiogenic therapy (n=3 treated mice), see Fig. 3. The mean capillary radius and the lacunarity, a measure for the “gappiness” of the vessel distribution, exhibited similar trends (Fig. 4). The local vessel volume ratio in voxels of 0.1 mm side length (MRI-voxel size) presented the same tendencies when taken reciprocal, see Fig. 5. These are the most significant measures found to correlate with the T2-entropy among the three tissue types under consideration.Conclusion
In this study, several microscopic vessel properties could be identified that significantly differ in glioblastomas as compared to healthy tissue (and normalize upon antiangiogenic therapy). The tumor characteristics that correlated most with T2 map entropy were mean capillary radius, lacunarity and inverse local vessel volume ratio. Future studies will need to study the relation between the identified microscopic signature parameters and the magnetic resonance signal decay more closely, not only for simple models, but also for large, disordered, realistic vessel networks.Acknowledgements
This work was supported by grants from the Deutsche Forschungsgemeinschaft (Contract Grant number: DFG ZI 1295/2-1 and DFG KU 3555/1-1). F. T. Kurz was supported by a postdoctoral fellowship from the medical faculty of Heidelberg University and the Hoffmann-Klaus foundation of Heidelberg University.References
1. Alexander L. Sukstanskii, Dmitriy A. Yablonskiy. Theory of FID NMR Signal Dephasing Induced by Mesoscopic Magnetic Field Inhomogeneities in Biological Systems. J Magn Reson. 2001;151(1):107-117.
2. Christian H. Ziener, Thomas Kampf, Georg Reents, Heinz-Peter Schlemmer, Wolfgang R. Bauer. Spin dephasing in a magnetic dipole field. Phys Rev E. 2012;85:051908.
3. Rafael C. Gonzalez, Richard E. Woods, Steven L. Eddins. Digital Image Processing Using MATLAB. New Jersey, Prentice Hall, 2003, Chapter 11.
4. Matthias Osswald, Erik Jung, Felix Sahm, Gergely Solecki, et al. Brain tumour cells interconnect to a functional and resistant network. Nature 2015;528:93-98.
Figures