0312
Fluorine-19 NMR cytometry to quantify human transgenic CAR T cell biodistribution in murine studies of glioblastoma immunotherapyFanny Chapelin1, Hideho Okada2, and Eric T Ahrens3
1Bioengineering, University of California San Diego, La Jolla, CA, United States, 2Neurological surgery, University of California San Francisco, San Francisco, CA, United States, 3Radiology, University of California San Diego, La Jolla, CA, United States
Synopsis
Technologies to quantify the biodistribution of emerging immunotherapeutic cell therapies against cancer can accelerate the timeline to evaluate potential candidates. In this study, we describe the use of in ‘NMR cytometry’ to assay immunotherapeutic cell biodistribution in a mouse model of sub-cutaneous glioblastoma (U87) treated with chimeric antigen receptor (CAR) T-cells. We examine CAR T cell 19F labeling efficiency, phenotype and biodistribution with 19F NMR at day 2 and 7 post infusion to elucidate T-cell tumor homing, survival, and tissue distribution.
Introduction
Glioblastoma multiforme (GBM) is the most common
and most aggressive brain cancer for which classical treatment options remain
limited. Recent advances in adoptive cell transfer applied in other cancers
hold great promise for the treatment of GBM. The use of engineered chimeric
antigen receptor (CAR) T cells is experiencing a period of intense research and
development activity [1]. It is critical to develop tools to quantitatively
assay T-cell biodistribution and survival after delivery to correlate with
putative therapeutic effects. Our preliminary results show that 19F NMR
cytometry [2] is a promising tool for preclinical CAR T cell detection. In this
approach, T-cells are quantitatively labeled in culture with a perfluorocarbon
(PFC) nanoemulsion and then infused to animals; at the experimental endpoint,
organs and tissues are necropsied and subjected to intact-tissue 19F
NMR spectroscopy to measure total 19F content and apparent T cell
numbers. This approach yields a high-throughput method to quantify CAR T cell distribution
in a model of glioblastoma multiforme (GBM) using intact tissue samples, which
can be correlated to tumor growth.Methods
Human PBMC-isolated T cells were transduced with
a CAR lentiviral vector to express a surface antibody against EGFRvIII, a
common receptor in GBM [3]. Transduction efficacy and phenotype of the T cells
was confirmed by FACS. Additionally, U87-EGFRvIII human cancer cells were
transduced with an established luciferase
reporter to monitor tumor progression (Referred to as U87-EGFRvIII-Luc).
In
vitro apoptosis induction by
co-culture of CAR T cells with U87-EGFRvIII cells was evaluated at 6 h, 12 h
and 24 h. Female SCID mice (N=30) received bilateral sub-cutaneous injections
of 5 million U87-EGFRvIII-Luc cells. Once tumors were established, the
mice were divided into three groups. One group received 20 million CAR T cells
intravenously (i.v.), another received untransduced T cells and the third
remained untreated. CAR T cells and naïve T cells were intracellularly labeled
with a PFC emulsion (CS-1000, Celsense, Inc.) ex vivo and the mean cell uptake was measured by 19F NMR
to yield the 19F/cell [4]. Tumor growth was monitored over 7 days
with bioluminescence imaging and caliper measurements. Intact organs were then
harvested for fluorine-19 NMR measurements to quantify their total fluorine
content. The apparent cell number per organ was deduced from the average PFC
loading per cell and did not take in vivo
cell division into account. Histopathological staining against HLA (human
marker) and CD3 (T lymphocyte marker) were performed to correlate T-cell homing
in tissues.Results
Two weeks after transduction, 85% of the human T cells expressed the CAR receptor (Fig. 1.A). Labeling experiments with PFC nanoemulsion showed optimum uptake when incubated with 10 mg/ml overnight. PFC labeling did not impair T-cell viability or phenotype (Fig. 1.B and C). In co-incubation experiments with U87-EGFRvIII-Luc cells, CAR T cells were significantly more cytotoxic than untransduced T cells. CAR T cells caused 93% cell death at 24 h compared to 53% for untransduced T cells. Longitudinal bioluminescence acquisitions showed considerable tumor regression 7 days after CAR treatment with an average radiance of 5.02x10¹⁰ photons/sec, which was twice lower than the luminescence measured for both naïve T-cell treated and untreated groups (p=0.0001, Fig. 2.A and B). Tumor volume averages showed 50% reduction in tumor growth for the CAR T-cell treated group (p=0.0007) and no significant difference between untransduced T-cell treated and untreated groups (p=0.53). NMR measurements at day 2 post treatment showed greater CAR T-cell homing to the spleen and tumors compared to untransduced T cells (p=0.01 and 0.04 respectively). The number of CAR T cells found in the tumors remained stable until day 7, whereas naïve T cells could no longer be detected. The liver signal likely represented the dead T cell fraction, averaging ~15% of the injected dose in both groups. No significant differences were found regarding lymph node biodistribution between groups. The tail signal represents the mis-injected cell portion. Histopathological staining confirmed the presence of CAR T cells and untransduced T cells in the spleen and tumors, consistent with the NMR results.Conclusions
19F NMR imaging is a rapid and quantitative technique to evaluate adoptive cell transfer biodistribution on intact tissues. This technique provides more comprehensive information compared to histopathology, which relies on indirect detection via antibodies and quantification approximation from a limited number of slides. Overall, 19F NMR imaging, in conjunction with bioluminescence imaging, may accelerate the timeline to evaluate new immunotherapeutic cell candidates by providing a rapid and straightforward method to evaluate cell therapy distribution, cell fate, and efficacy in preclinical studies.Acknowledgements
This work was supported by the NIH grant R01-EB017271 and CIRM grant LA1-C12-06919References
[1] Jackson HJ, et al. Nat Rev Clin Oncol. Jun;13(6):370-83, 2016; [2] Ahrens ET et al. NMR Biomed. Jul;26(7):860-71, 2013; [3] Johnson LA et al. Sci Trans Med. Feb 18;7(275):275ra2, 2015; [4] Zhong J et al. Plos One. Oct 20;10(10):e0140238, 2015Figures
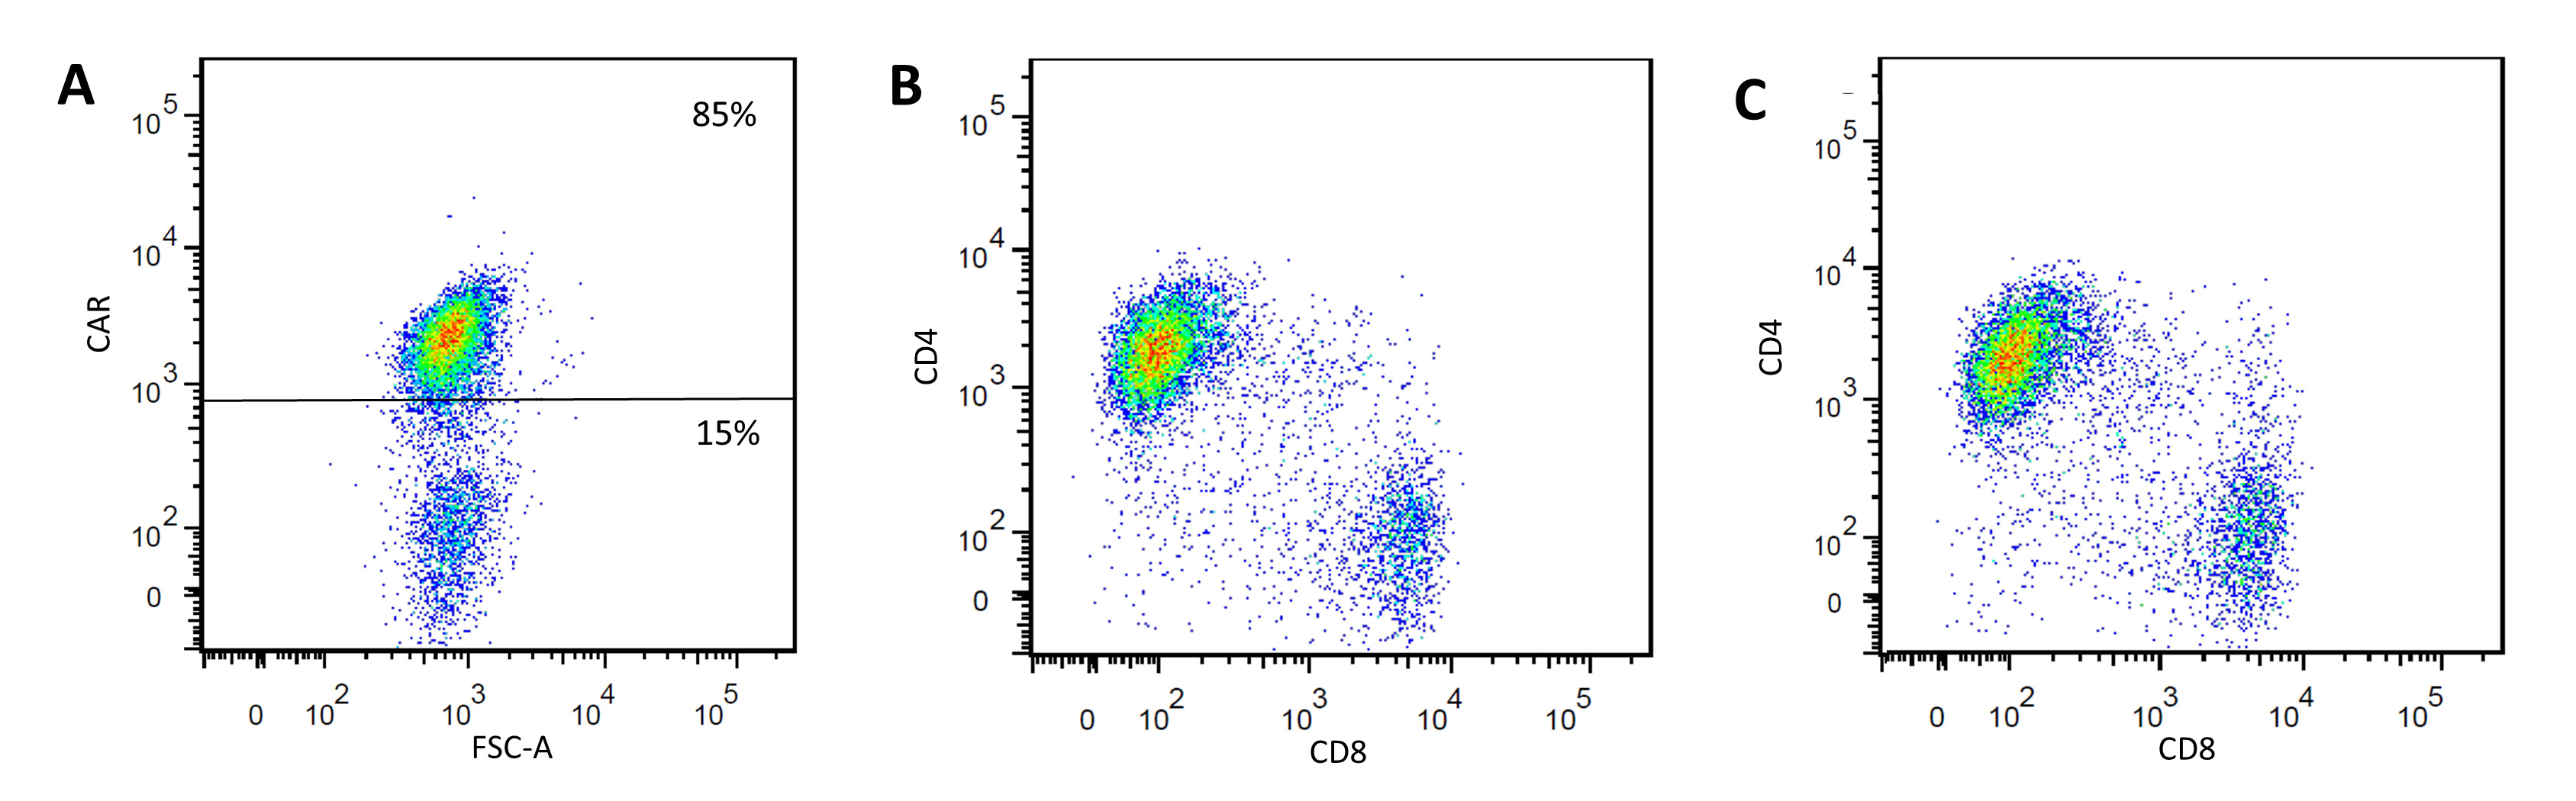
Figure 1:
CAR T-cell transduction and characterization. A. Scatter plot of the CAR T cell population 2 weeks after transduction
showing 85% CAR positive T cells. B. FACS
plot showing balanced repartition of CD4 positive and CD8 positive CAR T cells
after transduction. C. PFC-labeled
CAR T cells have similar phenotypes and are not affected by labeling.
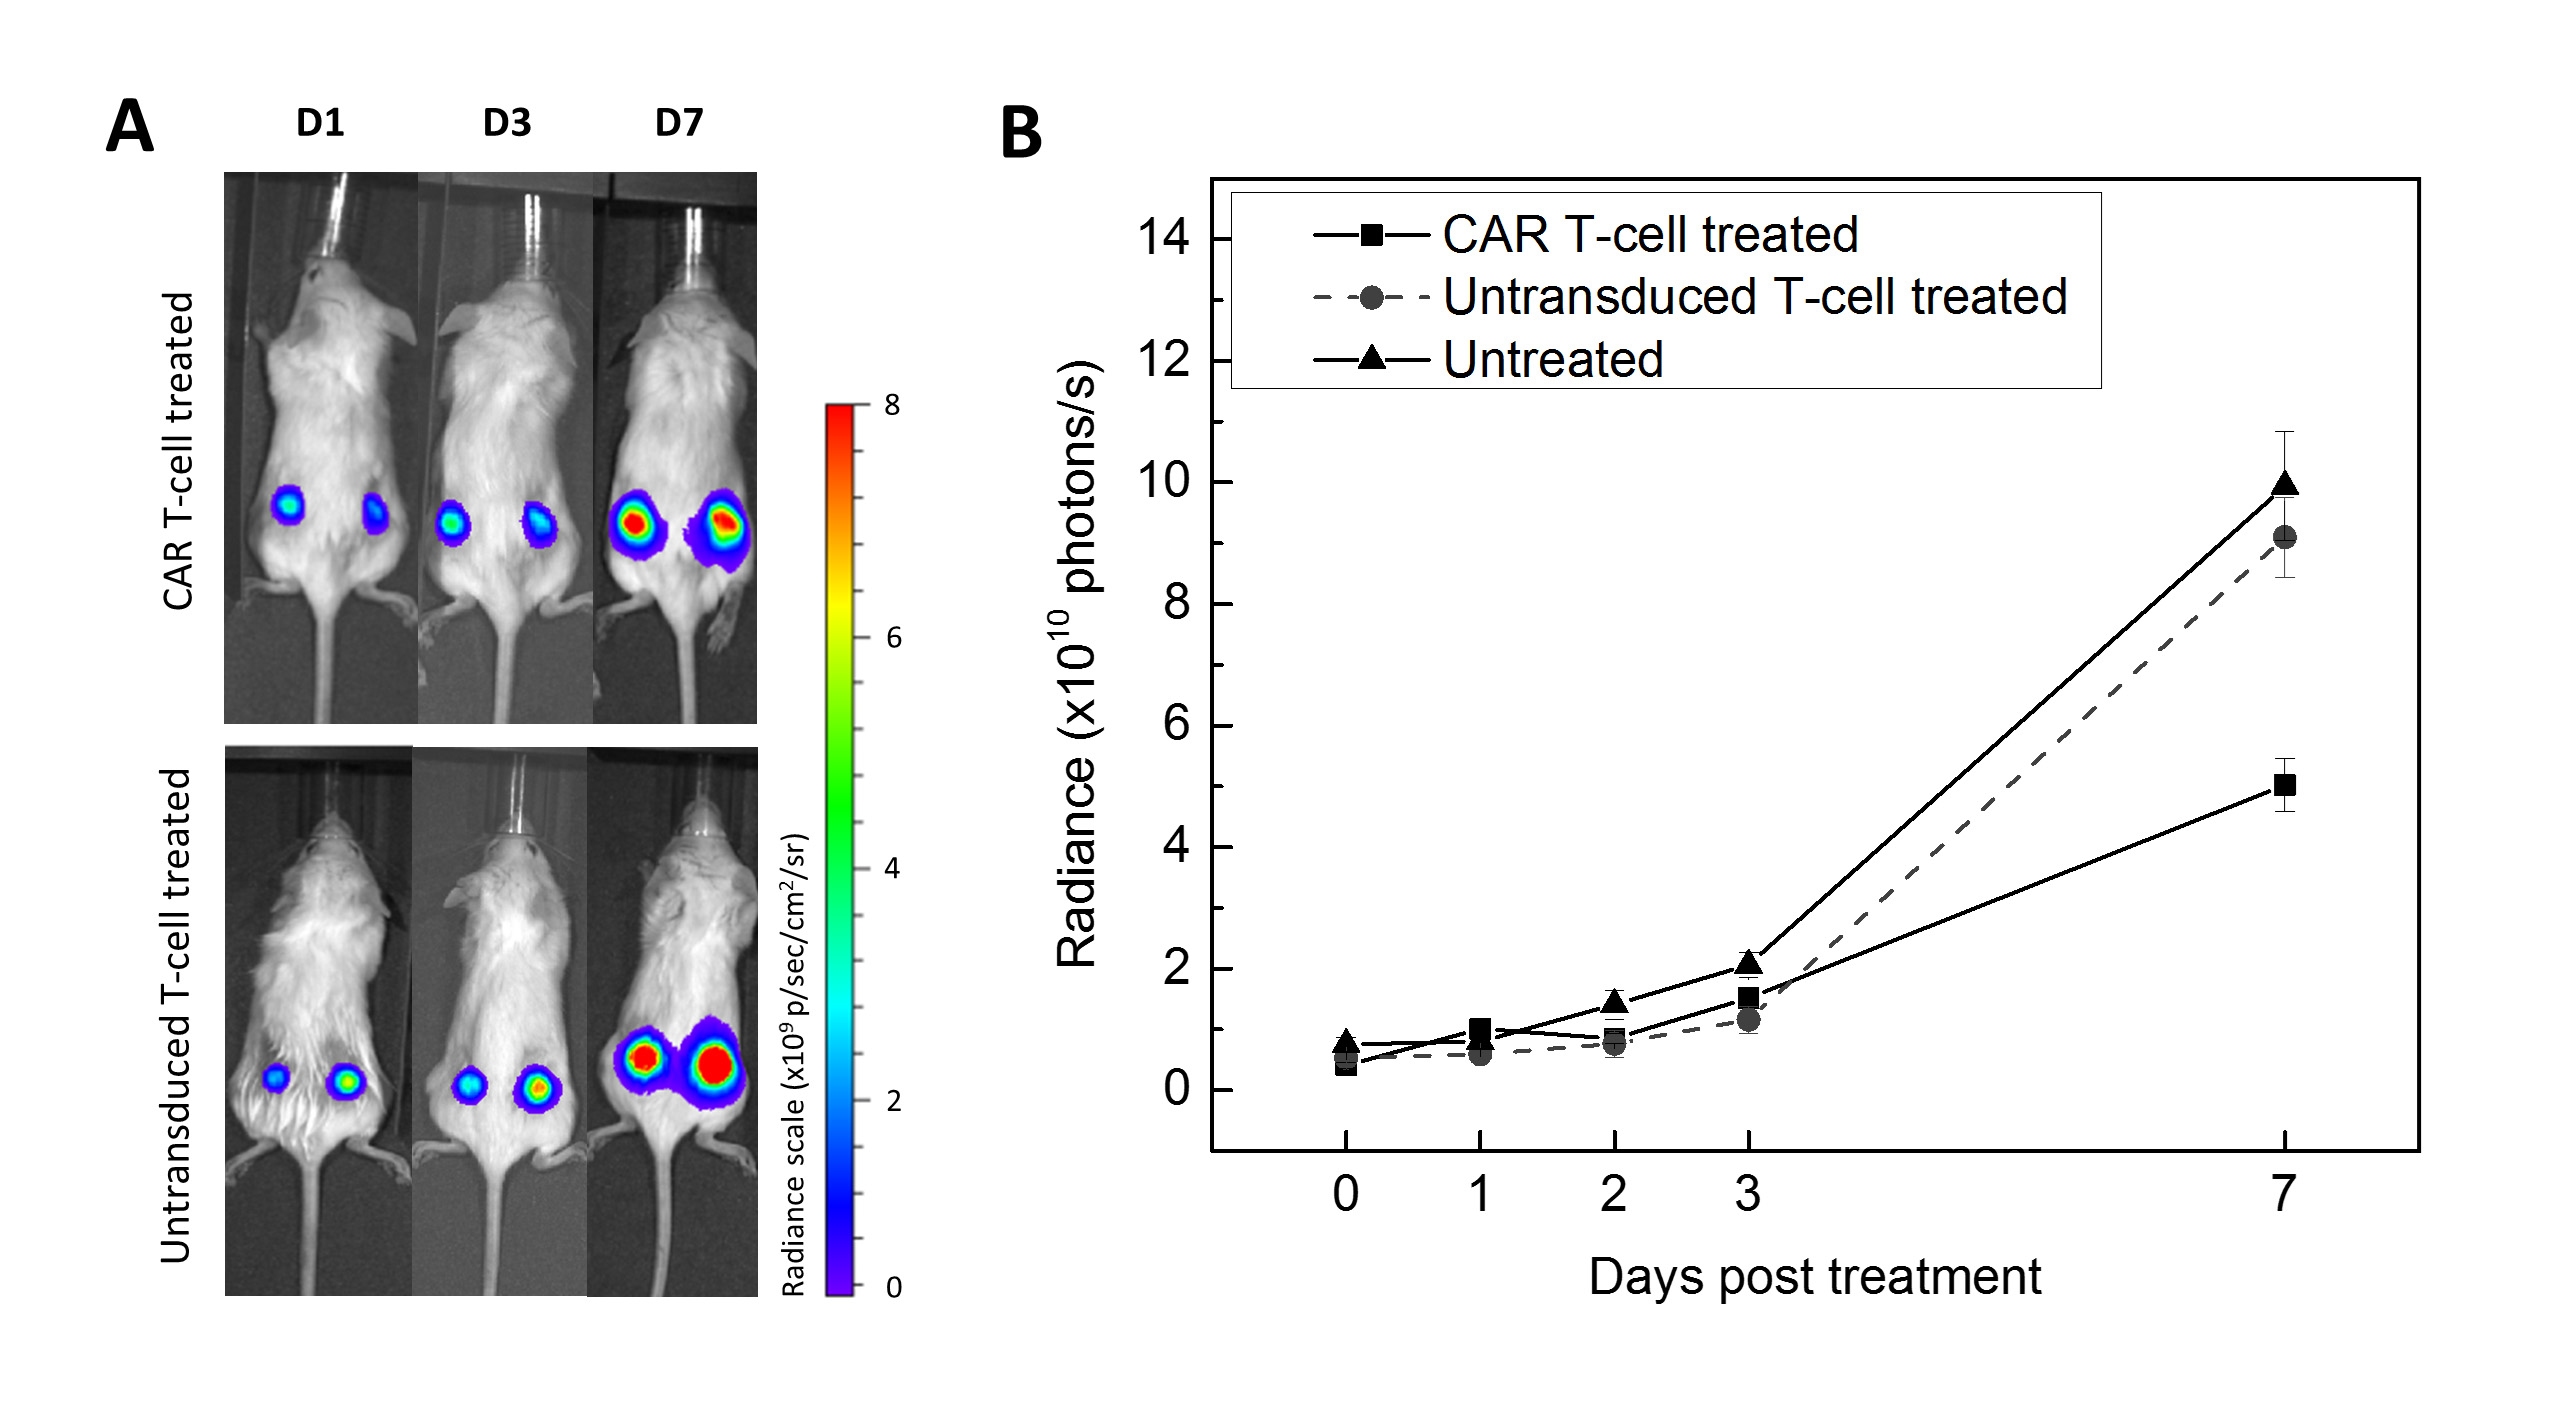
Figure
2:
Immunotherapy impact on tumor growth in
vivo. A. Representative bioluminescence
images at day 1, 3 and 7 after immunotherapy for CAR-treated and untransduced
T-cell treated groups. Signals are expressed in radiance (p/sec/cm2/sr)
B. Time course of bioluminescence
intensity in treated and untreated groups. CAR T-cell treated animals display a
radiance half as high as untransduced T-cell treated animals and untreated
animals (p=0.0001), representing significant tumor growth reduction in the
CAR-treated group.
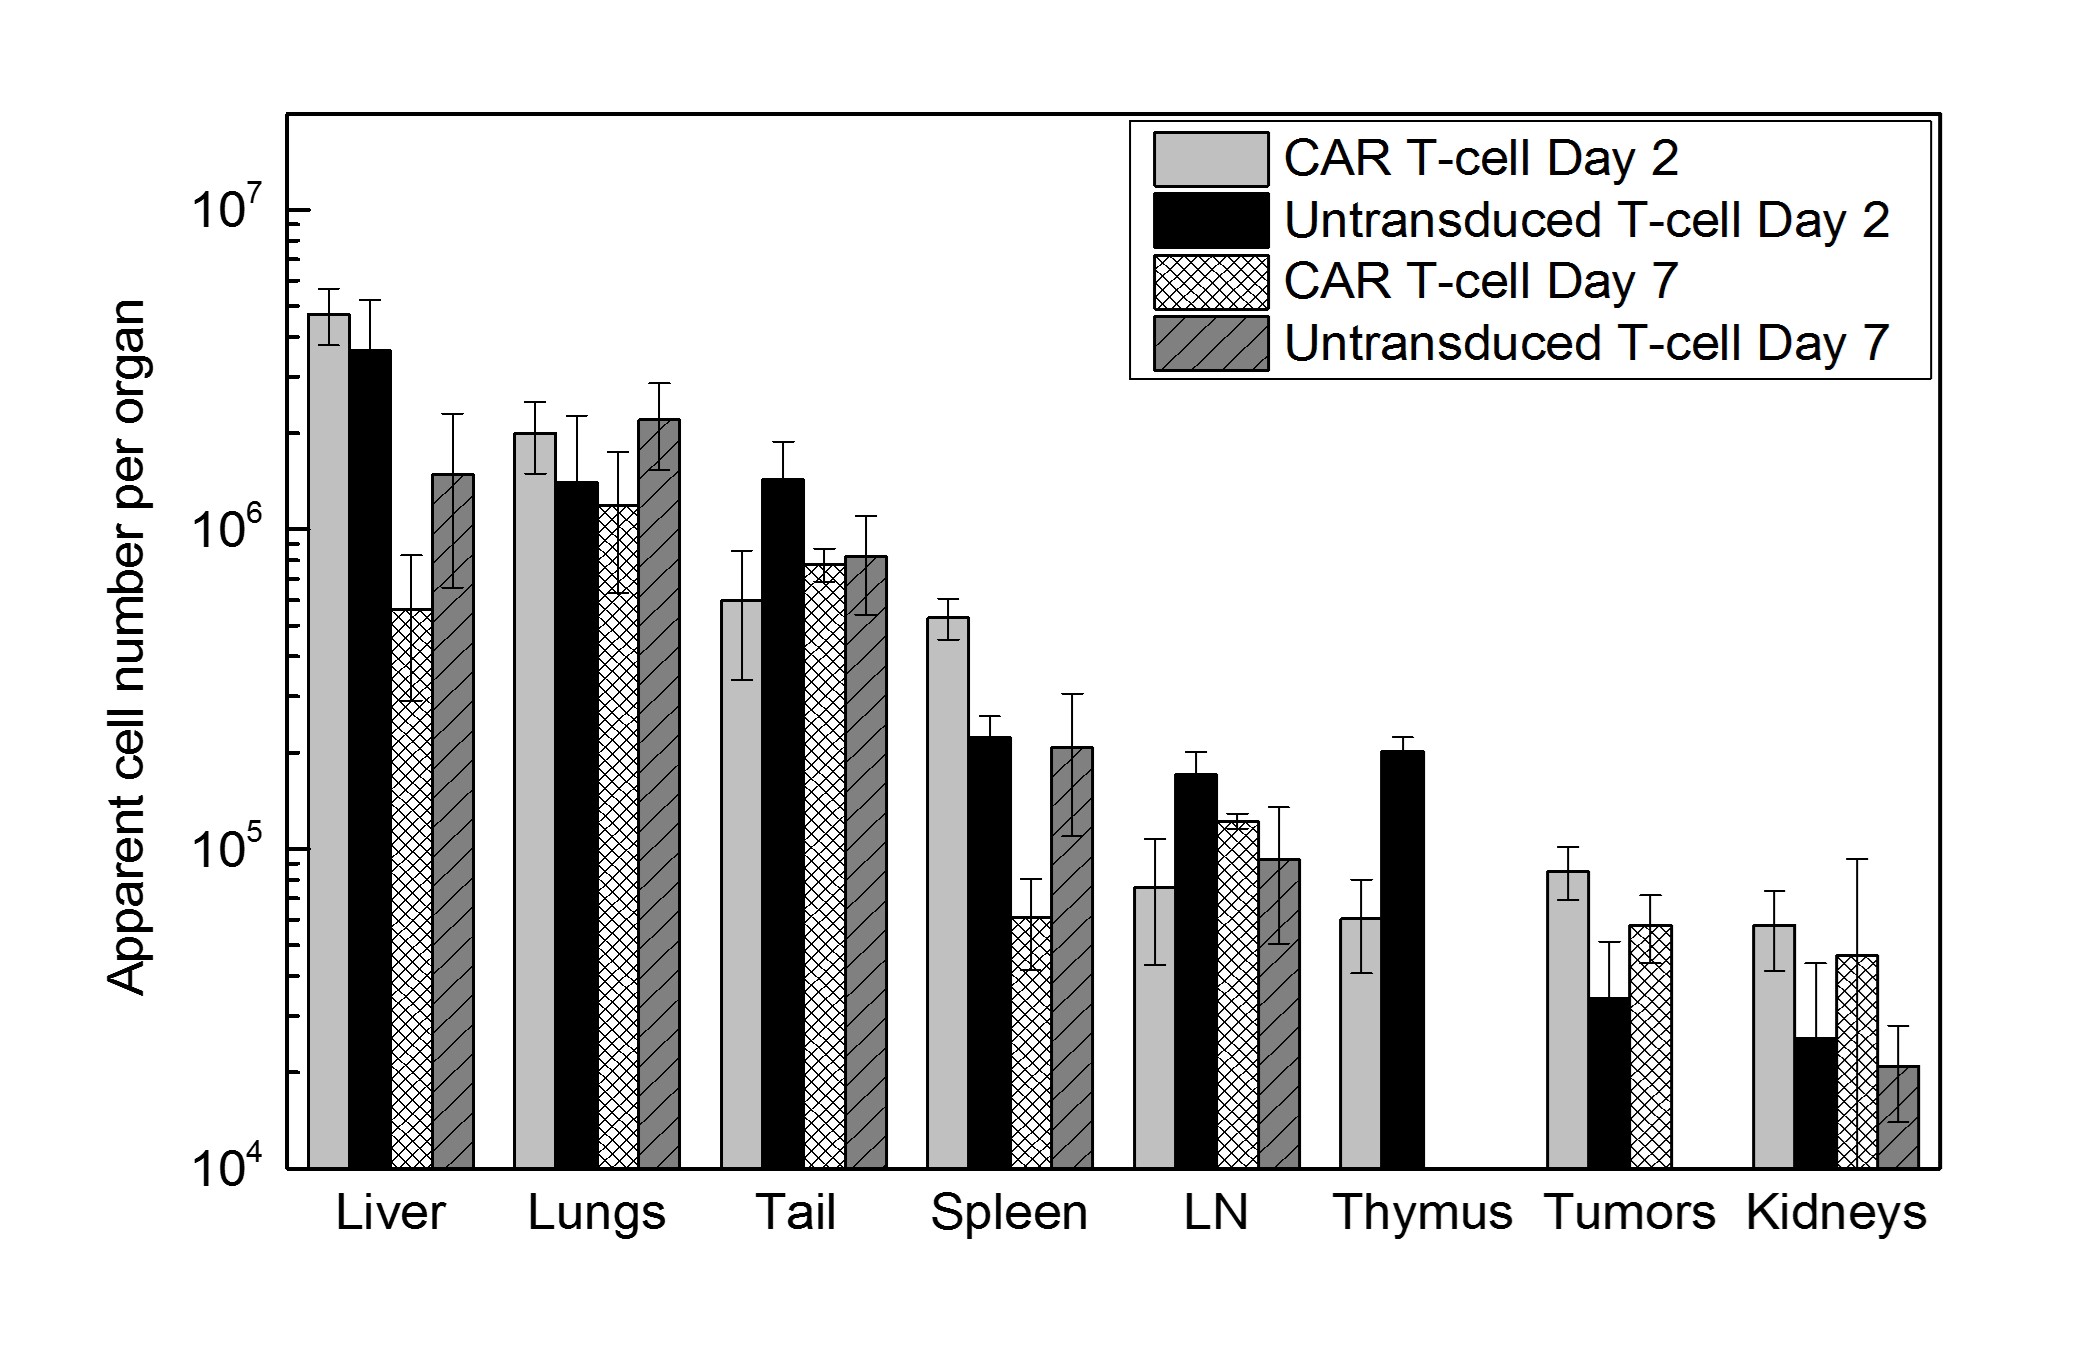
Figure
3:
Biodistribution quantification of fixed tissue samples by 19F NMR at
2 days and 7 days post treatment. 19F NMR measurements show greater CAR
T-cell homing to the spleen and tumors compared to untransduced T cells at day
2. The liver signal likely represents the dead T-cell fraction. These measurements
do not account for cell division, thus referred to as “apparent cell number”.