0311
Co-registration of multi-parametric MRI and histology to study breast cancer Habitats in a preclinical model.1Department of Cancer Imaging and Metabolism, Moffitt Cancer Center, Tampa, FL, United States, 2Faculdade de Medicina de Sao Jose do Rio Preto, Sao Jose do Rio Preto, Brazil, 3Nalecz Institute of Biocybernetics and Biomedical Engineering, Warsaw, Poland
Synopsis
Different tumor micro-environments or habitats are discernible by MRI. In order study these; a co-registration framework was developed using 3D-printed tumor-molds created from in-vivo MRI images of five mice with implanted breast cancer tumors. The results of automated 3D-alignment of MRI images and histology slices are promising and encourage further experiments using the presented workflow. Tumor habitats clustering from multi-parametric MRI images showed encouraging results with similarities to the hypoxic pattern observed by immunohistochemistry. This work will help understanding MRI habitats to monitor cancer evolution as a means to aid treatment decisions in the future.
INTRODUCTION
Different tumor micro-environments are the result of Darwinian dynamics, may be discernible by MRI, and are referred to as habitats1. In order to study these, it is necessary to co-register MRI and histological images, which is an unresolved problem due to the complexity of the histology process2. In the last few years, 3D-printed molds have been used to aid the image co-registration, but most of the work has been done in human prostate slices of 5 to 8mm3-5. In this work, a co-registration framework was developed using 3D-printed tumor-molds created from in-vivo MRI images of five mice with implanted breast cancer tumors. Tumors were sectioned in 2mm slices to improve accuracy of the co-registration, compared to those used before3-5. Preliminary co-registration and habitats results are shown and discussed. This work will help understanding MRI habitats to monitor cancer evolution as a means to aid treatment decisions in the future.METHODS
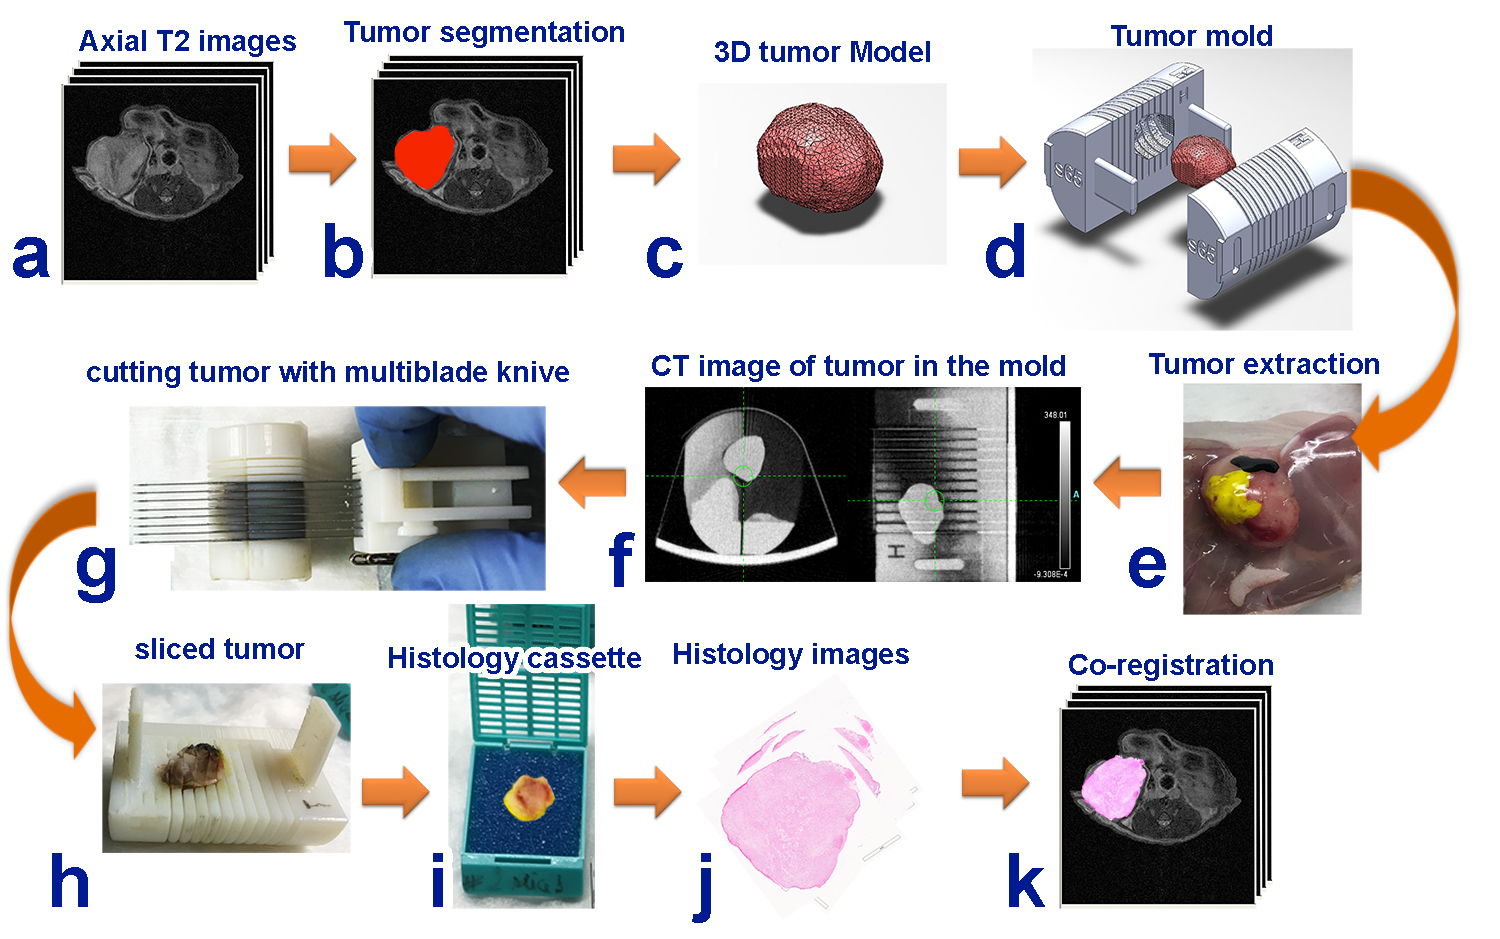
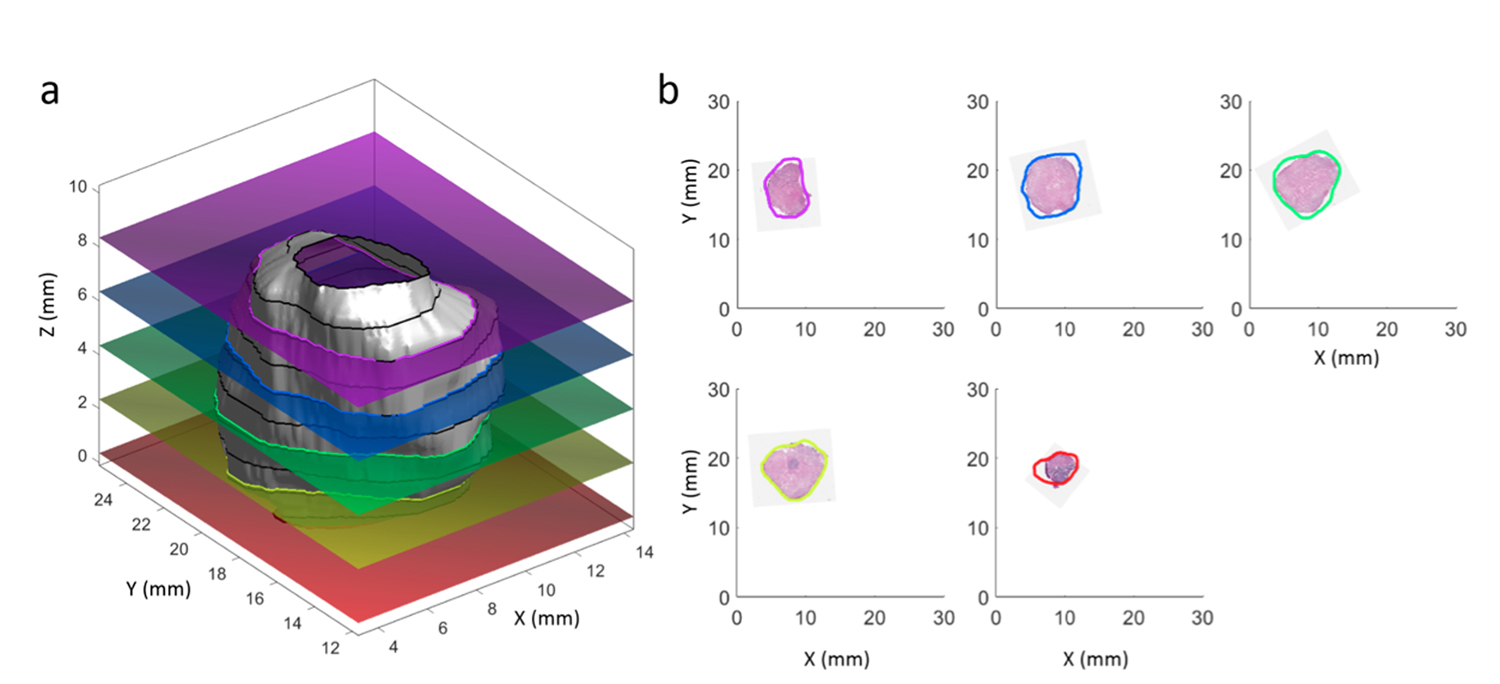
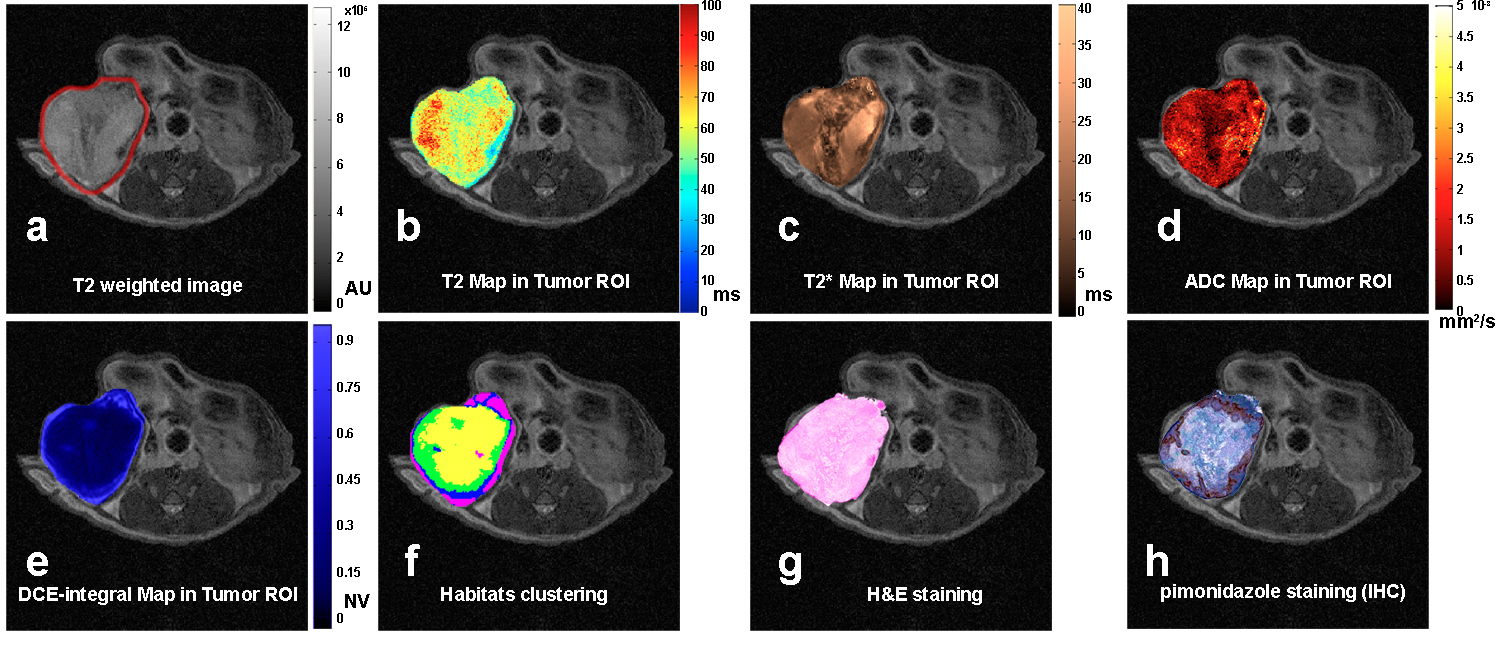
All MRI experiments were done in a 7T horizontal magnet (Agilent-Technologies) and Bruker electronics (BioSpec AV3HD), using a 35mm birdcage coil(Doty Scientific). Six multi-parametric MRI images were acquired to determine tumor habitats using a Gaussian mixture model fit with an expectation maximization algorithm in MATLAB(Mathworks, Inc.). Using four clusters, the fit was performed on all pixels within the tumor volume of interest. Tumor contours were segmented in MATLAB using axial T2-weighted images and exported as a 3D-tumor-surface (fig.1.a.b.c). Tumor molds were designed in SolidWorks (SolidWorks Corp.) by carefully aligning the 3D-tumor-surface with the corresponding cutting slots (fig.1.d). Tissue marking dyes (Cancer Diagnostics, Inc.) were used to aid tumor orientation in the mold(fig.1.e). Tumors were fixed in Pen-Fix (Thermo Scientific™) for 1 hour inside the mold and imaged in a microCT (Inveon, Siemens Corp.) to verify the accuracy of the mold (fig1.f). All tumors slices were cut at once using a designed multi-blade knife consisted of 11 bevel HD Microtome Blades (Cancer Diagnostics, Inc.) spaced by 2mm(fig.1.g). Tumor slices were stained with H&E and with a hypoxia marker (pimonidazole) by immunohistochemistry (IHC). Histological slices were scanned (Aperio AT2, Leica Biosystems) (fig.1.j) and loaded in MATLAB for co-registration with MRI(fig.1.k). The multi-blade holder and tumor cassettes were printed in a 3D-printer Object24 (Stratasys Ltd) with 0.022mm vertical resolution. Optimal 3D-alignment of MRI images and histological slices was estimated using non-monolithic optimization procedure consisted of outer and inner optimization problems. In each step, the outer optimization loop rotates and shifts the 3D-tumor surface reconstructed from MRI images and calculates contours obtained by its intersection with equally distant planes to mimic tumor slicing (fig.2.a). Those contours were used by inner optimization loop to find rotation of corresponding contours from histological slices that minimize the pixel-wise Euclidean distance between them. Both optimization loops utilized gradient-based algorithms implemented in MATLABs lsqnonlin function.RESULTS AND DISCUSSION
The tumor molds were accurate with no apparent gaps as demonstrated by microCT imaging (fig.1.f). The multi-blade knife(fig.1.g) permitted more accurate tumor slicing comparing to previous experiments using a single blade. Three-dimensional aligning of MRI images and histological slices was performed for all five mice. The area identified as a tumor by both MRI outline and aligned histology covered on average 80.6% ± 7.6% of the total area, that is area classified as a tumor by MRI outline or aligned histology. Some slices showed better co-registration than others(fig.2.b), this is expected due to different deformations of tissue during the fixation process. Representative multi-parametric images of a tumor are shown in Figure 3 with its correspondent habitats clustering and co-registered histological images. Tumor habitats clustering (fig.3.f) were similar to the hypoxic pattern observed in DCE-images and slices stained with pimonidazole (fig.3.h). These results are encouraging, and show that there is a tradeoff in how the various parameters are normalized in order to reflect image features of each map. Normalization was performed such that habitat clustering matched histological features.CONCLUSIONS
We have designed a complete workflow for the co-registration of multi-parametric MRI and histology. The results of automated 3D-alignment of MRI images and histological slices are promising and encourage further experiments using the presented workflow. Future improvements in co-registration will include a non-rigid algorithm using tumor features obtained from each parametric image instead of using just the tumor outline. Tumor habitats clustering showed encouraging results with similarities to the hypoxic pattern observed by IHC. This work will serve as a platform to assist the understanding of cancer MRI habitats and its correlation with histological images. Understanding imaging habitats will help monitor cancer evolution better and aid treatment decisions in the future without the need of invasive biopsies.Acknowledgements
This work has been supported by an NIH/NCI grant (1R01CA187532-01A1) on Imaging Habitats in Sarcoma and by the Small Animal Imaging Laboratory (SAIL) Core Facility at the H. Lee Moffitt Cancer Center & Research Institute, an NCI designated Comprehensive Cancer Center (P30-CA076292)
References
1. Lee, J., et al., Spatial Habitat Features Derived from Multiparametric Magnetic Resonance Imaging Data Are Associated with Molecular Subtype and 12-Month Survival Status in Glioblastoma Multiforme. PLoS ONE, 2015. 10(9): p. e0136557.
2. Ou, Y., et al. Non-rigid registration between histological and MR images of the prostate: A joint segmentation and registration framework. in 2009 IEEE Computer Society Conference on Computer Vision and Pattern Recognition Workshops. 2009.
3. Shah, V., et al., A method for correlating in vivo prostate magnetic resonance imaging and histopathology using individualized magnetic resonance -based molds. The Review of Scientific Instruments, 2009. 80(10): p. 104301.
4. Priester, A., et al., A system for evaluating magnetic resonance imaging of prostate cancer using patient-specific 3D printed molds. American Journal of Clinical and Experimental Urology, 2014. 2(2): p. 127-135.
5. Reynolds, H.M., et al., Development of a registration framework to validate MRI with histology for prostate focal therapy. Medical Physics, 2015. 42(12): p. 7078-7089.
Figures