0310
Understanding the relationship between R2* and R1 MRI biomarkers of hypoxia: insights from 786-0 renal cancer xenografts and patients with renal carcinoma1Centre for Imaging Sciences, University of Manchester, Manchester, United Kingdom, 2Division of Radiotherapy and Imaging, The Institute of Cancer Research, London, United Kingdom, 3Bioxydyn Ltd, Manchester, United Kingdom, 4Institute of Cancer Sciences, University of Manchester, Manchester, United Kingdom, 5Department of Radiology, The Christie NHS Foundation Trust, Manchester, United Kingdom
Synopsis
Quantification of tumour R2* and oxygen-induced ΔR2* and ΔR1 are being investigated as potential biomarkers of tumour hypoxia, but their relationship is complex and not well understood. Here, we used a validated R1 biomarker (oxygen refractory fraction, termed “Oxy-R”) to segment tumours into hypoxic and non-hypoxic sub-regions. This revealed a clear relationship between hypoxic status and native R2* and hyperoxia-induced ΔR2*. Preclinical findings were replicated in clinical data from patients with renal carcinoma. These data highlight the importance of heterogeneity-based analysis of tumours and provide further validation of Oxy-R as a biomarker of tumour hypoxia.
Purpose
Several MRI strategies are being investigated for delivering readily translational biomarkers of hypoxia1. Intrinsic susceptibility imaging (also termed blood oxygenation level dependent (BOLD) imaging) focuses on quantifying native effective transverse relaxation rate (R2*), or change in R2* (ΔR2*) induced by respiratory challenge with hyperoxic gas. Here, paramagnetic deoxyhemoglobin molecules in erythrocytes create magnetic susceptibility perturbations around blood vessels, increasing local native R2*. Tumour R2* decreases following inhalation of a hyperoxic gas, due to increased saturation of haemoglobin molecules with oxygen2.
In distinction, tumour R1 increases due to the presence of paramagnetic oxygen molecules (O2) dissolved in blood plasma or other tissue fluid. R1 change (ΔR1) is reported in well-oxygenated tissues following challenge with hyperoxic gas3. However in hypoxic tissue, inhaled O2 molecules bind preferentially to deoxygenated haemoglobin molecules and do not increase R1. Recent work suggests that perfused voxels refractory to oxygen challenge (defined as no increase in R1 and termed “Oxy-R”) identify and map tumour hypoxia4.
To attempt to understand the spatial relationship between native R2*, ΔR2* and ΔR1, we measured these biomarkers in a renal cell carcinoma xenograft model, where Oxy-R has already been established as a hypoxia biomarker4. We then sought to demonstrate clinical applicability by applying the same analysis to data from patients with renal cancer.
Methods
Preclinical study
Experiments were performed in compliance with licenses issued under the UK Animals (Scientific Procedures) Act 1986. Tumour cells were established from a sunitinib refractory subcutaneous 786-0 RCC xenograft (786-0-R). Tumours were propagated by injecting 3x10⁶ cells in 100µl of sterile PBS into the flanks of 8 week old female C.B17-scid mice. Tumours were typically used for experimentation at a volume of approximately 400mm3. Anaesthesia was induced with a 10 ml/kg intraperitoneal injection of fentanyl citrate plus fluanisone, midazolam and sterile water. Gas delivery (medical air or 100% oxygen) was continuous at 2 l/min through a nosepiece. Data were acquired on a 7T Bruker magnet.
Clinical study
Research ethics and local R&D review were obtained. All patients gave fully informed written consent. Patients with surgically resectable renal cell carcinoma (stage T1-3, N0, M0) were recruited. Patients were scanned supine with a body transit and receive coil. Gas delivery (medical air or 100% oxygen) was at 15 l/min through a non-rebreathing mask. Data were acquired on a 1.5T Philips Achieva magnet.
Data analysis
In both preclinical and clinical data, paired R2* measurement (breathing air, then 100% oxygen) was performed using multiple gradient echo acquisitions, either side of a dynamic inversion recovery R1-weighted oxygen-enhanced MRI (OE-MRI) acquisition. Gas switch was performed mid OE-MRI. ΔR1 and ΔR2* were calculated, where ∆Rx = Rx (O2) – Rx (air). Finally, DCE-MRI was used to define vascular enhancement. For perfused tumour the OE-MRI voxels were then classified as “Oxy-R” or as enhancing to oxygen challenge (termed “Oxy-E”).
Results
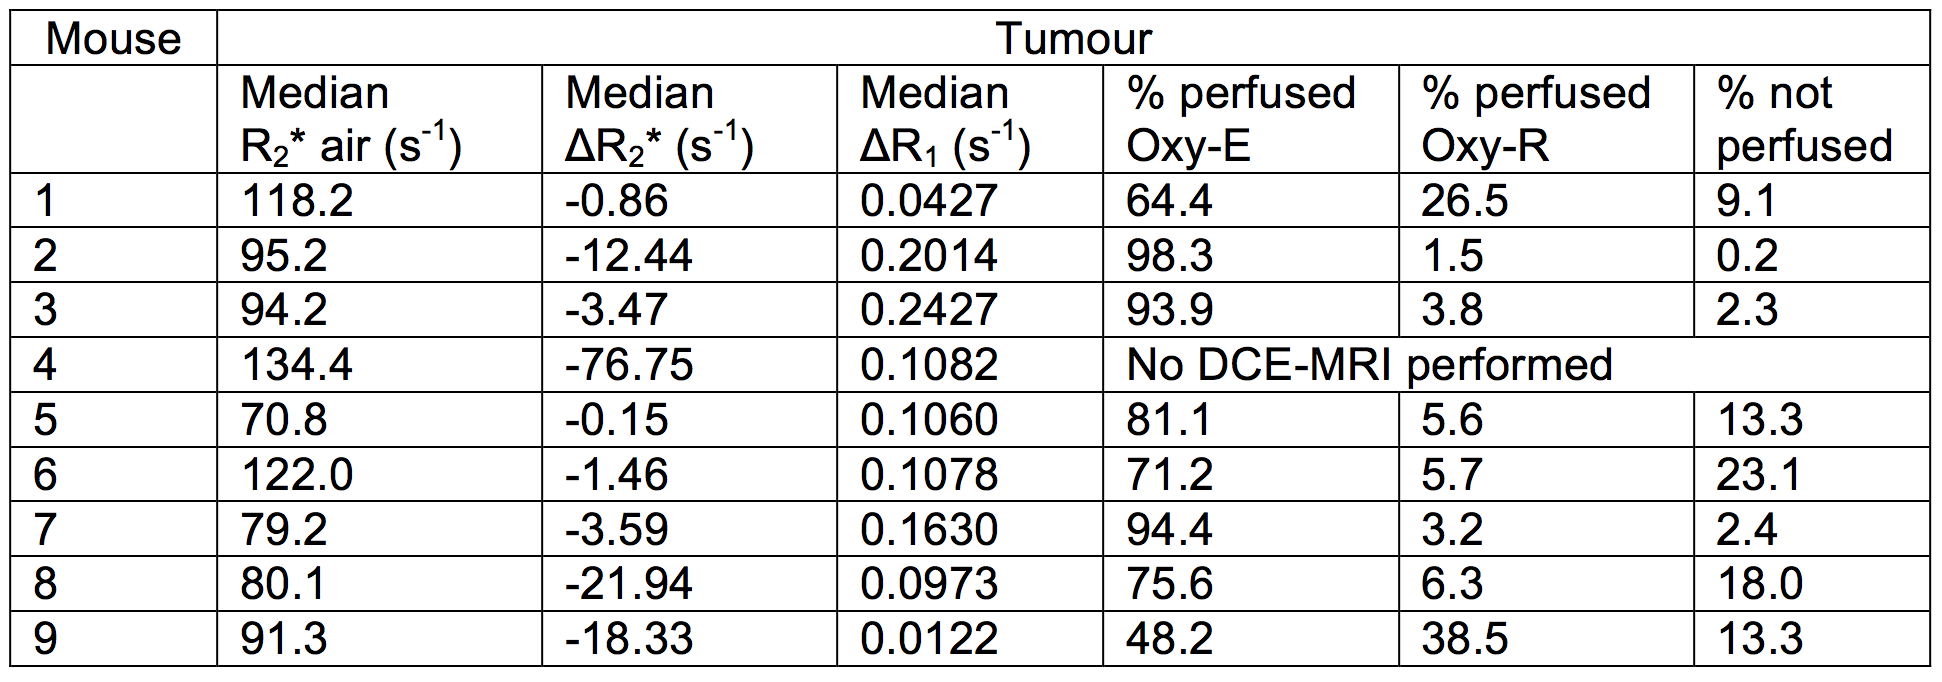
Preclinical data from nine 786-0-R tumours showed significant but weak relationships between ΔR1 and ΔR2* (both p<0.001; Figure 1; Table 1). When voxels were categorized by OE-MRI and DCE-MRI data – to define Oxy-R which identifies hypoxic tissue in 786-0-R tumours 4 – faster native R2* and greater negative ΔR2* were seen in the hypoxic sub-regions (both p<0.001). In all, 5815 voxels were included and analyzed, of which 9.8% were non-perfused, 79.8% had a normoxic profile and 10.4% had a hypoxic profile.
We then examined if equivalent findings were observed in clinical data. First, we evaluated the ΔR1 in the renal cortex as a positive control, since positive ΔR1 has been reported consistently in multiple studies of renal OE-MRI3. One patient failed to inhale the gas sufficiently to generate signal change in the renal cortex (only 3.0% of voxels were oxygen enhancing). This patient failed quality assurance. All other patients had significant positive renal cortex ΔR1 with 83.7 to 100% (average 95.4%) of voxels being Oxy-E (Figure 2).
Tumours from the six patients who passed quality assurance were analysed. Equivalent relationships were found between imaging biomarkers. Hypoxic tumour (identified as Oxy-R) had faster native R2* and greater negative ΔR2* (both p<0.001). Pathology H-score from Glut-1 analysis stratified patients into low and high hypoxic fractions (p=0.003) (Figure 3).
Conclusions
R1 and R2* based biomarkers of hypoxia have an underlying relationship that is driven by regional tumour hypoxia. Measuring average values of ΔR1, R2* and ΔR2* across tumours obscures this relationship. We propose that future work concentrates on mapping regional differences between hypoxic, normoxic and non-perfused tumour, rather than using ‘average value’ biomarkers.Acknowledgements
Support from CRUK and EPSRC Cancer Imaging Centre in Cambridge and Manchester funding to The University of Manchester (grant C8742/A18097); Cancer Research UK (CRUK) Clinician Scientist award (grant C19221/A15267); CRUK Cancer Imaging Centre funding to The Institute of Cancer Research (grants C1060/A10334 and C1060/A16464); Paul O’Gorman Postdoctoral Fellowship funded by Children with Cancer UK (grant 2014/176); The Wellcome Trust funding (grant 091763Z/10/Z)References
1. Tatum, J.L., Kelloff, G.J., Gillies, R.J., Arbeit, J.M., Brown, J.M., Chao, K.S. et al. Hypoxia: importance in tumor biology, noninvasive measurement by imaging, and value of its measurement in the management of cancer therapy. Int J Radiat Biol 82, 699-757 (2006).
2. Howe, F.A., Robinson, S.P., Rodrigues, L.M. & Griffiths, J.R. Flow and oxygenation dependent (FLOOD) contrast MR imaging to monitor the response of rat tumors to carbogen breathing. Magn Reson Imaging 17, 1307-18 (1999).
3. O'Connor, J.P.B., Jackson, A., Buonaccorsi, G.A., Buckley, D.L., Roberts, C., Watson, Y. et al. Organ-specific effects of oxygen and carbogen gas inhalation on tissue longitudinal relaxation times. Magn Reson Med 58, 490-6 (2007).
4. O'Connor, J.P., Boult, J.K., Jamin, Y., Babur, M., Finegan, K.G., Williams, K.J. et al. Oxygen-Enhanced MRI Accurately Identifies, Quantifies, and Maps Tumor Hypoxia in Preclinical Cancer Models. Cancer Res 76, 787-95 (2016).
Figures
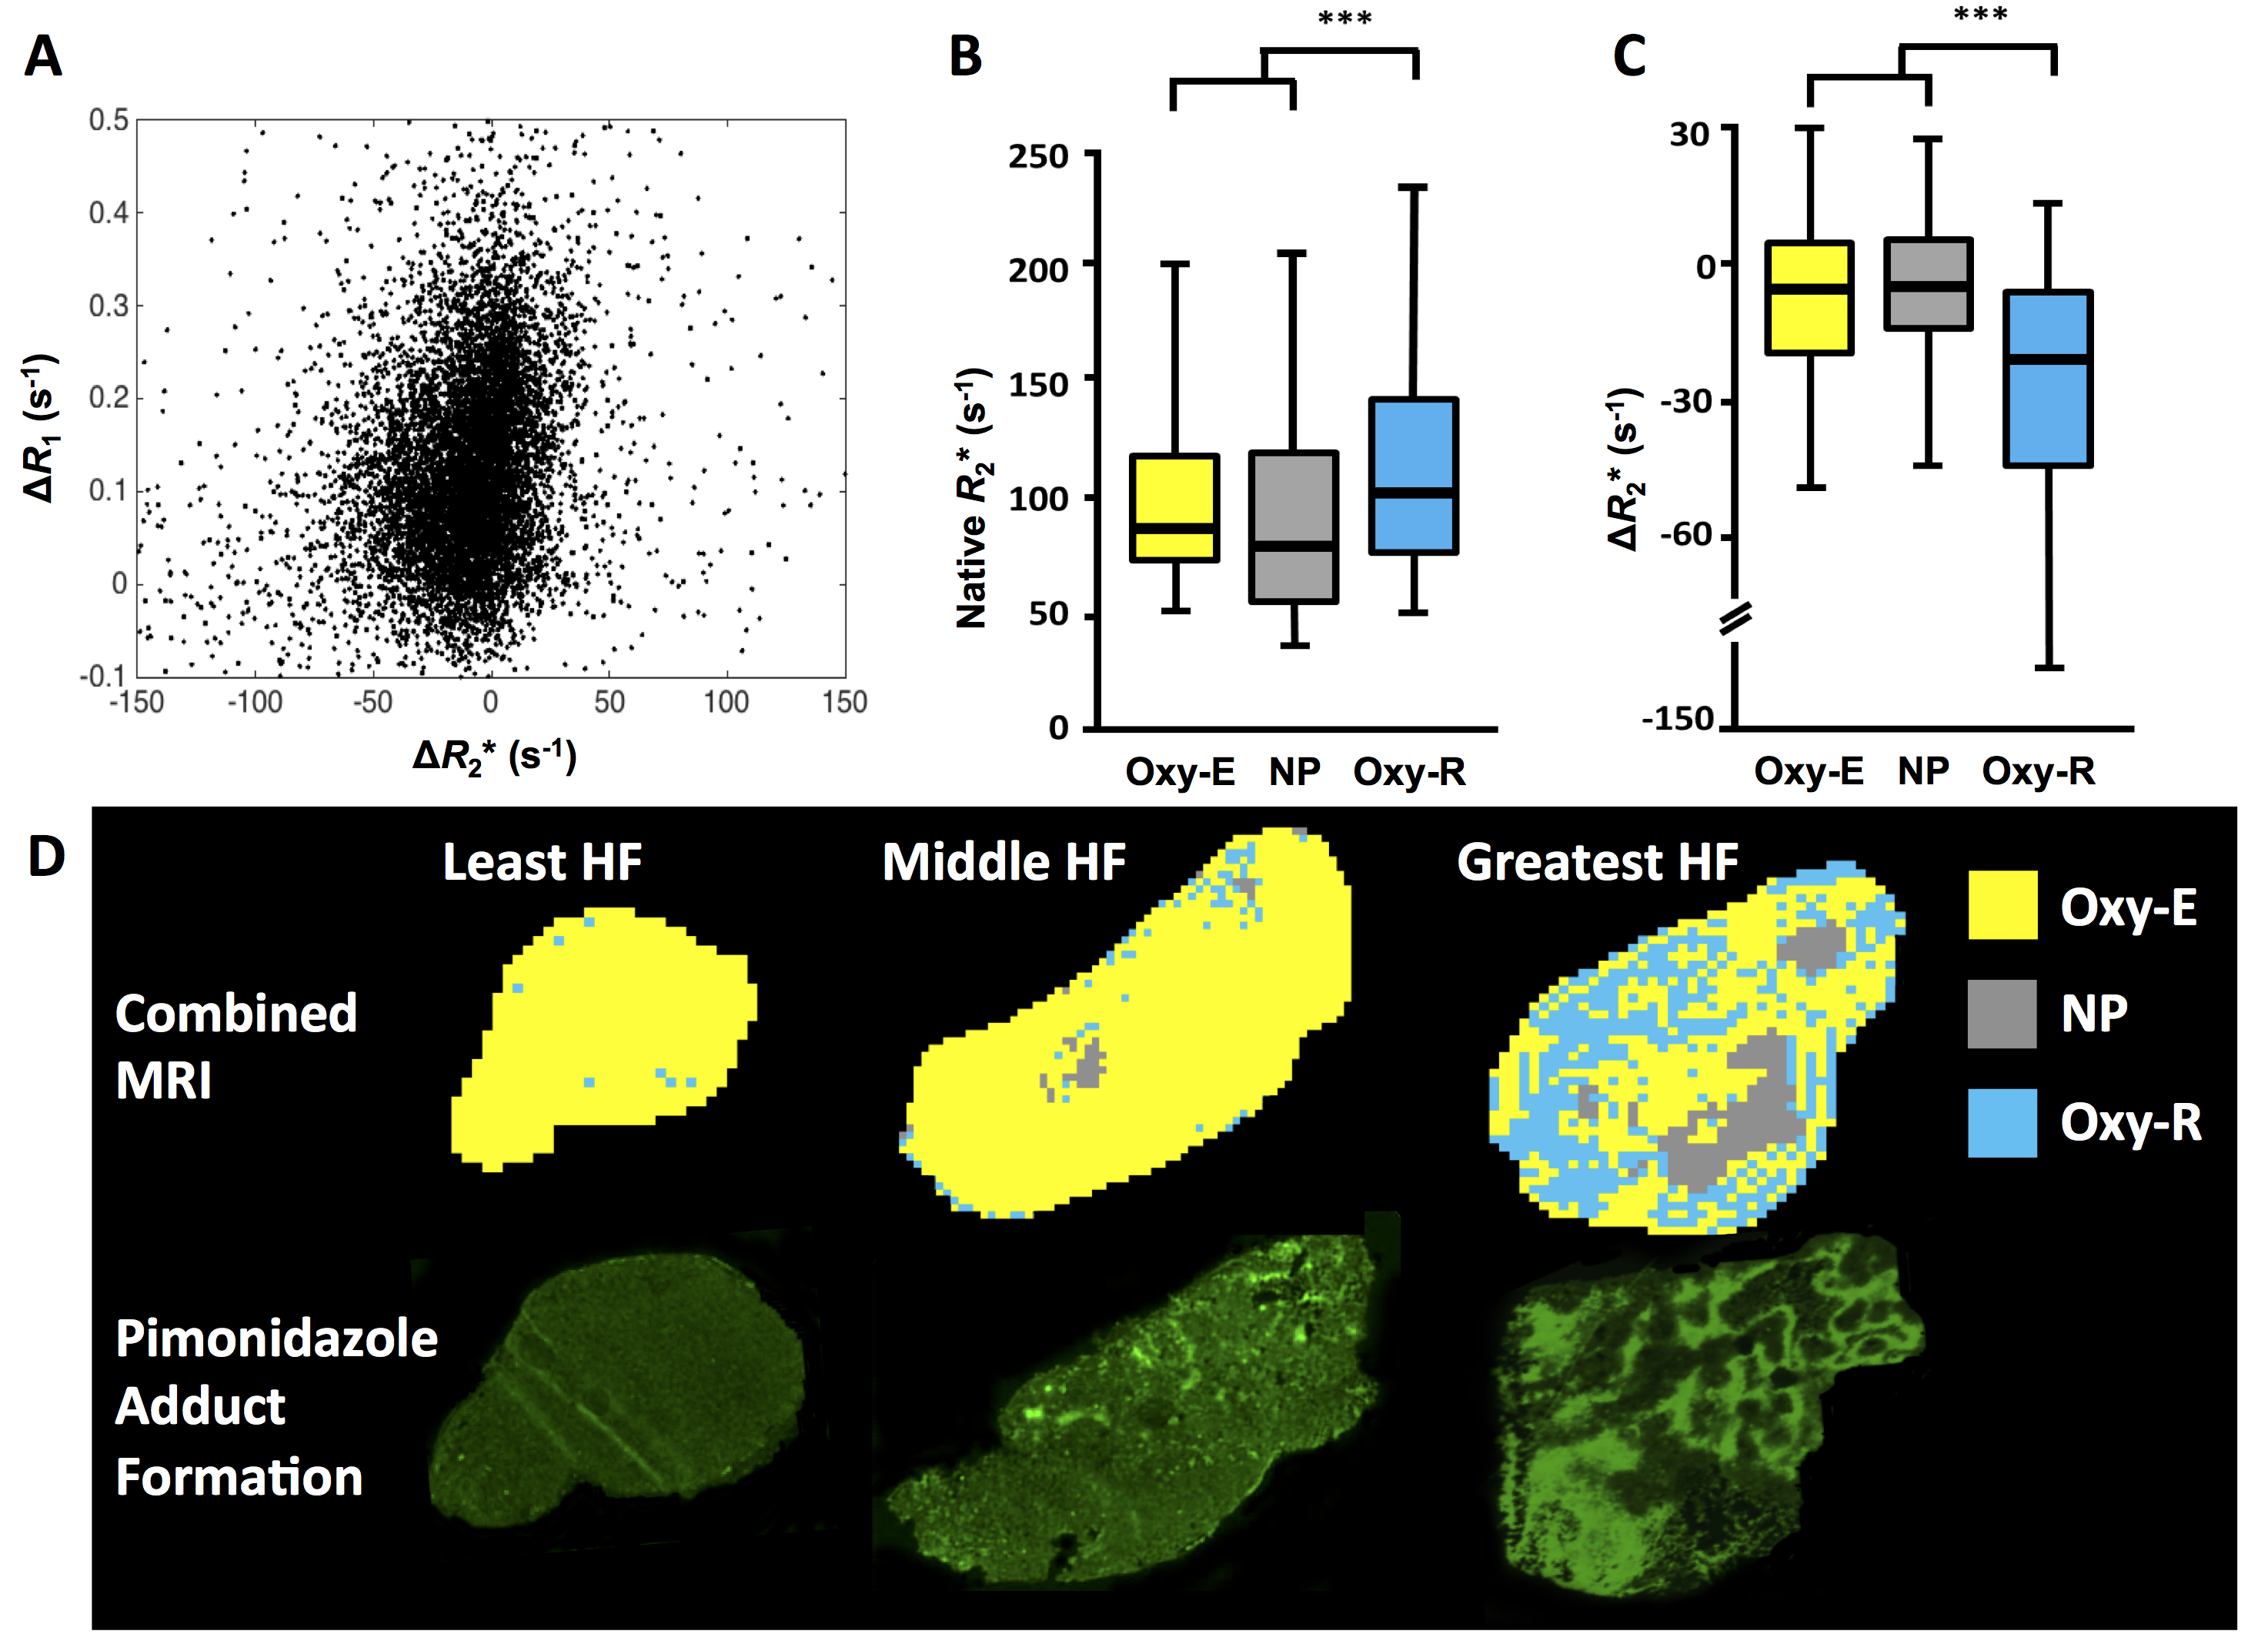
Figure 1: Relationship between biomarkers in seven 786-0-R tumours
A. Scatterplot of voxel-wise ΔR2* and ΔR1.
B-C. Relationship of native R2* and ΔR2* to tumour sub-regions classified by OE- and DCE-MRI signatures; box center is median; limits are 25th and 75th centiles; whiskers are 5th and 95th centiles.
D. Example maps of perfused Oxy-E, perfused Oxy-R and non-perfused sub-regions for three 786-0-R tumours, showing least, middle and greatest hypoxic fractions by pimonidazole adduct formation; HF hypoxic fraction).
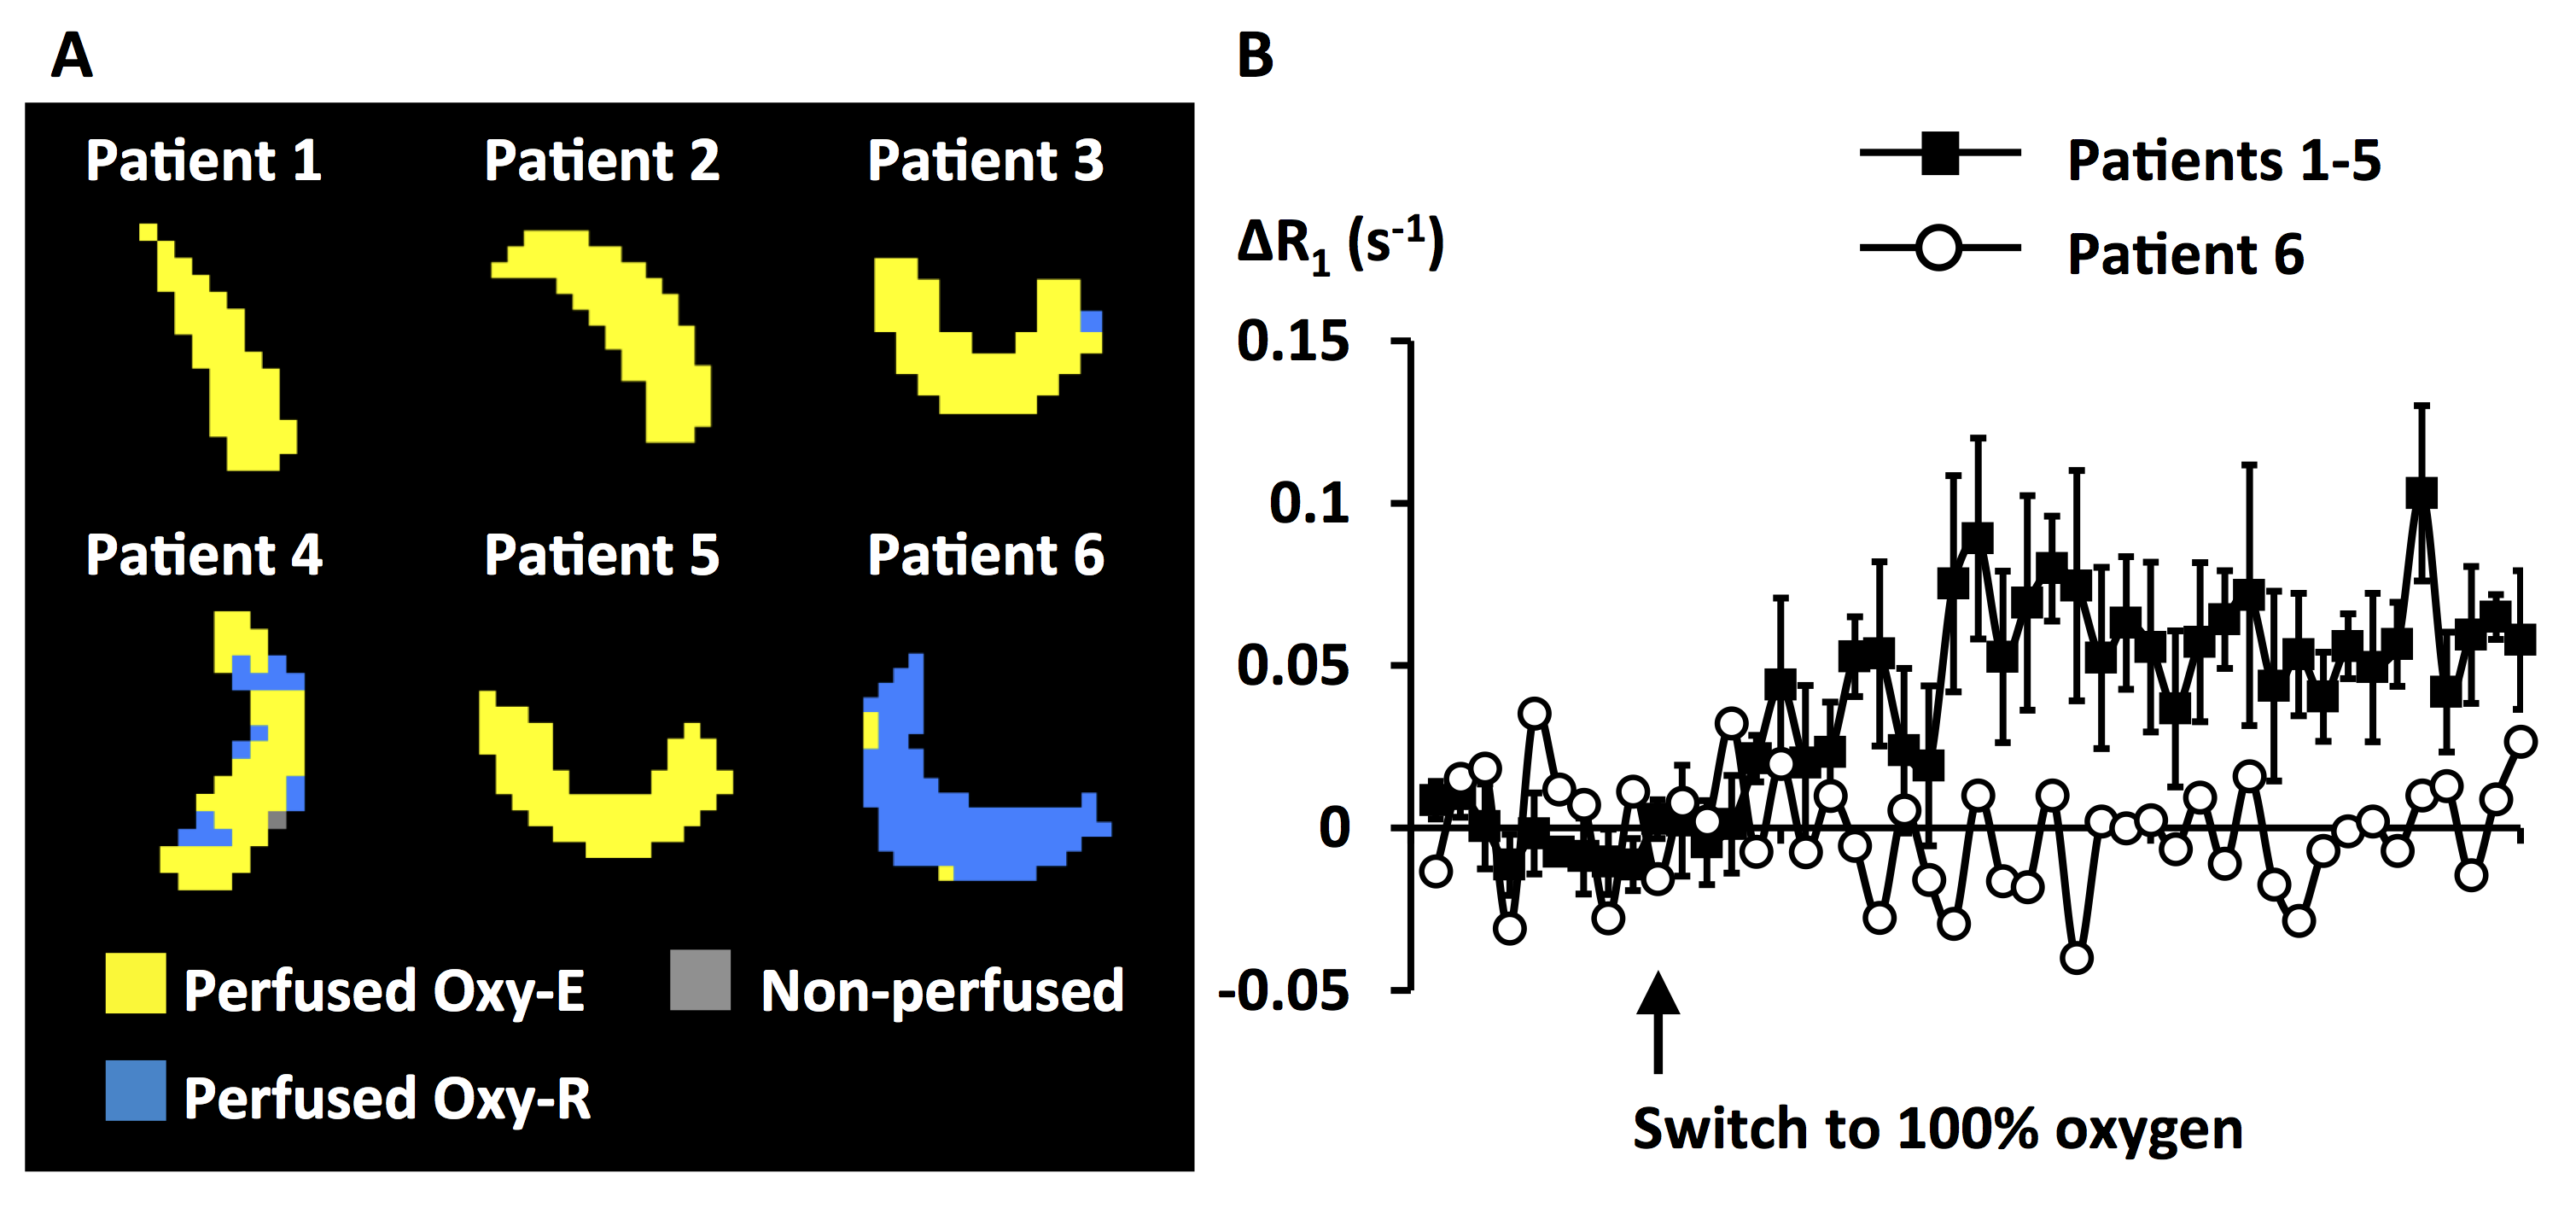
Figure 2: Quality assurance of clinical OE-MRI data
A: Maps from each patient renal cortex ROI shows that nearly all voxels are perfused Oxy-E in patients 1-5 but nearly all voxels are perfused Oxy-R in patient 6.
B: Median ΔR1 for each patient ROI were calculated. The average of the curves for patients 1-5 are shown (error bars are SEM) and show positive ΔR1 after switch from air to 100% oxygen. The curve for patient 6 shows no positive enhancement.
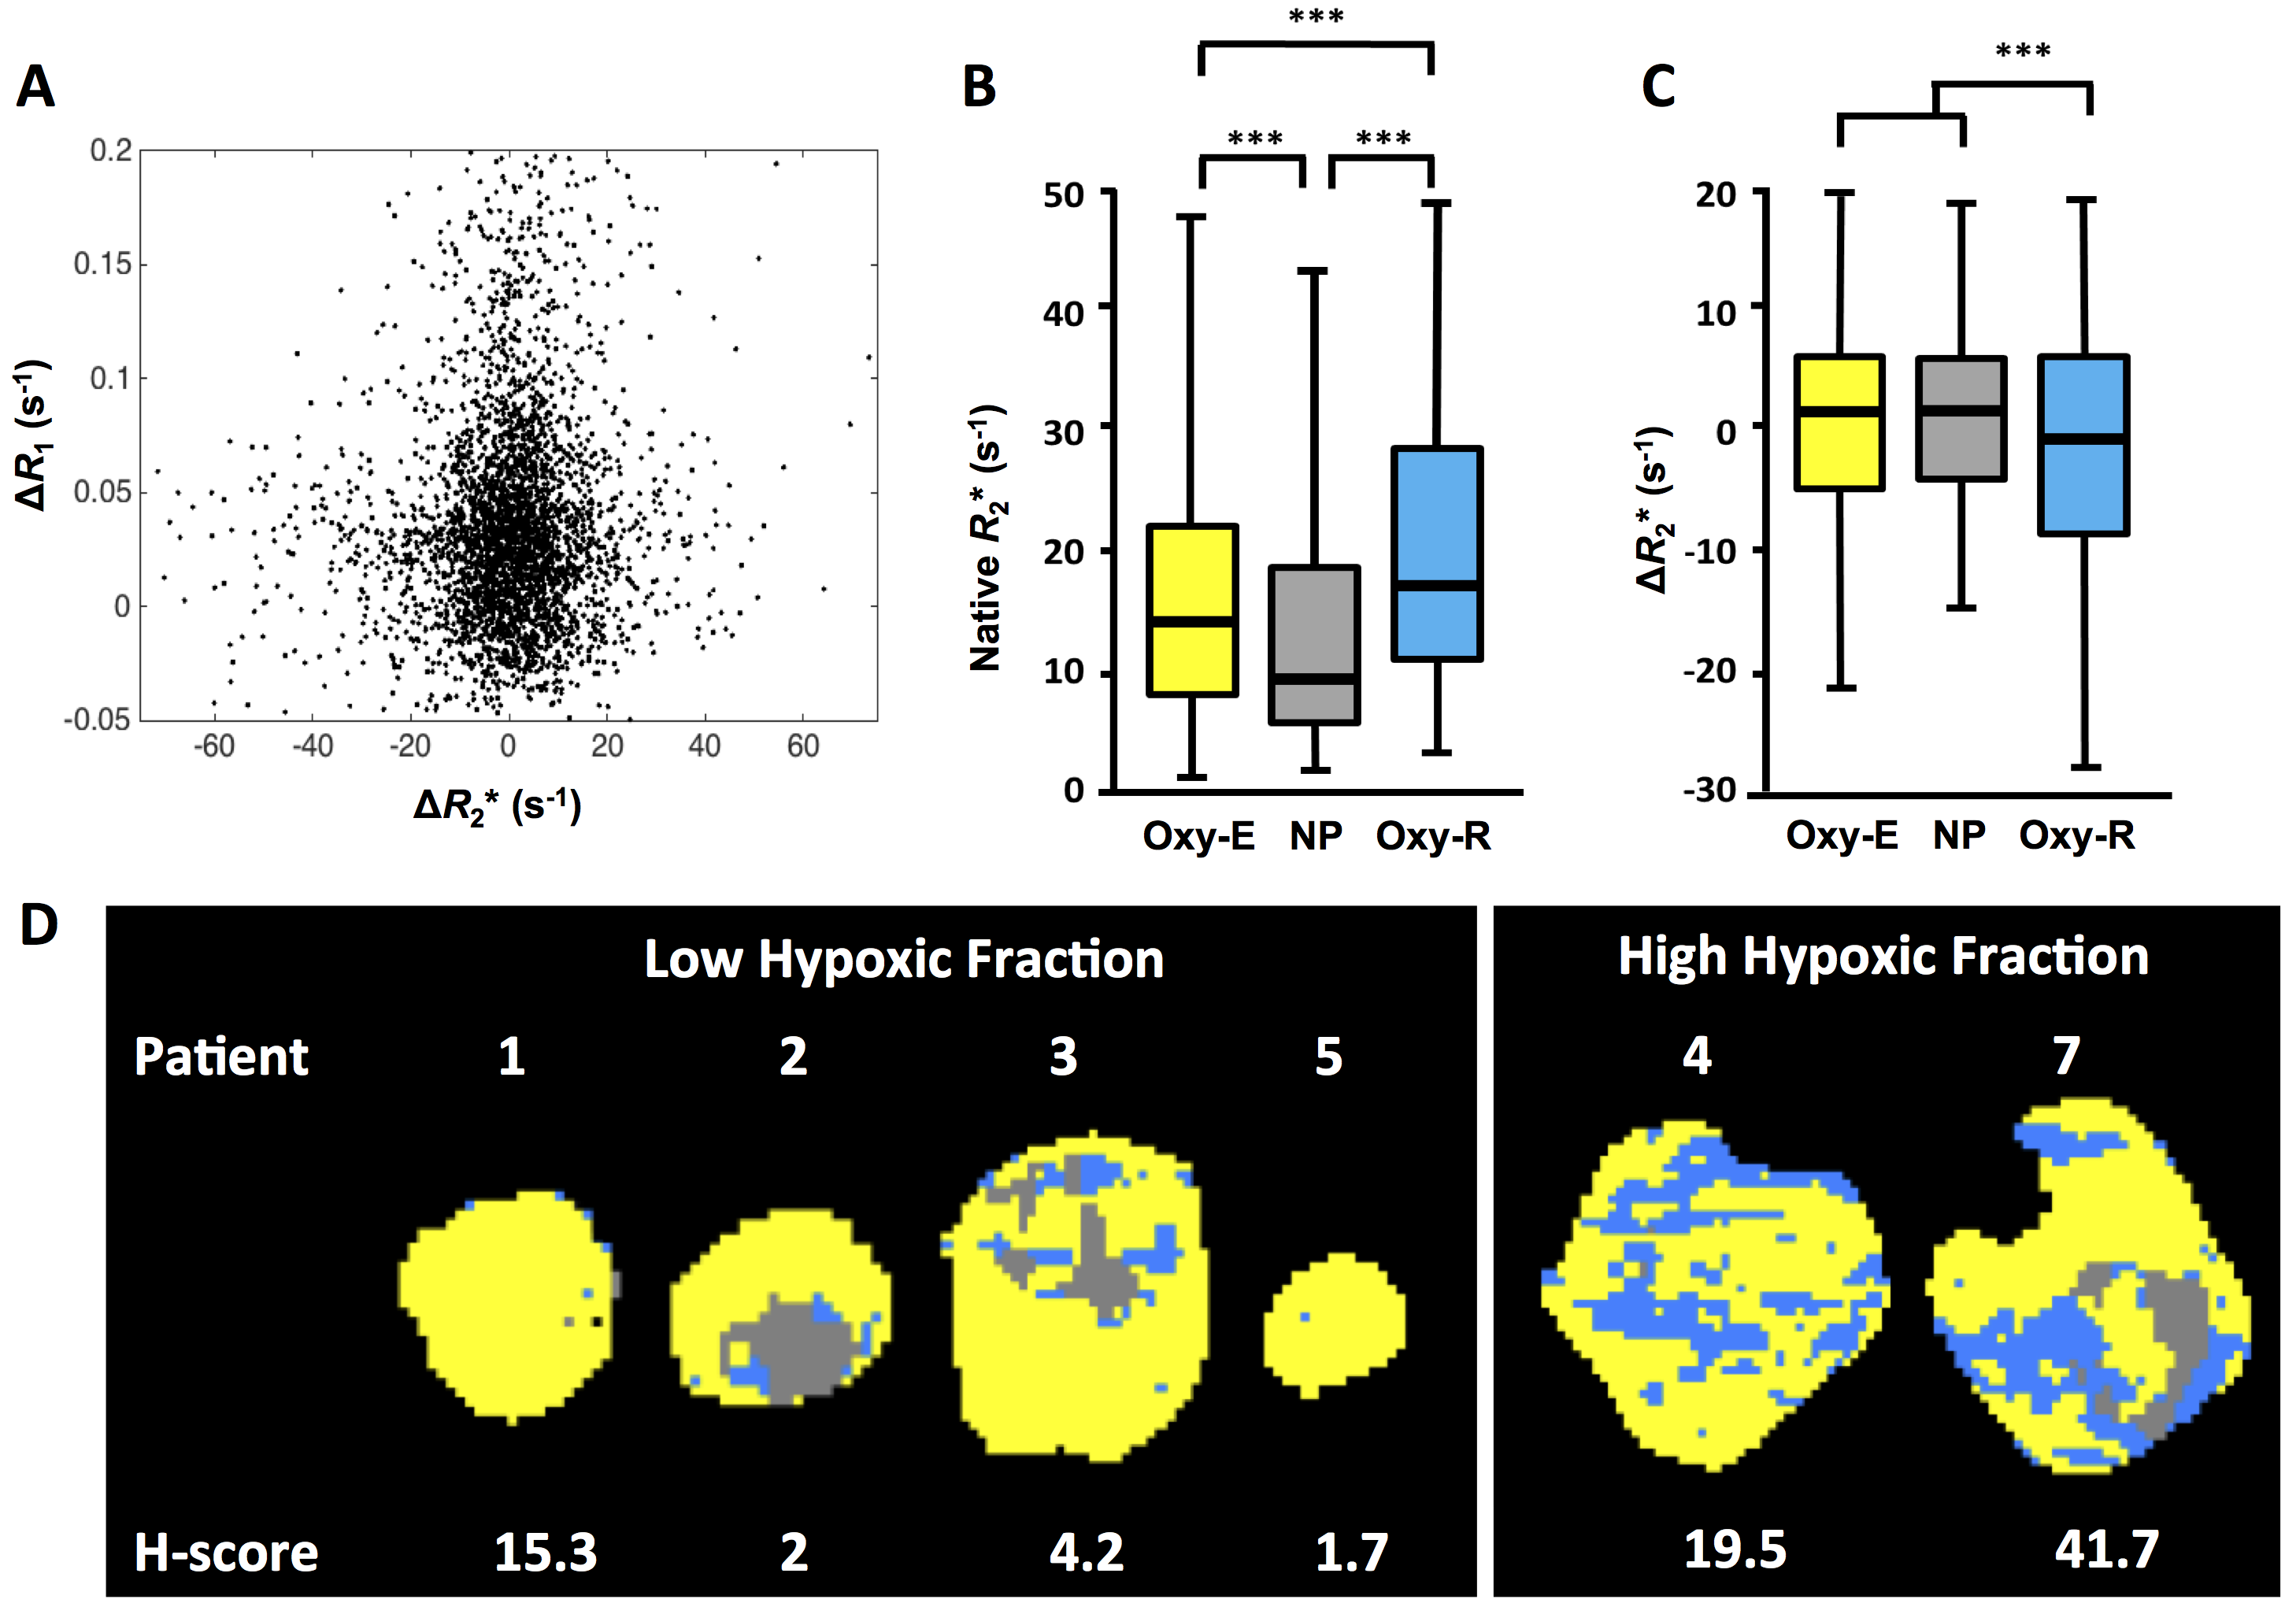
Figure 3: Relationship between biomarkers in six patients with renal cell carcinoma
A. Scatterplot of voxel-wise ΔR2* and ΔR1.
B-C. Relationship of baseline R2* and ΔR2* to tumour sub-regions classified by OE- and DCE-MRI signatures; box center is median; limits are 25th and 75th centiles; whiskers are 5th and 95th centiles.
D. Example maps of perfused Oxy-E, perfused Oxy-R and non-perfused sub-regions, categorized by Glut-1 H-score.