0307
Imaging of the Tumor Type-specific Microenvironment in Preclinical Cancer Models of Varying Malignancy1Memorial Sloan-Kettering Cancer Center, New York, NY, United States, 2Ulsan National Institute of Science and Technology, Ulsan, Korea, Republic of, 3Miller School of Medicine, University of Miami, Miami, FL, United States
Synopsis
An abnormal tumor microenvironment characterized by hypoxia, low extracellular pH (pHe), vascular abnormalities, and high tumor lactate has been associated with aggressive, treatment-resistant tumors. Using tumor models of different origin and malignancy, and focusing on prostate cancer, we investigated the relationship of lactate metabolism and vascularity, and, in selected models, localized pHe. We found differences in whole-tumor lactate concentrations between tumor models and successfully mapped lactate concentrations. Vascular blood flow and permeability varied significantly between tumor models in well-vascularized areas, while being similar across all models in hypoxic areas, emphasizing a need for spatial characterization of the tumor microenvironment.
Purpose
Aggressive, treatment-resistant tumors are often characterized by hypoxia, low extracellular pH (pHe), vascular abnormalities, and high tumor lactate1, the latter contributing to a suppressed T-cell immune response2. Here, we imaged tumor vascularity, lactate, and in selected models pHe, to identify relationships between lactate metabolism, tumor vascular abnormalities, and potentially pHe, in tumor models of different origin and aggressiveness, with a focus on prostate cancer.Methods
All experiments were performed in accordance with institutional animal care and use committee protocols.
Tumor Models: We studied 5 cancer cell lines, grown in Dulbecco’s Modified Essential Medium, supplemented with 10% fetal bovine serum, 100 U/ml Penicillin and 100 μg/ml Streptomycin at 37 °C in 5% CO2 and implanted subcutaneously in the flank of immune-compromised, male Nod/SCID mice: A tumorigenic human embryonic kidney (HEK) cell line, the 2 human prostate cancer (CaP) cell lines LAPC-4 (human advanced prostate adenocarcinoma, kindly provided by Dr. Sawyer3) and PC-3 (bone metastasis of human grade IV prostate adenocarcinoma4), as well as the 2 murine CaP cell lines MycCaP (spontaneously immortalized cells from C-Myc transgenic mouse with CaP, androgen naïve5) and RM-1 (CaP of Ras+Myc-transformed C57BL/6 mouse6).
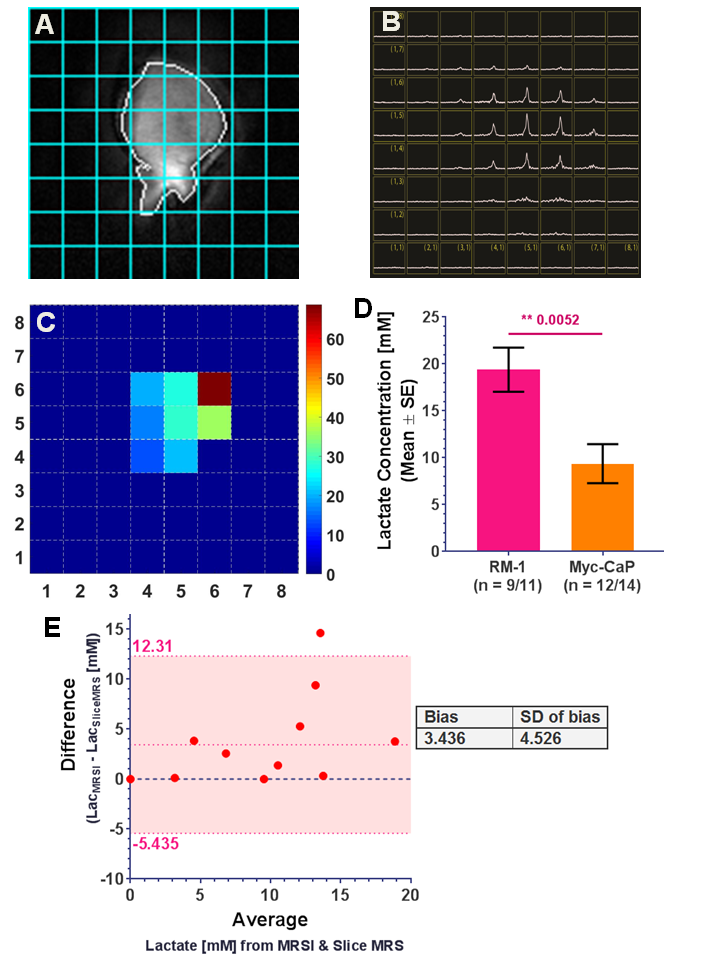
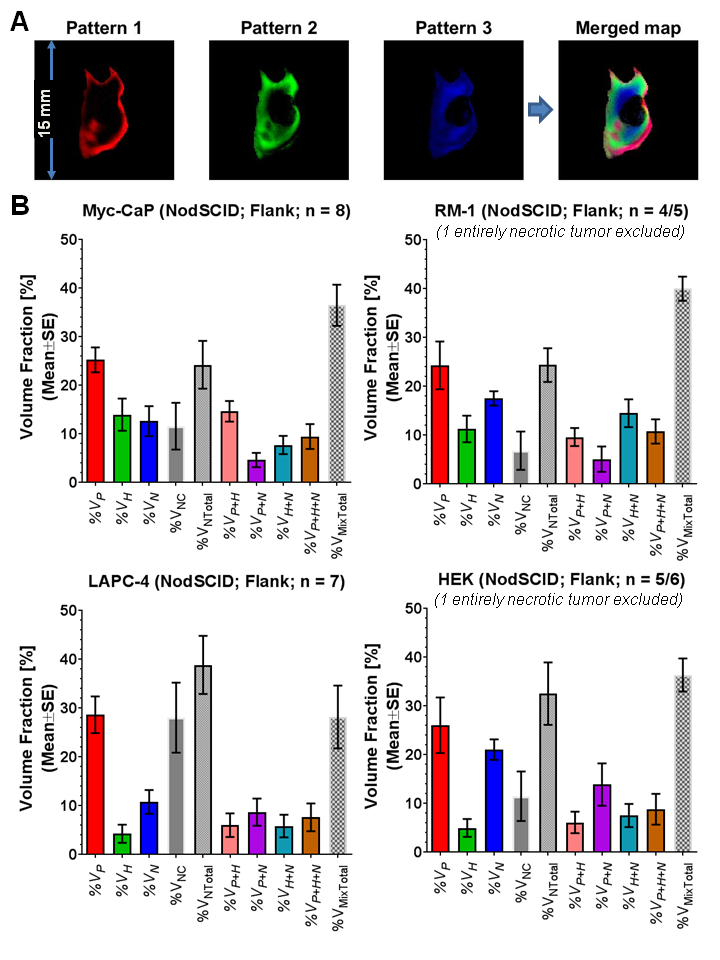
In Vivo MR: The MR experiments were performed on anesthetized, catheterized mice using a custom-built, solenoid 1H MR coil in a Bruker 7T magnet. After tumor positioning, tuning and matching of the MR coil, the water line width was shimmed to ~30-70 Hz full-width-half-maximum. The animal core temperature and breathing rate were maintained at 34-37°C and 50-95 breaths/min, respectively. Single-slice and localized (2 mm x 2 mm in-plane resolution) tumor lactate were measured using SelMQC7, with slice thickness varied based on tumor size. Data were analyzed using XsOsNMR. Lactate was quantified by the substitution method8-10, with a T1/T2 correction factor of 3.14, obtained from experimental in vivo and phantom lactate T1 and T2 relaxation times, as described previously11. Post lactate imaging, tumor vascularity was measured by dynamic contrast-enhanced (DCE)-MRI with the contrast agent gadopentetate dimeglumine (Gd-DTPA), as done previously12, using FLASH with a 117.2 µm x 117.2 µm in-plane resolution and 5 slices of 1 mm each. We quantified in vivo the spatial distribution of well-perfused, hypoxic, and necrotic areas from DCE-MRI data, using a previously established pattern recognition approach13, 14, with vascular blood flow and permeability estimated from signal-versus-time curves by the Hoffman15 model. In selected, vascularized tumors, pHe was assessed similarly to16, using ISUCA [(+/-)2-(imidazol-1-yl)succinic acid] infused at 0.6 mmol/kg for 20 min, and subsequently, 0.4 mmol/kg for 90 min17. Serial single-voxel 1H MR PRESS of a vascularized tumor area was used to detect accumulation of ISUCA16, 17. Localized whole-tumor CSI PRESS spectra (1 mm x 1 mm in-plane resolution) were acquired for selected tumors with detectable ISUCA16, 17. Using XsOsNMR or MNova, the chemical shift δ of the H2 ISUCA resonance (with reference to total choline at 3.2 ppm) was used to calculate pHe using the ISUCA-specific Henderson Hasselbalch equation16, 17: pHe = 7.07 + log[(8.7459-δ)/(δ-7.679)].
Results & Discussion
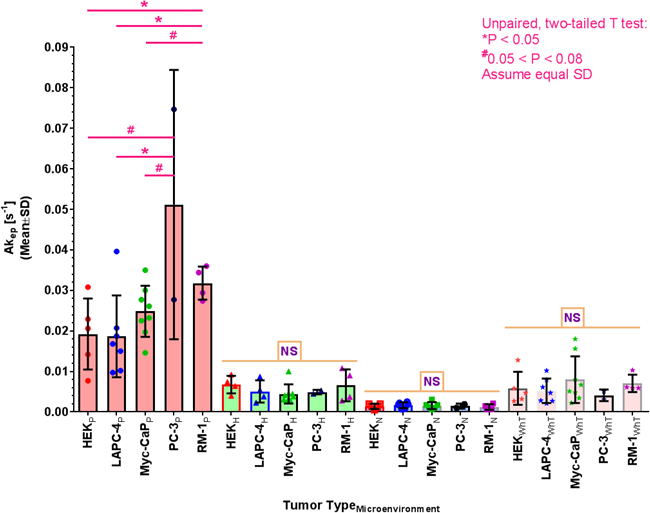
Using the substitution method, we successfully created quantitative lactate concentration maps, as shown for a representative RM-1 tumor in Figure 1A-C. For tumors with detectable lactate signals, we found that RM-1 tumors had significantly higher lactate levels than Myc-CaP tumors (Figure 1D). For both tumor types, we encountered 2 tumors each with no MR-detectable lactate signal, for which the cause is currently unexplained and which were excluded from the average shown in Fig. 1D. We also found that whole-tumor lactate, determined from MRSI (LacMRSI), was equal or somewhat larger than whole-tumor lactate, determined from single-slice MRS (LacSliceMRS) (Figure 1E). We imaged the spatial distribution of well-vascularized, hypoxic, and necrotic tumor areas, based on tumor vascularity as established previously13, and found slight variations of tumor volume fractions assigned to specific microenvironments between tumor types (Figure 2, PC-3 (n=2) not shown). As expected, vascular blood flow and permeability, depicted by Akep in Figure 3, is significantly higher in well-vascularized than in hypoxic and necrotic areas, as well as higher in hypoxic than necrotic areas. Further, while whole-tumor Akep is similar across tumor types, Akep of well-vascularized regions differs between tumor types (Figure 3). While pHe in vascularized regions was similar across selected tumor models (HEK, LAPC-4, Myc-CaP, and PC-3) and ranged from 6.95 to 7.27 pH units, localized pHe values across a tumor may vary widely and include pixels with pH values of up-to ~7.5 in different tumors (data not shown).Conclusions
We demonstrated the ability to spatially characterize the tumor microenvironment and are in the process of assessing the interplay between lactate metabolism, vascularity, and pHe.Acknowledgements
We acknowledge support by NIH / NCI grants R01 CA163980 (RGB), R01 CA172846 (RGB, JAK), R24 CA083084 (SAI Core), and P30 CA008748 (Cancer Center Support Grant).
We like to thank Dr. D.C. Shungu and Ms. X. Mao for the XsOsNMR software package, Dr. Rui V Simões for his contribution to the coil building, as well as Dr. S. Cerdan for his advice on measuring pHe with the pHe marker ISUCA.
References
1. Vaupel P. Tumor microenvironmental physiology and its implications for radiation oncology. Semin Radiat Oncol. 2004. Jul; 14(3):198-206.
2. Calcinotto A, Filipazzi P, Grioni M, Iero M, De Milito A, Ricupito A, Cova A, Canese R, Jachetti E, Rossetti M, Huber V, Parmiani G, Generoso L, Santinami M, Borghi M, Fais S, Bellone M, Rivoltini L. Modulation of microenvironment acidity reverses anergy in human and murine tumor-infiltrating T lymphocytes. Cancer Res. 2012. Jun 1; 72(11):2746-56.
3. Craft N, Shostak Y, Carey M, Sawyers CL. A mechanism for hormone-independent prostate cancer through modulation of androgen receptor signaling by the HER-2/neu tyrosine kinase [see comments]. Nat Med. 1999; 5(3):280-5.
4. Webber MM, Bello D, Quader S. Immortalized and tumorigenic adult human prostatic epithelial cell lines: characteristics and applications. Part I. Cell markers and immortalized nontumorigenic cell lines. Prostate. 1996. Dec; 29(6):386-94.
5. Watson PA, Ellwood-Yen K, King JC, Wongvipat J, Lebeau MM, Sawyers CL. Context-dependent hormone-refractory progression revealed through characterization of a novel murine prostate cancer cell line. Cancer Res. 2005. Dec 15; 65(24):11565-71.
6. Baley PA, Yoshida K, Qian W, Sehgal I, Thompson TC. Progression to androgen insensitivity in a novel in vitro mouse model for prostate cancer. J Steroid Biochem Mol Biol. 1995. May; 52(5):403-13.
7. He Q, Shungu DC, van Zijl PC, Bhujwalla ZM, Glickson JD. Single-scan in vivo lactate editing with complete lipid and water suppression by selective multiple-quantum-coherence transfer (Sel-MQC) with application to tumors. J Magn Reson B. 1995. Mar; 106(3):203-11.
8. Serganova I, Rizwan A, Ni X, Thakur SB, Vider J, Russell J, Blasberg R, Koutcher JA. Metabolic imaging: a link between lactate dehydrogenase A, lactate, and tumor phenotype. Clin Cancer Res. 2011. Oct 1; 17(19):6250-61.
9. Danielsen ER, Michaelis T, Ross BD. Three methods of calibration in quantitative proton MR spectroscopy. J Magn Reson B. 1995. Mar; 106(3):287-91.
10. Soher BJ, van Zijl PC, Duyn JH, Barker PB. Quantitative proton MR spectroscopic imaging of the human brain. Magn Reson Med. 1996. Mar; 35(3):356-63.
11. Ackerstaff E, Ramamonjisoa N, Lekaye HC, Zakian KL, Moroz E, Serganova IS, Blasberg RG, Koutcher JA. Similarity of in vivo lactate T1 and T2 relaxation times in different preclinical cancer models facilitates absolute quantification of lactate. 24th Scientific Meeting & Exhibition of the International Society for Magnetic Resonance in Medicine; 2016 May 07 – 13, 2016; Singapore, Singapore.
12. Cho H, Ackerstaff E, Carlin S, Lupu ME, Wang Y, Rizwan A, O'Donoghue J, Ling CC, Humm JL, Zanzonico PB, Koutcher JA. Noninvasive multimodality imaging of the tumor microenvironment: registered dynamic magnetic resonance imaging and positron emission tomography studies of a preclinical tumor model of tumor hypoxia. Neoplasia. 2009. Mar; 11(3):247-59, 2p following 259.
13. Stoyanova R, Huang K, Sandler K, Cho H, Carlin S, Zanzonico PB, Koutcher JA, Ackerstaff E. Mapping Tumor Hypoxia In Vivo Using Pattern Recognition of Dynamic Contrast-enhanced MRI Data. Transl Oncol. 2012. Dec; 5(6):437-47.
14. Han S, Stoyanova R, Koutcher JA, Cho H, Ackerstaff E. Automation of Pattern Recognition Analysis of Dynamic Contrast-Enhanced MRI Data to Assess the Tumor Microenvironment. 24th Annual Meeting & Exhibition of the International Society for Magnetic Resonance in Medicine; 2016 May 7-13, 2016; Singapore, Singapore.
15. Hoffmann U, Brix G, Knopp MV, Hess T, Lorenz WJ. Pharmacokinetic mapping of the breast: a new method for dynamic MR mammography. Magn Reson Med. 1995. Apr; 33(4):506-14.
16. Provent P, Benito M, Hiba B, Farion R, Lopez-Larrubia P, Ballesteros P, Remy C, Segebarth C, Cerdan S, Coles JA, Garcia-Martin ML. Serial in vivo spectroscopic nuclear magnetic resonance imaging of lactate and extracellular pH in rat gliomas shows redistribution of protons away from sites of glycolysis. Cancer Res. 2007. Aug 15; 67(16):7638-45.
17. Ackerstaff E, Kruchevsky N, Moroz E, Ramamonjisoa N, Simões RV, Lekaye HC, Zakian KL, Lee H, Cho H, Stoyanova R, Serganova IS, Blasberg RG, Koutcher JA. Assessment of the Tumor Type-Specific Microenvironment – Lactate, Vascularity, Hypoxia, Extracellular pH. 22th Scientific Meeting & Exhibition of the International Society for Magnetic Resonance in Medicine; 2014 May 10 – 16, 2014; Milano, Italy.
Figures