0296
k-t Accelerated Dual-Venc 4D flow MRI for Improved Flow Visualization in Pediatric Patients with Congenital Heart Disease1Department of Radiology, Northwestern University, Feinberg School of Medicine, Chicago, IL, United States, 2Department of Biomedical Engineering, Northwestern University, Chicago, IL, United States, 3Department of Medical Imaging, Ann & Robert H. Lurie Children's Hospital of Chicago, Chicago, IL, United States, 4Department of Pediatrics, Northwestern University, Feinberg School of Medicine, Chicago, IL, United States, 5Division of Cardiology, Ann & Robert H. Lurie Children's Hospital of Chicago, Chicago, IL, United States
Synopsis
This study explores the potential of using dual-velocity encoding 4D flow MRI for in-vivo assessment of complex blood flow patterns in patients with diverse presentations of congenital heart disease.
Purpose
4D flow MRI can be applied in patients with congenital heart disease for in-vivo assessment of complex 3D blood flow patterns in the heart and surrounding vessels.1 These patients often require assessment of a wide range of velocities, such as the slow venous flow seen adjacent to higher velocity arterial flow patterns in patients with single ventricle physiology. However, current 4D flow MRI techniques assess blood velocity based on one pre-defined velocity sensitivity encoding (venc), which is usually set above the maximum expected velocity. This single-venc method results in either velocity aliasing for velocities greater than the venc setting, or high noise levels for low velocities (v<<venc).2-4 To address this limitation, we developed a dual-venc 4D flow MRI sequence with k-t GRAPPA acceleration using a shared reference scan followed by two, three-directional (low and high-venc) scans.5 High-venc data was used to correct aliasing in the low-venc data, resulting in a dataset with the favorable velocity-to-noise ratio of a low-venc setting but without velocity aliasing. The purpose of this study was to evaluate the performance of k-t GRAPPA accelerated dual-venc 4D flow MRI in patients with congenital heart disease. We hypothesized that this technique would enable simultaneous acquisition of high and low velocities with reduced velocity noise and improved flow visualization by pathline and streamline integrity, resulting in improved 3D assessment of complex flow patterns.Methods
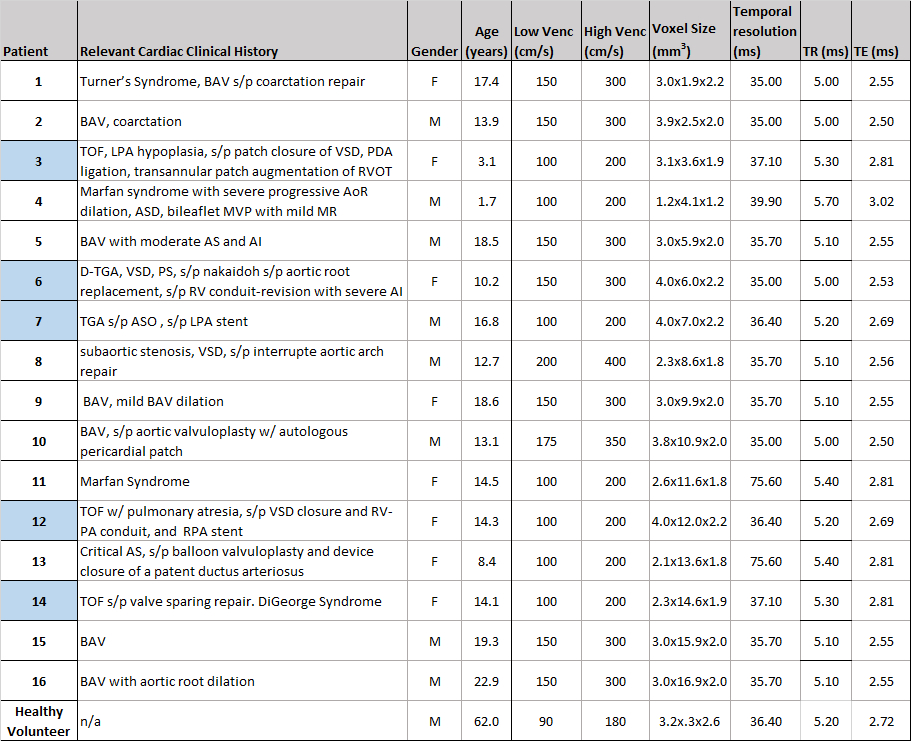
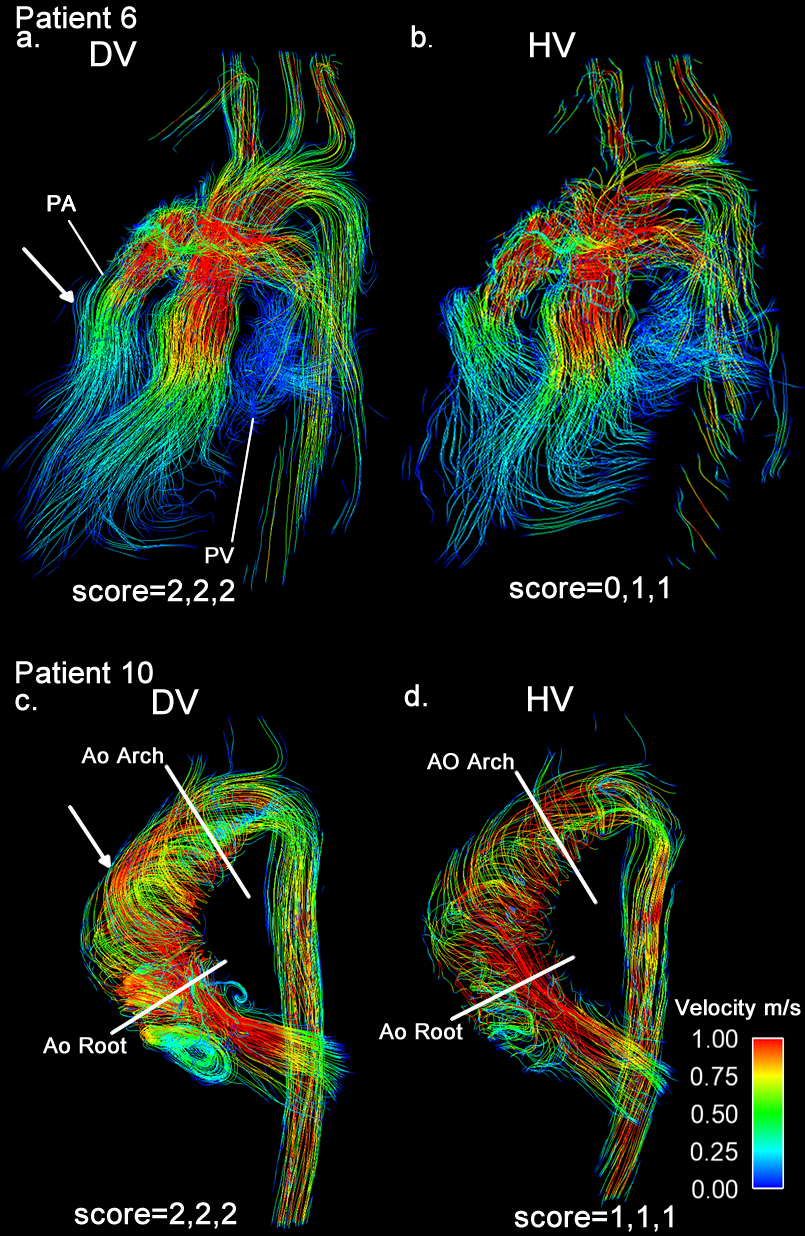
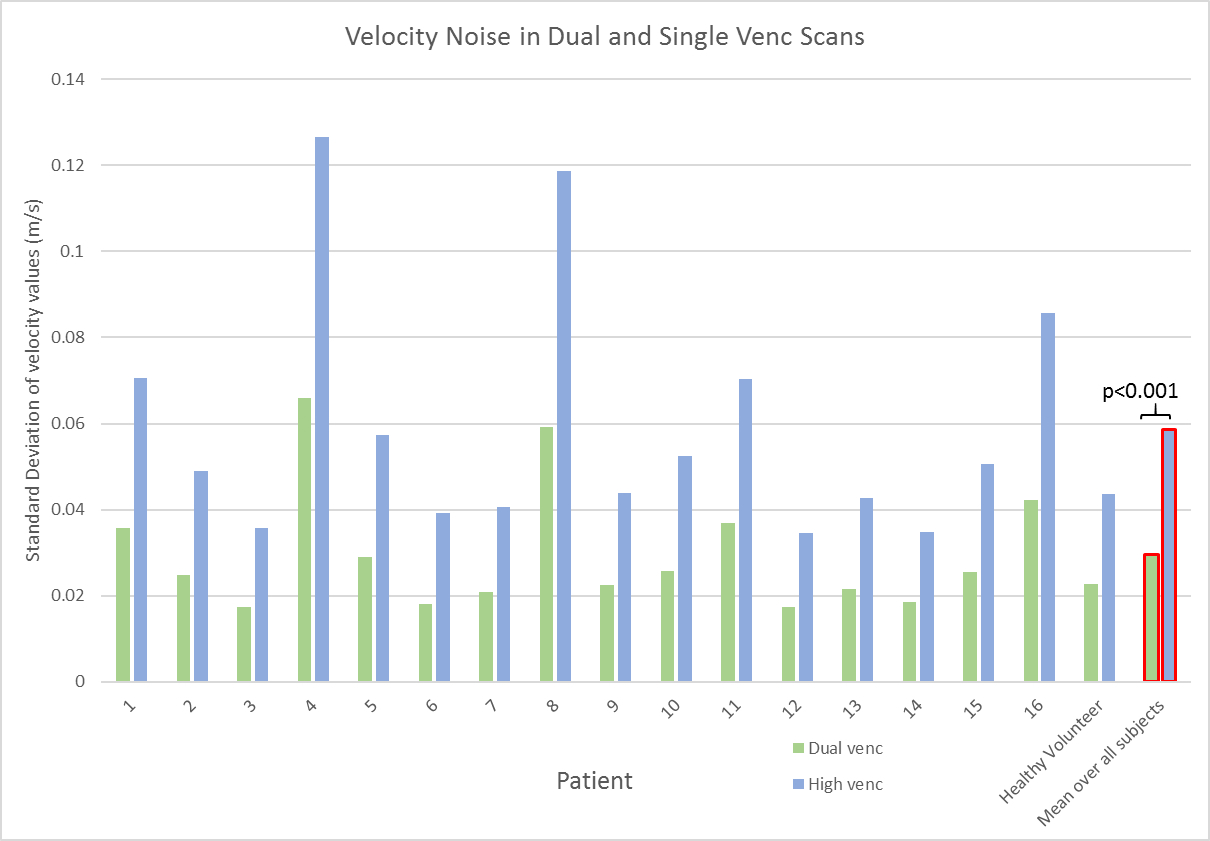
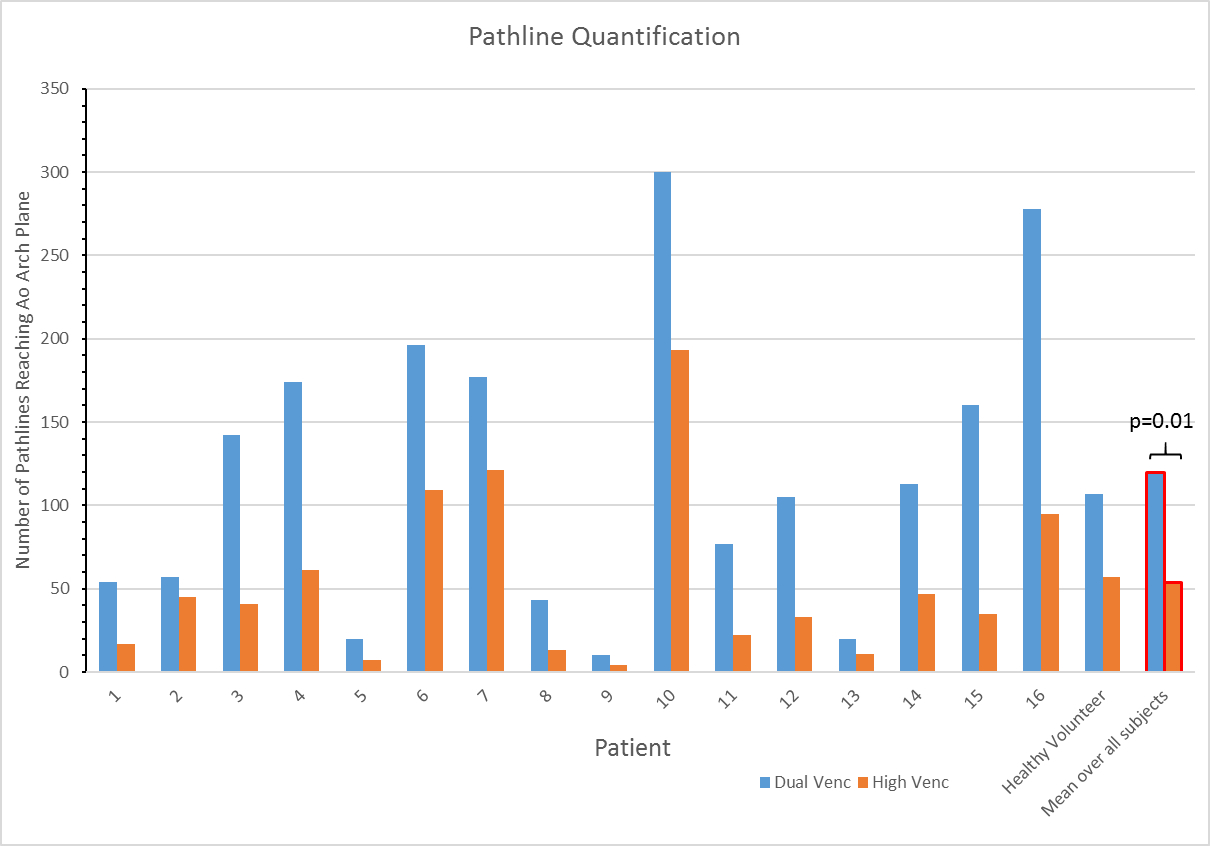
In addition to standard clinical contrast-enhanced cardiothoracic MRI, dual-venc 4D flow MRI was used to measure blood flow velocities in the thoracic aorta (12 patients) and whole heart (5) in 16 patients (8M/8, age=13.7±5.7years) with a history of congenital heart disease and one healthy volunteer (M, age=62.0years) (table 1). All scans were acquired on a 1.5T MAGNETOM Aera system (Siemens, Germany) with k-t GRAPPA, R=5, flip angle=15°, and scan-specific imaging parameters outlined in figure 1. Data analysis included corrections for Maxwell terms and eddy currents (Matlab, The Mathworks, USA). High-venc data was then used to correct aliased voxels in the low-venc data, resulting in an anti-aliased, dual-venc dataset. Velocity noise was calculated as the spatial mean of the temporal standard deviation in a static flow region of the velocity encoded images. The velocity noise in the same region was compared between high- and dual-venc datasets for each patient (figure 3). In addition, 3D PC-MR angiograms (PC-MRAs) were calculated and used as a basis for segmentation (MIMICS, materialize, Belgium) of the aorta (and pulmonary vessels in whole heart scans). 3D flow visualization by means of time-resolved pathlines and systolic streamlines (Ensight, CEI, USA) were used as indirect assessments of velocity noise. 2D analysis planes were placed at the aortic (Ao) root and arch adjacent to the first aortic branch (see figure 2). 150 pathlines per time-frame were emitted from the plane at the aortic root, and the number of pathlines intersecting the downstream plane (arch) was measured (figure 4). In addition, 150 streamlines were emitted at peak systole from segmented PC-MRA volumes, and side-by-side dual- and high-venc images for each patient (figure 2) were graded on a scale from 0 to 2 (0=poor, 1=moderate, 2=good) based on collinearity, streamline density, and overall image quality. Comparisons were made between high- and dual-venc datasets acquired in the same scan.Results
Dual-venc 4D flow data was acquired with a scan time of 12.8±7.1 minutes. Figure 2 depicts dual- versus high-venc streamlines and quality scores in two patients. Velocity noise and pathline quantification results are summarized in figures 3 and 4, respectively. Velocity noise was significantly reduced in dual-venc reconstructed images (49.6±1.7% reduction, p<0.001) and the proportion of pathlines emitted from the aortic root reaching the arch was significantly increased in dual-venc compared to high-venc data (162±89.6%, p=0.01). Dual-venc streamline images scored a total of 72%, 153%, and 110% higher than high-venc streamlines in collinearity, density, and overall image quality, respectively (p<0.0001).Discussion and Conclusions
The findings of this study show that k-t GRAPPA accelerated dual-venc 4D flow MRI can significantly reduce velocity noise and provide improved visualization of arterial hemodynamics in patients with varying presentations of congenital heart disease. Dual-venc acquisition successfully improved visualization of flow patterns across heterogeneous anatomy in various clinical phenotypes, (e.g. patent 6 with TGA causing high velocities in stenotic branch PAs with lower velocities in the mid/distal PA, and patient 10 with BAV and high velocity, helical outflow jets in the ascending Ao next to slower recirculation zones). Future investigations will include optimization of dual-venc 4D flow MRI and the corresponding reconstruction algorithm, for improved in-vivo quantification and assessment of a wide variety of cardiac malformation hemodynamics.Acknowledgements
Grant funding by NIH R01 HL115828, K25 HL119608, and AHA 16SDG30420005.References
[1] Markl, M., et al., Time-resolved 3D MR velocity mapping at 3T: Improved navigator-gated assessment of vascular anatomy and blood flow. Journal of magnetic resonance imaging, 2007. 25(4): p. 824-831.
[2] Nett, E.J., et al., Four-dimensional phase contrast MRI with accelerated dual velocity encoding. Journal of Magnetic Resonance Imaging, 2012. 35(6): p. 1462-1471.
[3] Callaghan, F.M., et al., Use of multi-velocity encoding 4D flow MRI to improve quantification of flow patterns in the aorta. Journal of Magnetic Resonance Imaging, 2016. 43(2): p. 352-363.
[4] Johnson, K.M. and M. Markl, Improved SNR in phase contrast velocimetry with five-point balanced flow encoding. Magnetic resonance in medicine, 2010. 63(2): p. 349-355. [5] Schnell S, Wu C, Garcia F, Murphy I, Markl M, Intracranial k-t Accelerated Dual-Venc 4D flow MRI. Proceedings ISMRM 2015, abstract 4543.
Figures