0294
Post-surgical changes in aortic wall shear stress patterns in patients with aortopathy: a follow-up 4D flow MRI study1Department of Radiology, Northwestern University, Chicago, IL, United States, 2Department of Cardiac Sciences, University of Calgary, Calgary, AB, Canada, 3Division of Surgery-Cardiac Surgery, Northwestern University, Chicago, IL, United States, 4Department of Radiology, Academic Medical Center, Amsterdam, Netherlands, 5Department of Biomedical Engineering, Northwestern University, Chicago, IL, United States
Synopsis
Our purpose was to follow up post-surgical changes in peak wall shear stress (WSS) and extent of at-risk tissue using 4D flow MRI in 34 aortopathy patients. Highly variable changes between pre- and post-surgery were found according to the intervention or replaced aortic valve type, while WSS patterns were unchanged in 20 other patients who did not undergo surgery. The reproducible 4D flow MRI WSS indices should be studied in larger cohorts and compared with patient outcome to potentially detect risk of future events in aortopathy patients, while optimizing the extent of resected aortic tissue.
INTRODUCTION
Arterial wall shear stress (WSS) plays a major role in the regulation of cellular function and remodeling via endothelial mechanotransduction1 and can be altered in patients with a bicuspid aortic valve (BAV)2. A recent 4D flow MRI study demonstrated that aortic regions with an abnormally increased WSS exhibited significant alterations of elastin fibers and extracellular matrix implicated in aortic wall degeneration3. On the other hand, surgical management of patients with aortopathy, which is currently based on aortic size and growth measurements4, has been shown to be inconsistent5. Better identification of patients who are at high risk for progressive aortopathy, while limiting overly aggressive aortic resection, is needed. The purpose of this follow-up 4D flow MRI study was to investigate post-surgical changes in WSS patterns in patients with aortopathy.METHODS
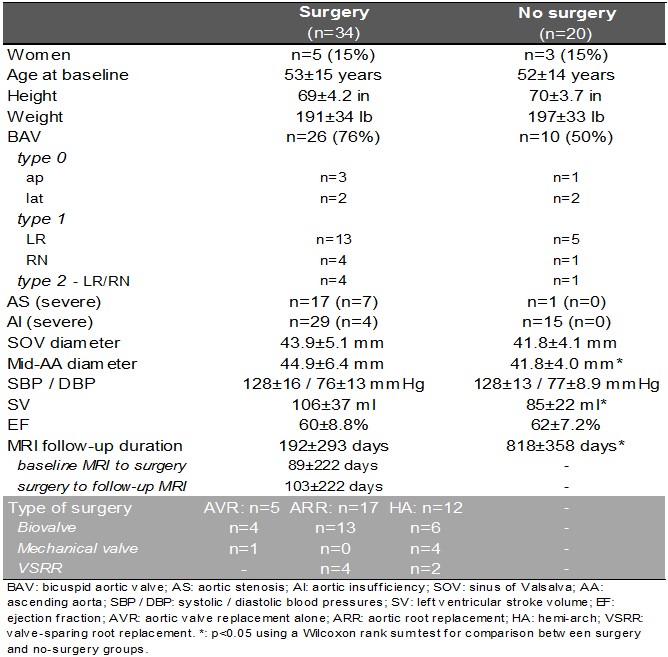
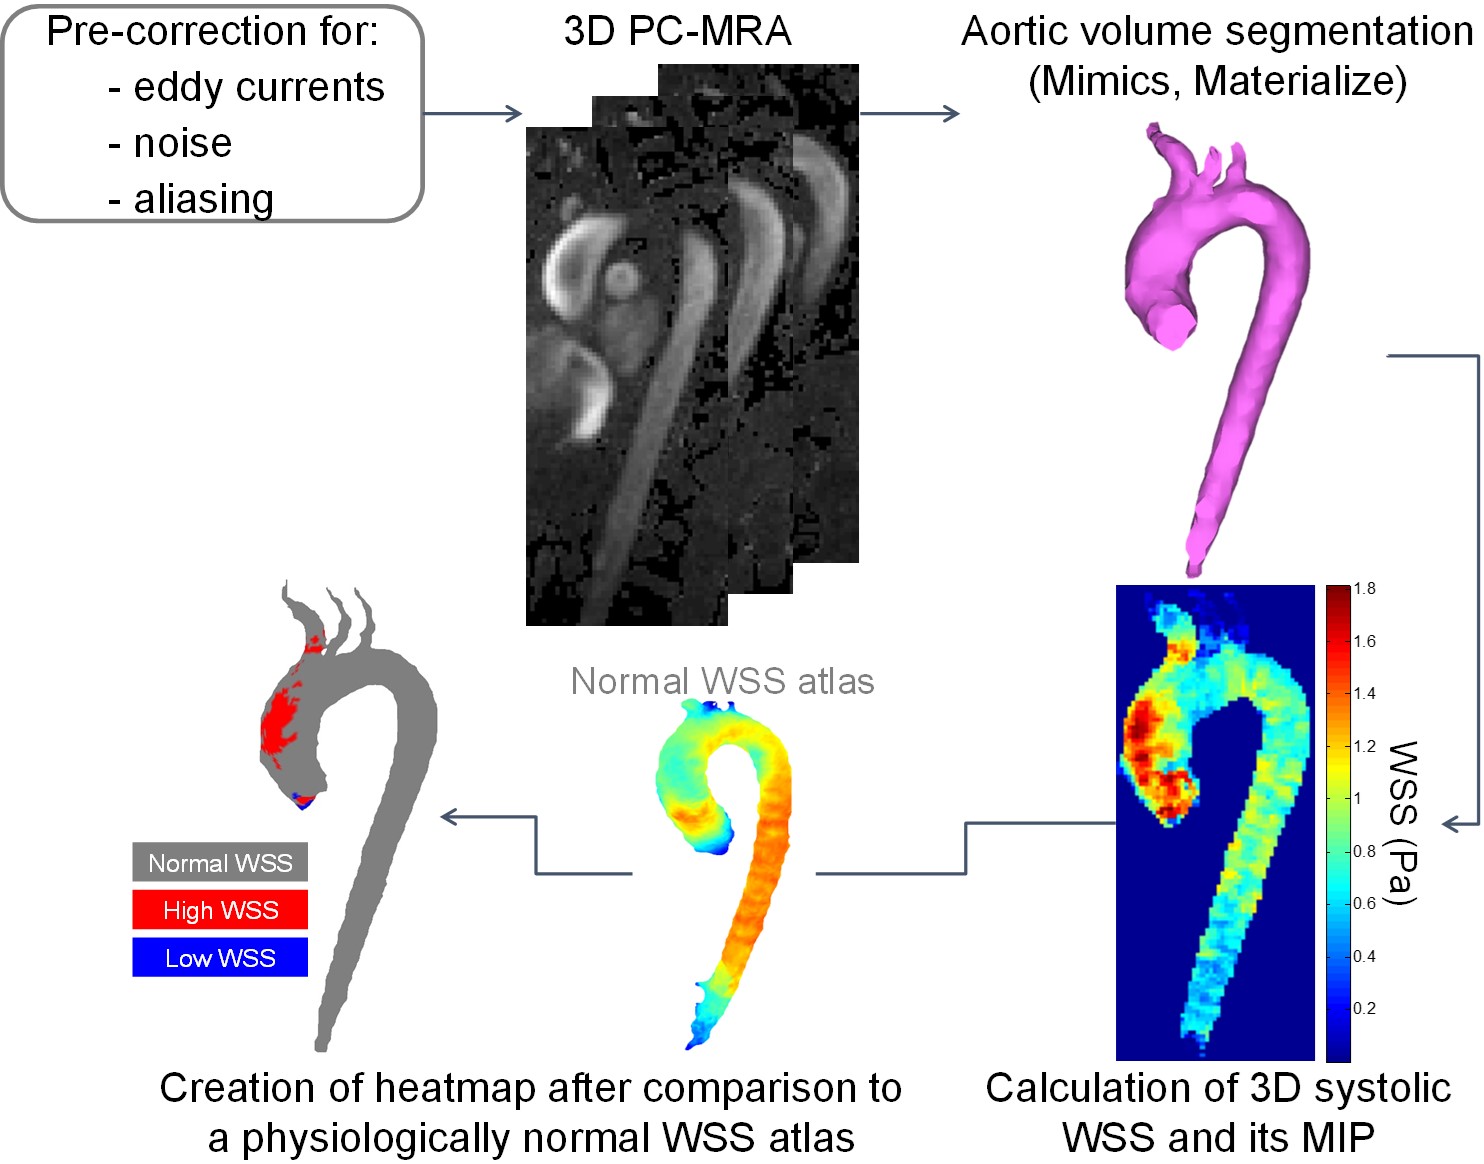
We included 34 patients with aortopathy scheduled for aortic valve replacement (AVR) and/or aortic repair who underwent two 4D flow MRI exams (before and after intervention). Five had AVR alone with no resection of the aorta. Seventeen had aortic root replacement (ARR) and 12 had hemiarch repair (HA), among which 23 had concomitant AVR (Table 1). In addition, 20 “control” aortopathy patients who underwent baseline and follow-up routine surveillance MRI but no surgery were included. Thus, a total of 108 4D flow MRI studies were obtained, on 1.5T and 3T scanners (Siemens, Germany), using the following parameters: prospective ECG and respiratory gating, TE/TR/FA=2.2–2.8ms/4.5–5.4ms/7–15°, spatial resolution=2.2–3.8x1.7–2.7x2.2–3.0mm3, temporal resolution=36-43ms and encoding velocity=150-400cm/s. After conventional analysis of 4D flow MRI data6, systolic WSS, which was averaged over 5 systolic phases, was calculated throughout the entire 3D aortic surface7 (Figure 1). Furthermore, an aortic ‘heatmap’ was created, providing tissue regions with a WSS outside of the 95% confidence interval of normal values previously established in 56 healthy volunteers8. Finally, WSS patterns in the proximal aorta, comprising the ascending aorta and the arch, were evaluated based on (Figure 1): 1) peak WSS magnitude, defined as the averaged 2% highest values calculated from WSS maximal intensity projections using custom software; 2) ‘at-risk’ tissue area exposed to abnormally high WSS, calculated from the heatmap, expressed in percentage of the total area. Of note, in surgery patients, both indices were estimated while excluding the area to be resected (pre-surgery)/the graft (post-surgery). In order to assess reproducibility, baseline and follow-up aortic volume was segmented in 10 surgery patients and 10 controls (40 studies) by two blinded operators.RESULTS
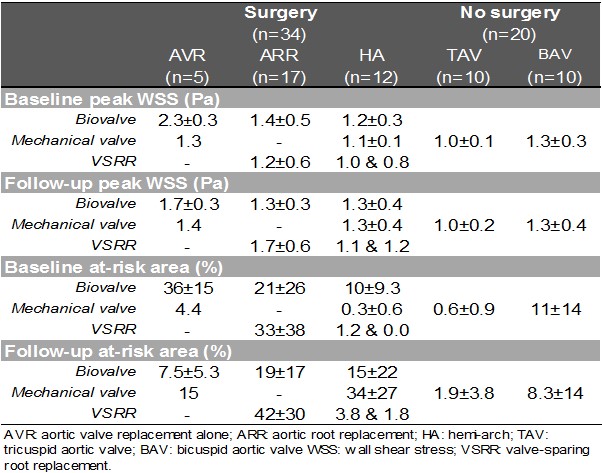
Inter-observer variability of the aortic at-risk tissue was low (mean biases [limits of agreement]: 0.4[-5.4;6.3]%/0.0[-6.3;6.3]% in surgery patients; 0.6[-2.9;4.1]%/0.1[-2.2;2.5]% in controls, for baseline/follow-up 4D flow MRI exams, respectively). Table 2 summarizes baseline and follow-up aortic peak WSS as well as at-risk tissue area, indicating overall small changes in peak WSS between baseline and follow-up in both groups, except in AVR patients who received biovalves. However, at-risk tissue area was more variable between baseline and follow-up in surgery patients, while it remained more stable in controls, despite longer follow-up durations (Figure 2). All biovalve AVR patients had lower aortic peak WSS (as reflected by ratio<1) and less extended at-risk area (as reflected by difference <0) after surgery than before, while in the remaining surgery ARR and HA groups, results were more heterogeneous with biovalves. Conversely, most of patients who received a mechanical valve or underwent valve-sparing procedures, had higher peak WSS and larger at-risk area at follow-up than at baseline.DISCUSSION
Our main finding is that highly heterogeneous responses to surgery were observed, while WSS patterns were overall unchanged in patients who did not undergo surgery (mean follow-up duration >2 years). Previous studies reported good reproducibility for WSS calculation from 4D flow MRI data9. Our study confirms these findings (low inter-observer variability of at-risk tissue area measurement). These inter-observer differences were lower compared to differences observed between follow-up and baseline, indicating the potential of 4D flow-derived WSS to reliably detect regions with altered wall shear forces. Future studies including associations with patient outcome should be performed to help identifying robust indices to refine the risk of future events, such as dilatation or rupture, while optimizing the extent of aortic tissue to be resected. The main limitation of our work is the low number of patients in each surgery sub-group as well as the variability in follow-up durations.CONCLUSION
This follow-up 4D flow MRI study revealed changes after surgery in at-risk tissue area, which remained stable in control patients who did not have surgery. Larger studies including outcomes are warranted to further explore the effect of surgery on WSS patterns.Acknowledgements
Grant support by the American Heart Association [16POST27250158] and National Institutes of Health [R01HL115828 and K25HL119608].References
1. Dolan JM, Kolega J, Meng H. High wall shear stress and spatial gradients in vascular pathology: a review. Ann Biomed Eng. 2013;41(7):1411-27.
2. Barker AJ, Markl M, Bürk J, et al. Bicuspid aortic valve is associated with altered wall shear stress in the ascending aorta. Circ Cardiovasc Imaging. 2012;5(4):457-66.
3. Guzzardi DG, Barker AJ, van Ooij P, et al. Valve-Related Hemodynamics Mediate Human Bicuspid Aortopathy: Insights From Wall Shear Stress Mapping. J Am Coll Cardiol. 2015;66(8):892-900.
4. Nishimura RA, Otto CM, Bonow RO, et al. 2014 AHA/ACC guideline for the management of patients with valvular heart disease: a report of the American College of Cardiology/American Heart Association Task Force on Practice Guidelines. J Am Coll Cardiol. 2014;63(22):e57-185.
5. Verma S, Yanagawa B, Kalra S, et al. Knowledge, attitudes, and practice patterns in surgical management of bicuspid aortopathy: a survey of 100 cardiac surgeons. J Thorac Cardiovasc Surg. 2013;146(5):1033-40.
6. Schnell S, Entezari P, Mahadewia RJ, et al. Improved Semiautomated 4D Flow MRI Analysis in the Aorta in Patients With Congenital Aortic Valve Anomalies Versus Tricuspid Aortic Valves. J Comput Assist Tomogr. 2016;40(1):102-8.
7. Potters WV, van Ooij P, Marquering H, et al. Volumetric arterial wall shear stress calculation based on cine phase contrast MRI. J Magn Reson Imaging. 2015;41(2):505-16.
8. van Ooij P, Potters WV, Nederveen AJ, et al. A methodology to detect abnormal relative wall shear stress on the full surface of the thoracic aorta using four-dimensional flow MRI. Magn Reson Med. 2015;73(3):1216-27.
9. van Ooij P, Powell AL, Potters WV et al. Reproducibility and interobserver variability of systolic blood flow velocity and 3D wall shear stress derived from 4D flow MRI in the healthy aorta. Magn Reson Imaging. 2016;43(1):236-48.
Figures