0293
Increased aortic wall shear stress and wall shear stress gradient in patients with an anatomically shaped sinus prosthesis using 4D Flow MRI1Clinic for Radiology and Nuclear Medicine, University Hospital Schleswig-Holstein, Lübeck, Germany, 2Department of Cardiac and Cardiothoracic Vascular Surgery, University Hospital Schleswig-Holstein, Lübeck, Germany, 3Mevis, Fraunhofer, Bremen, Germany
Synopsis
Patients with anatomically shaped sinus prosthesis have been shown to have near physiological hemodynamics in the aortic bulb but altered flow characteristics distal to the prosthesis. The aim of this study was to compare the aortic wall shear of 12 patients with sinus prosthesis with 12 age-matched volunteers using 4D flow sensitive MRI. The wall shear stress analysis in 8 analysis planes revealed a tendency towards decreased WSS in the region of the prosthesis and increased WSS values distal to the prosthesis. Interestingly, the WSS gradient per plane and segmental WSS distal to the prosthesis were increased throughout the patients.
Purpose:
Patients with valve sparing root replacement of the ascending aorta as performed to treat aneurysms or aortic dissections show altered blood flow characteristics [1,2]. With the introduction of an anatomically shaped sinus prosthesis, hemodynamic conditions in the aortic bulb have been shown to be near physiological [3]. While hemodynamic changes have yet to be correlated with outcome and put into clinical context, changes of derived vessel wall parameters are likely. Among others, the wall shear stress (WSS), the tangential force along the vessel wall, can be derived from 4D Flow MRI. WSS has been linked with promoting vessel wall changes such as remodeling in atherosclerosis and arterial stenosis and has been attributed to aneurysm growth [4]. Therefore, this study aimed to analyze the aortic wall shear stress in 12 patients with sinusprosthesis (Uni-Graft®W SINUS, Braun) in comparison to 12 age-matched subjects using 4D Flow MRI.Methods:
MRI scans: 12 patients (“SP”, 1f, age 55±15) after David procedure using a sinus prosthesis (Uni-Graft® SINUS, Braun, Melsungen, GER) and 12 age-matched subjects (“Vol-A”,10f, age 55±6) were examined after IRB approval and written informed consent. A 4D Flow MRI sequence with adaptive respiratory gating and retrospective ECG-triggering was used at a 3T MRI (Philips Achieva, R3.2) with a 20-channel body coil. Typical imaging parameters were: Venc=180cm/s; parallel imaging (SENSE Reff=2,1); spatial resolution 2.4mm interpolated to 2.0mm in all spatial directions. Data were reconstructed to 20 time frames. Depending on the heart rate (49-87/min), an effective temporal resolution of 35-61ms was achieved. Time of investigation was 13±4min.
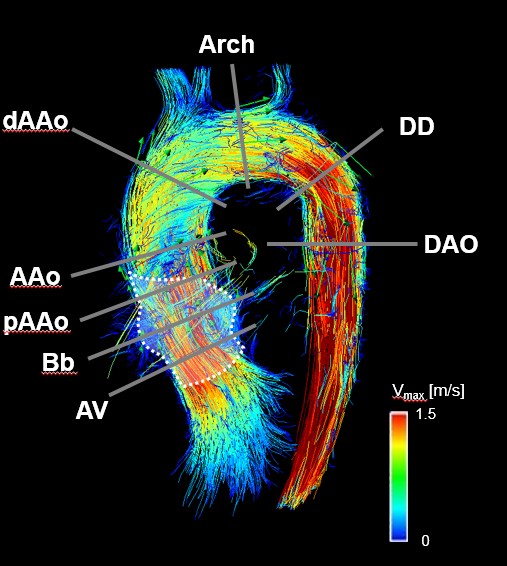
Data assessment: In 5 datasets aliasing was corrected by PhaseUnwrappingTool (v1, Fraunhofer MEVIS, GER). WSS analysis was performed using GTFlow (v2.1.15; GyroTools LLC, CH). 8 analysis planes were positioned orthogonal to the vessel course along the aorta (Fig. 1). Each contour was divided in 8 segments. WSS estimates were calculated as: WSS averaged over all segments per plane. The temporal maximum was determined (maxWSSavg). Further, the minimum and maximum WSS per segment and time (minWSSseg, maxWSSseg) were recorded at the time of maxWSSseg and the maximum gradient (gradWSSseg) calculated as maxWSSseg - minWSSseg. All data are given as mean ± SD [range] in [N/m2]. Statistical analysis included paired Student’s t-test with p<0.05 indicating statistical significance.
Results:
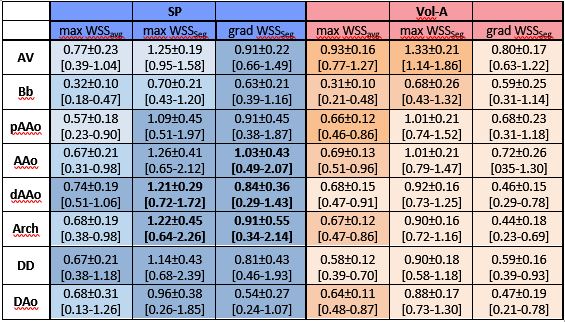
Table 1 summarizes the WSS results per analysis plane. In the planes bordering the prosthesis (Bb, pAAo), maxWSSavg in SP was lower, distal to the prosthesis it was increased (DD, dAAo) or comparable to (AAo, Arch, DAo) to Vol-A. Differences did not reveal statistical significance. This tendency was further underlined by higher maxWSSSeg in SP from pAAo downstream; values in dAAo and Arch reached statistical significance in comparison to Vol-A. Similarly, the WSS gradient (gradWSSSeg) over in-plane segments at maxWSSSeg revealed increased values in SP as compared to Vol-A including the locations of the prosthesis. GradWSSseg differences were most pronounced in AAo, dAAo and Arch where differences reached statistical significance.Discussion and Conclusion:
This study revealed aortic WSS differences between patients treated using a geometrically shaped ascending aortic graft and age-matched volunteers. This work carries two major findings we would like to emphasize: While WSS magnitude and segmental WSS maximum in patients and age-matched volunteers are, in general, of the same magnitude, there are marked differences downstream the prosthesis where maximum WSS tends to be increased in patients. However, the segmental WSS gradient at maximum WSS most obviously differs and may present a sensitive marker for further analysis. Larger patient cohorts and follow-up analyses are warranted to correlate findings with clinical outcome and put results into clinical perspective since increased WSS and gradWSS at the site or distal to the prosthesis may influence occurrence of postoperative aneurysms.Acknowledgements
No acknowledgement found.References
1) Markl M et al. J Thorac Cardiovasc Surg 2005: 130; 456-63; 2) Francois CJ et al. J Thorac Cardiovasc Surg 2013; 145: 1359-66; 3) Oechtering TH et al. J Thorac Cardiovasc Surg 2016: 152; 418-27; 4) Fillinger MF et al. J Vasc Surg 2003: 37;724-32.Figures