0291
4-Dimensional Phase-Contrast Magnetic Resonance Imaging of Left Atrial Stasis in Patients with Paroxysmal Atrial Fibrillation: A Comparative Study of Patients Pre- and Post-Ablation1Department of Cardiac Sciences - Stephenson Cardiac Imaging Centre, University of Calgary, Calgary, AB, Canada, 2Department of Medicine, University of Calgary, Calgary, AB, Canada, 3Stephenson Cardiac Imaging Centre, Libin Cardiovascular Institute of Alberta, Calgary, AB, Canada, 4Diagnostic Imaging, University of Calgary, Calgary, AB, Canada, 5Medical Imaging, University of Western Ontario, London, ON, Canada, 6Diagnostic Imaging, The Ottawa Hospital, Ottawa, ON, Canada, 7Electrophysiology, University of Ottawa, Ottawa, ON, Canada, 8Department of Medicine, University of Western Ontario, London, ON, Canada
Synopsis
This study may be of interest for clinicians and clinical researchers who study atrial diseases. This study demonstrates that 4D flow-derived LA 3D stasis is clinically feasible and it may be useful for characterize differences between pre- and post-ablation patients.
Purpose
Atrial fibrillation (AF) is associated with elevated morbidity and mortality, largely contributed by systemic thrombo-embolism and stroke (1). Previous studies using Doppler echocardiography have supported that thrombus formation is associated with left atrial (LA) flow alterations (2). Recently, time-resolved three-dimensional phase-contrast (4D flow) has been able to quantify LA stasis in patients with AF (3-4). In this study we aim to explore LA stasis in patients pre- and post-ablation as a potential marker of atrial disease and thrombo-embolic risk.Methods
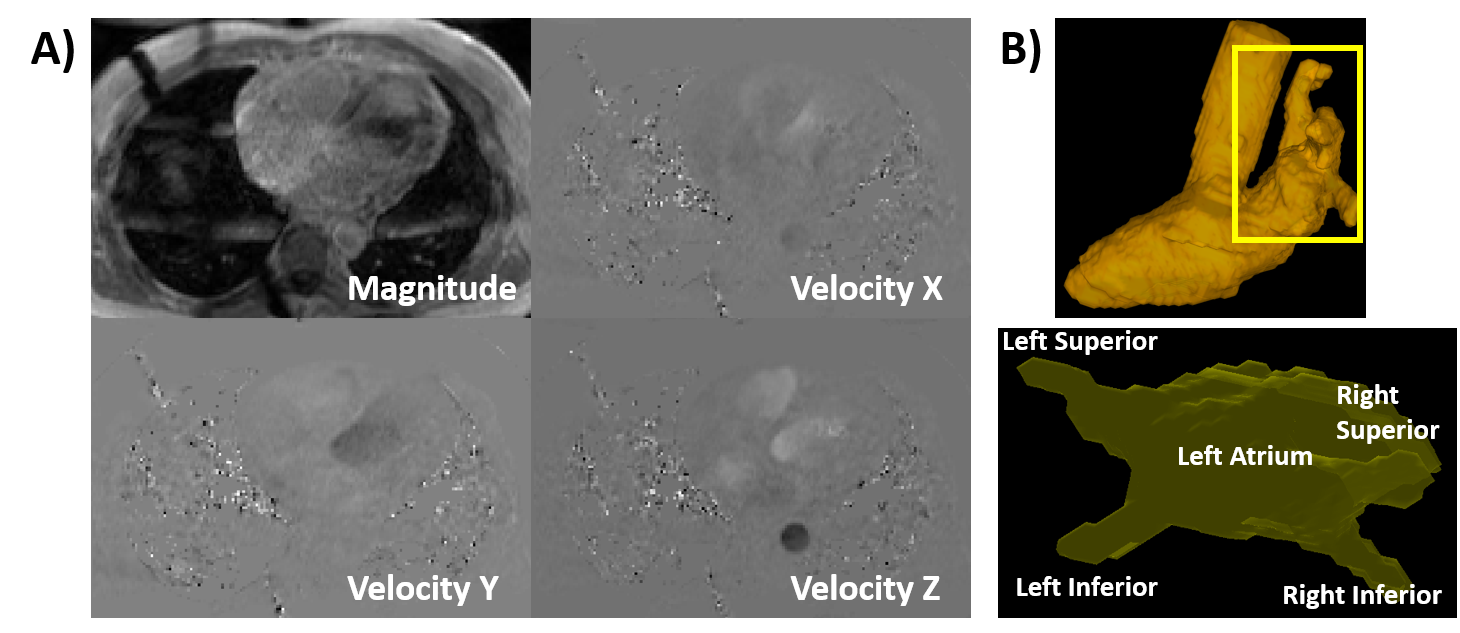
20 subjects with paroxysmal AF of more than two years (10 pre-ablation, 10 post-ablation) were enrolled in an IRB-approved study protocol. Patients were required to be in sinus rhythm and not have greater than mild mitral insufficiency. Imaging was performed using 3T MRI scanner (Skyra and Prisma, Siemens, Erlangen, Germany) using a standardized protocol inclusive of ECG-gated 4D flow with adaptive navigator respiratory gating (5). Data were acquired in trans-axial orientation with whole heart coverage. Imaging parameters were: Venc=1.5–2.0 m/s, TE=2.61–3.14 ms, TR= 4.9–5.9 ms, FOV= 200–420 mm×248–368 mm, spatial resolution = 1.9–3.5×2.0–3.2×1.8–3.5 mm³, temporal resolution = 39.9–47.2 ms, FA = 8°. 4D flow data was pre-processed for noise masking, velocity anti-aliasing, and correction of eddy-currents using in-house software (Matlab,Mathworks, Natick, MA, USA) (6). A time-averaged phase contrast MR angiogram (5) (PC-MRA) was calculated from 4D flow MRI data (Fig. 1A) and used to perform a 3D segmentation of the whole heart (Fig. 1B-Top). Then the left atrium (LA) was isolated (Fig. 1B-Bottom). Whole heart segmentation was perform semi-automatically using fast marching segmentation and 3D active contour detection algorithms implemented in Matlab (7,8). 3D blood flow visualization was performed using Ensight (CEI, USA). The isolated LA was used for the generation of 3D stasis maps (4). Stasis maps (% of absolute LA velocities <0.1 m/s) were calculated and normalized by the total number (Ntotal) of cardiac frames: Rstasis= Nstasis/Ntotal×100.
Results
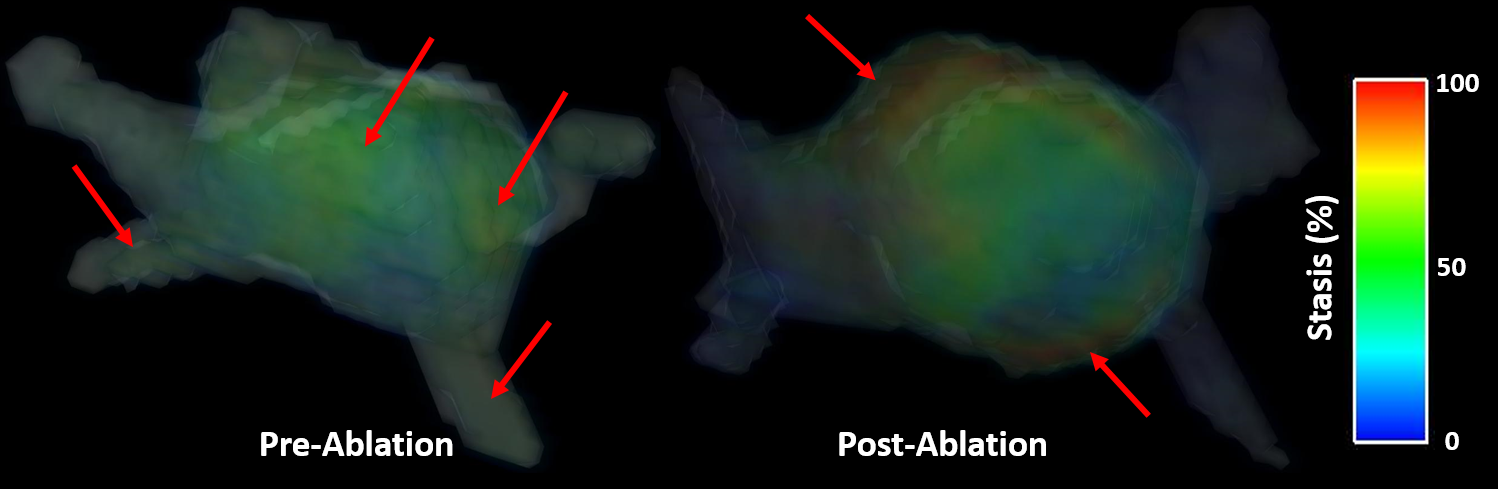
No significant differences in LA velocities were observed between pre- and post-ablation patients for maximum (0.45±0.18 m/s vs. 0.43±0.15 m/s, p=0.223), mean (0.12±0.04 m/s vs. 0.11±0.04 m/s, p=0.247) or standard deviation (0.06±0.02 m/s vs. 0.06±0.02 m/s, p=0.457) measurements. Mean LA stasis was not significantly different between pre- and post-ablation patients (39±10 % vs. 38±10 %, p=0.358). However, greater dispersion in velocities were observed post-ablation with higher velocities typically seen surrounding the pulmonary vein inflow region and lower velocity. Interesting LA stasis standard deviation was higher post-ablation (24±5 % vs. 21±4 %, p=0.028), elevated stasis (meeting stasis criteria) was observed at appendage region (Fig. 2). A negative correlation slope between mean LA stasis and LA mean velocity was also found (r=-0.58, p<0.001).Conclusions
This study demonstrates that: 1) 4D flow derived LA 3D stasis is clinically feasible, and 2) Global measures of stasis may not identify apparent regional differences in LA stasis, particularly following pulmonary vein ablation. These early observations support expanded use of LA 4D flow for the investigation of thrombosis risk in patients with paroxysmal AF.Acknowledgements
This work was supported in part by the Cardiac Arrhythmia Network of Canada (CANet) AF-START grant, Circle Cardiovascular Imaging, and MITACS (IT07679).References
1. Feinberg WM et al. Arch intern Med 1995; 155(5):469-473. 2. Bernhardt P et al. J Am Coll Cardiol 2005; 45(11):1807-1812. 3. Fluckiger J et al. J Mag Reson Imaging 2013:38:580-587. 4. Markl M et al. Int J Cardiovasc Imaging 2016:32(5):807-15. 5. Markl M et al J Mag Reson Imaging 2007:25:824-831. 6. Bock J et al. ISMRM 2007, abstract 3138. 7. Zhang Y et al. IEEE Int Conf Biomed Vis (2008). 8. Sabry H et al. IEEE Trans Pattern Anal Mach Intell 2007;29(9) :1563-74.Figures