0290
Blood flow characterization in sigmoid-sinus using 4D-Flow MR among patients with pulsatile tinnitus1Center for Biomedical Imaging Research, Department of Biomedical Engineering, School of Medicine, Tsinghua University, Beijing, People's Republic of China, 2Neurosurgery department of the general hospital of PLA, Beijing, People's Republic of China, 3Xuanwu Hospital, Capital Medical University, Beijing, People's Republic of China, 4Department of Otolaryngology Head and Neck Surgery, Beijing Tongren Hospital, Capital Medical University, Beijing, People's Republic of China, 5Department of Radiology, University of Washington, Seattle, United States
Synopsis
Pulsatile tinnitus (PT) is suspected to be associated with abnormal hemodynamics in sigmoid-sinus. In this study, we used 4D-Flow MRI to characterize blood flow in sigmoid-sinus among patients with pulsatile tinnitus and demonstrated that high blood velocity in sigmoid-sinus might be an authentic marker of PT. This study may provide more information for diagnosis and treatment of pulsatile tinnitus, especially for patients with PT of venous origin.
PURPOSE
Pulsatile tinnitus (PT) accounts for 4% of all tinnitus patients[1]. Sigmoid sinus diverticulum[2] and dehiscence[3] are reported as treatable causes of PT, which are suspected to be associated with abnormal hemodynamics in sigmoid-sinus[4]. Recent years, 4D flow MRI has become an emerging tool for the assessment of blood flow. The aim of this study was to characterize blood flow in sigmoid-sinus using 4D-Flow MRI among patients with pulsatile tinnitus.METHODS
Subjects: 12 patients (1 male and 11 female, age = 21~51 yrs) with venous PT, which could be eliminated by ipsilateral jugular compression, and 11 healthy volunteers (1 male and 10 female age = 25~63 yrs) were included in this study. All subjects were approved by the local ethics committee and gave written informed consent.
MR scan and data analysis: All 4D flow MR scan were performed on a 3T MRI scanner (Philips Achieva, Best, Netherlands). Imaging parameters were: TR/TE = 8.5/4.1 ms, flip angle = 20°, FOV = 160 x 160 x 28 mm3, acquired voxel size = 1 x 1 x 1 mm3, VENC = 75cm/s. MR venography scan was also used in this study for reference. Imaging parameters were: TR/TE = 22/4.6 ms, flip angle = 10°, FOV = 220 x 160 x 144 mm3, acquired voxel size = 0.9 x 1.2 x 1.6 mm3, VENC = 15cm/s. All visualization, quantification, and analysis of 4D flow data were performed using GTFlow, version 2.2.15 (GyroTools, Zurich, Switzerland). Pre-processing steps including velocity aliasing correction, velocity masks application and vessel segmentation were performed before data analysis and visualization. For quantification of blood flow, cut-planes were created in which maximum velocity locates, perpendicular to the vessels of interest, and contours were drawn manually within cut-planes. After removing vessels with poor image quality, 13 symptomatic and 18 normal veins were included in this study. Average/Maximum through-plane/absolute velocity and average flow were measured in contours. Pulsatility index (PI) was calculated by PI = (Vmax – Vmin) / Vavg, where Vmax/Vmin/Vavg is maximum/minimum/average value of through-plane average velocity in cardiac cycle.
Statistical analysis: Statistical analysis was performed using MedCalc, version 11.4.2.0 (MedCalc Software, Mariakerke, Belgium). Mann-Whitney U test was used to compare values between different groups (Healthy group vs. PT group). A p-value of < 0.05 was considered significant.
RESULTS
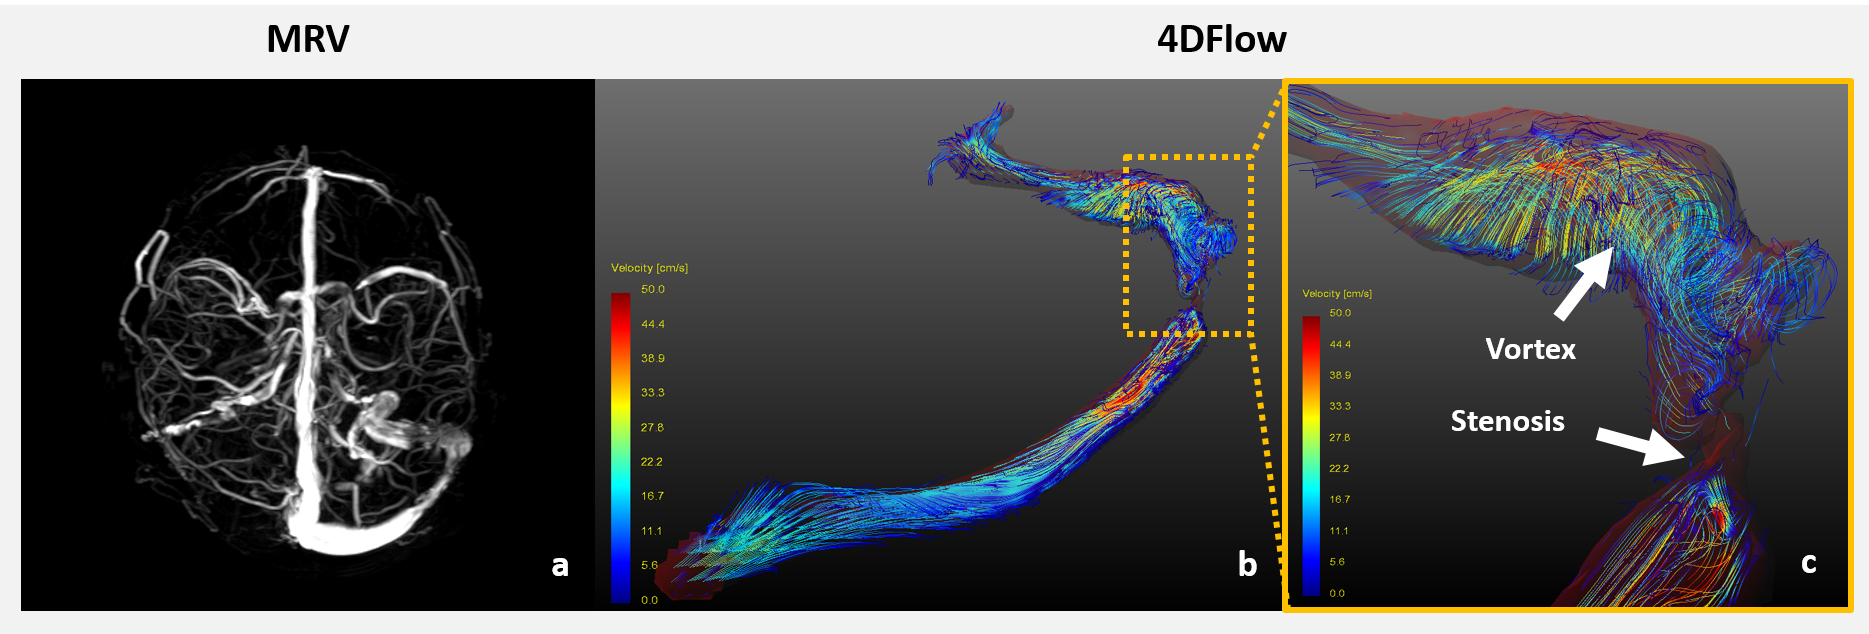
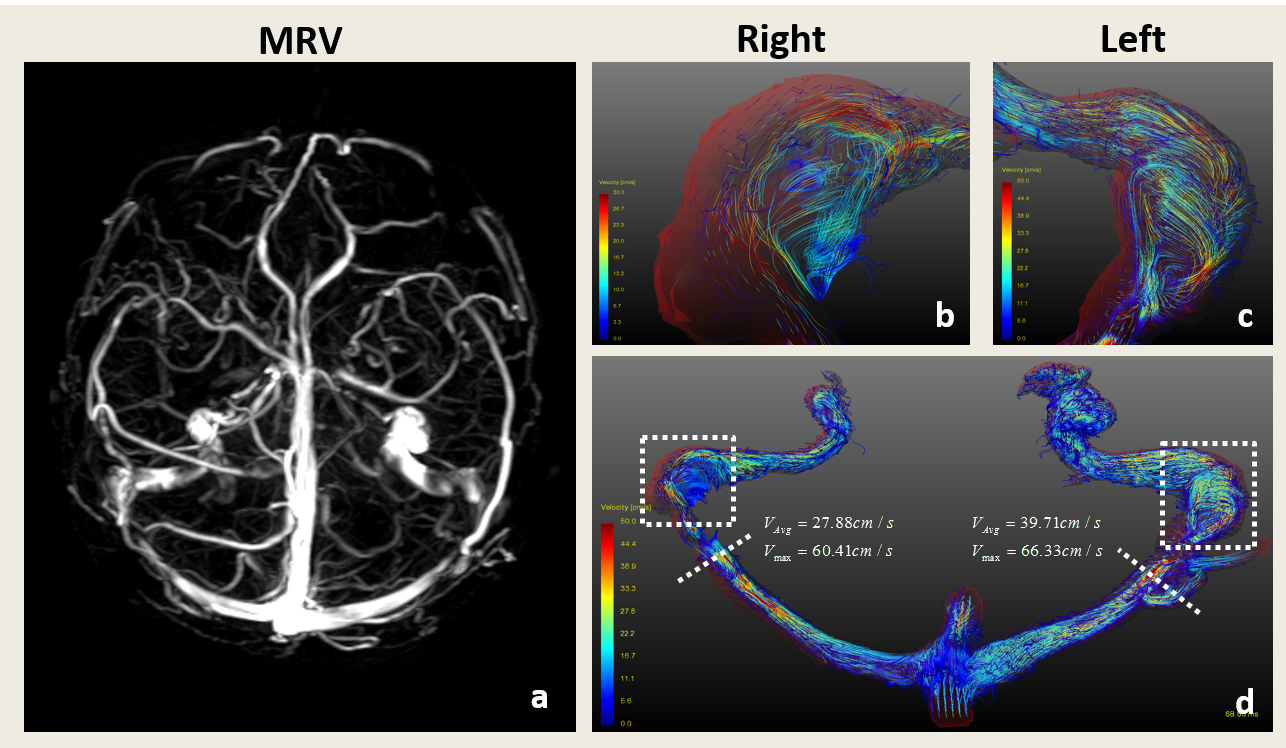
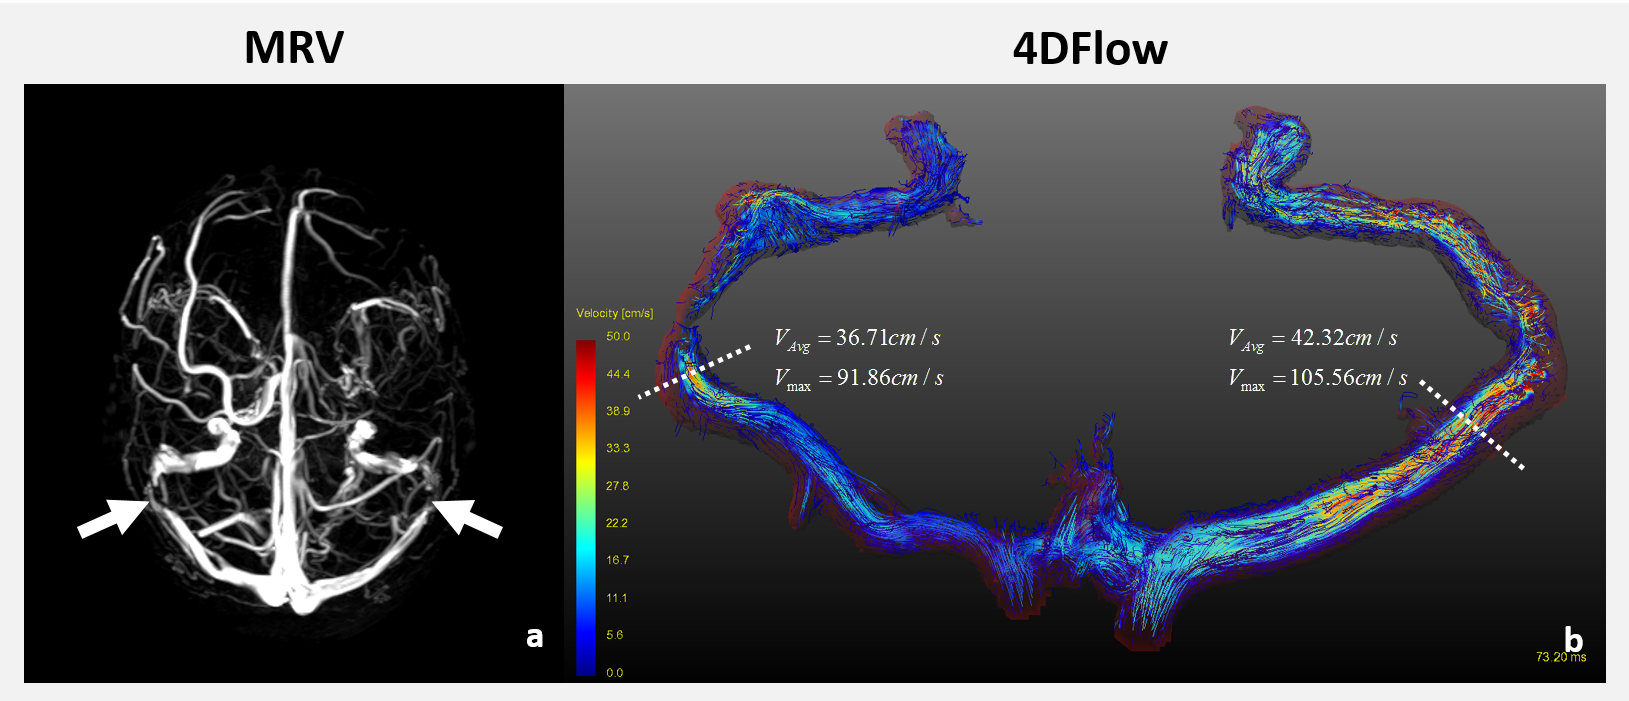
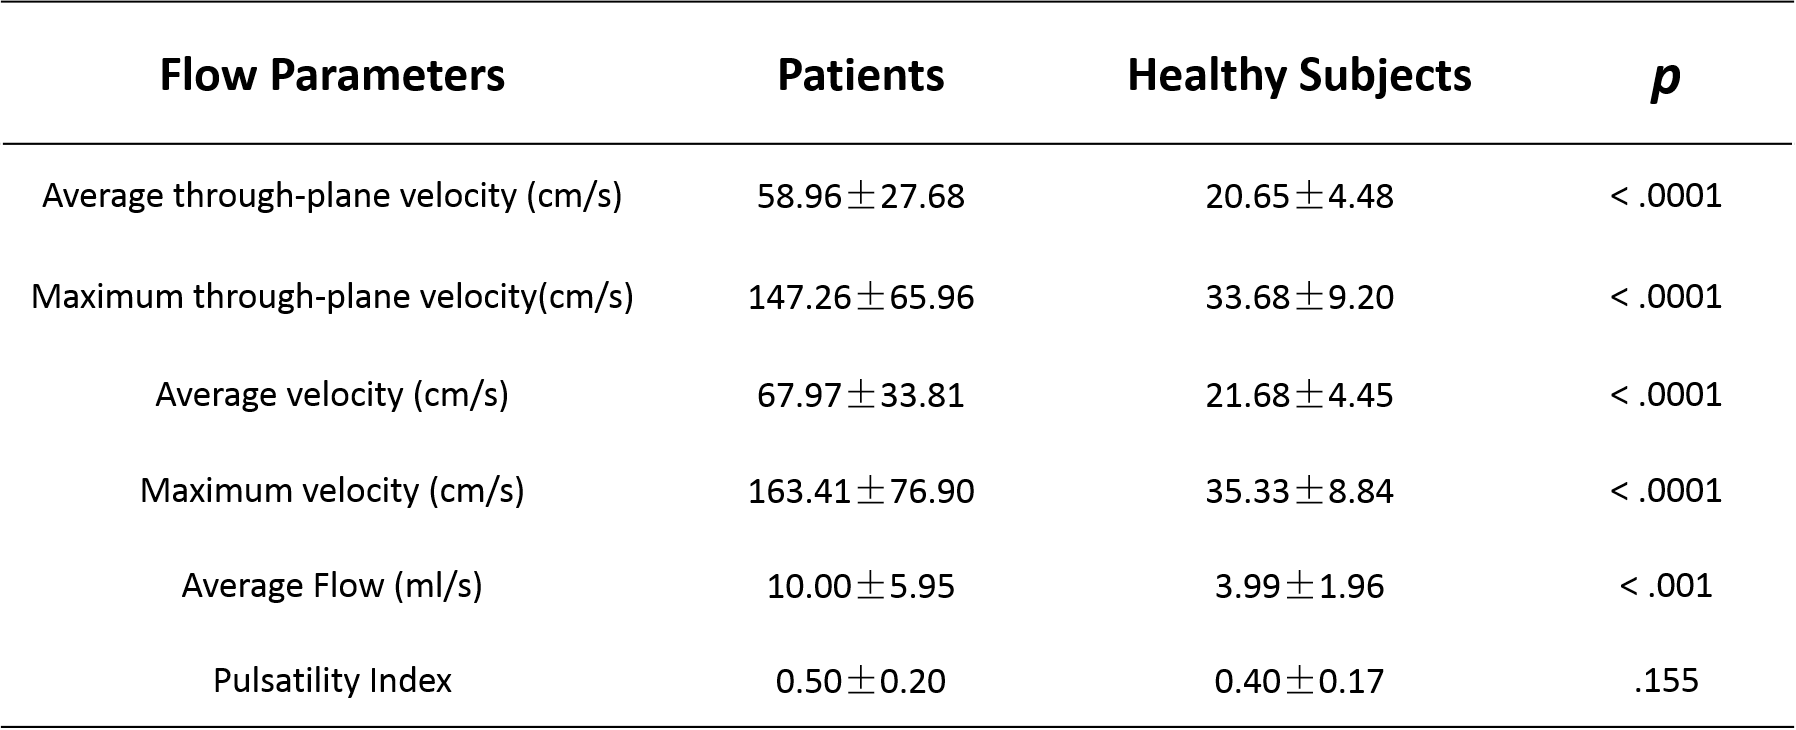
Abnormal blood flow was observed in patients. Fig.1 showed an example of patients with venous PT in left ear. Drainage dominance was observed in MRV and streamline indicated the existence of stenosis and vortex. Fig.2 showed another patient with PT in left ear. No drainage dominance was observed in MRV. Contour measurement showed a higher average through-plane velocity in symptomatic side. Fig.3 showed an example of patients with venous PT in bilateral ears. Visualization results showed that there was stenosis in symptomatic vessels. Cut-plane and contour measurement showed high average and maximum through-plane velocity in bilateral sigmoid-sinus. For statistical analysis (Table.1), PT group shows significantly higher blood flow, average through-plane velocity(cm/s), maximum through-plane velocity(cm/s), average velocity(cm/s) and maximum velocity(cm/s). But there is no significant difference between two groups in PI calculation.DISCUSSION & CONCLUSION
In this study, we demonstrated that high blood velocity in sigmoid-sinus might be an authentic marker of PT with venous origin. The sound is widely considered to be due to turbulent flow in vessels. Here, we first visualized this phenomenon using 4D flow technique. The existence of high blood velocity might be correlated with stenosis in transverse sinus, drainage dominance of transverse sinus in symptomatic side, intracranial hypertension and etc. Categorization of morphology and flow distribution of transverse sinus might be included in further study.
In conclusion, 4D Flow MR imaging, allows visualization and characterization of flow pattern in transverse- and sigmoid-sinus that have not been well evaluated by other techniques, and shows markedly high velocity and blood flow in transverse- and sigmoid-sinus of patients with pulsatile tinnitus (PT) of venous origin. Characterization of blood flow in transverse- and sigmoid-sinus may provide more information for diagnosis and treatment of pulsatile tinnitus, especially for patients with PT of venous origin.
Acknowledgements
No acknowledgement found.References
[1] Lockwood AH, et al. N Engl J Med 347(12):904–10.
[2] Stephen S, et al. Otolaryngol Head Neck Surg 150(5): 841–6.
[3] Zhao P, et al. Eur Radiol (2016) 26:9–14.
[4] Krishnan A, et al. AJNR Am J Neuroradiol 27(8):1635-8.
Figures