0288
3D Linear Regression Analysis Reveals Relationships of 4D flow MRI-derived Aortic Dimensions with Age, Gender and Wall Shear Stress in Patients with Aortopathy1Radiology, Academic Medical Center, Amsterdam, Netherlands, 2Radiology, Northwestern University, Chicago, IL, United States, 3Division of Surgery-Cardiac Surgery, Northwestern University, Chicago, IL, 4Cardiac Sciences, University of Calgary, Calgary, Canada, 5Biomedical Engineering, Northwestern University, Chicago, IL, United States
Synopsis
In two groups of patients with bicuspid valves (BAV) and with tricuspid valves with dilated aortas (TAV), 3D correlation coefficient r maps were created to investigate linear relationships between 3D aortic diameter maps and 3D wall shear stress maps (WSS), with age and gender as co-variables. The dependence of diameter on gender was higher for TAV, whereas the dependence of diameter on age was higher for BAV patients. With the addition of WSS to the model, r increased slightly for both groups. In general, r was significantly higher for TAV: BAV mediated aortopathy is suspected to have genetic associations.
Introduction
Recent studies showed that there are differences in aortopathy between patients with bicuspid and tricuspid aortic valves (BAV and TAV)1,2 and that wall shear stress (WSS) is related to vessel wall remodeling in BAV3. Thus, 3D correlation maps were developed to investigate associations between 4D flow MRI-derived aortic 3D diameter maps and WSS with age and gender as co-variables in BAV and TAV aortopathy.Methods
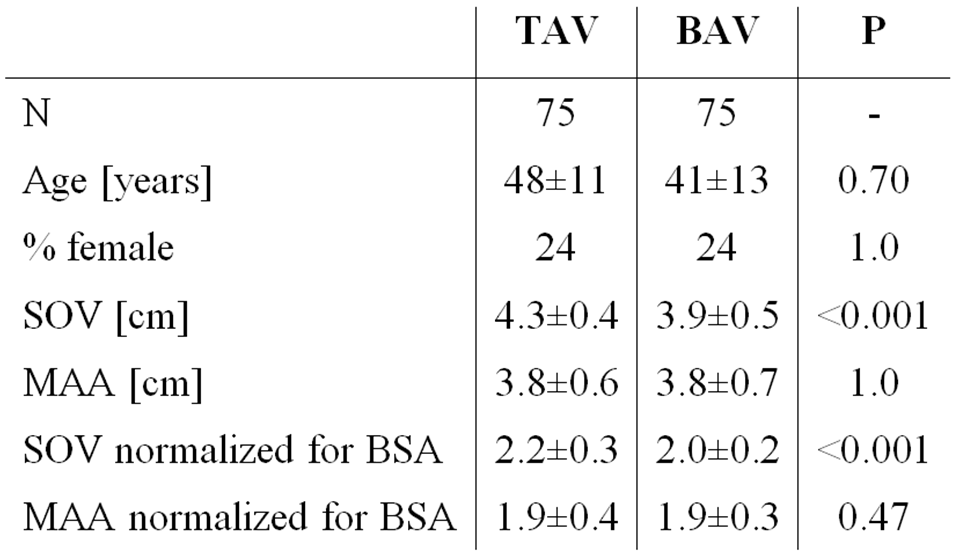
4D flow MRI data were acquired in 75 BAV patients (right-left fusion only) and in 75 TAV patients aortic dilation. Contrast-enhanced (CE-)MRA-derived diameters at the Sinus of Valsalva (SOV) and mid-ascending aorta (MAA) were available. Height and weight was used to calculate body surface area (BSA). Subject demographics are summarized in table 1.
4D flow MRI was performed with respiratory navigator gating and prospective ECG gating: spatial resolution=2.2–4.2×1.7–2.9×2.2-4.0mm3; temporal resolution=32.8–43.2ms; TE/TR/FA=2.2–2.8ms/4.1-5.4ms/15°; VENC=150–250cm/s. All scans were performed on 1.5T and 3T MAGNETOM Avanto/Espree/Aera/Skyra systems (Siemens Healthcare, Erlangen, Germany).
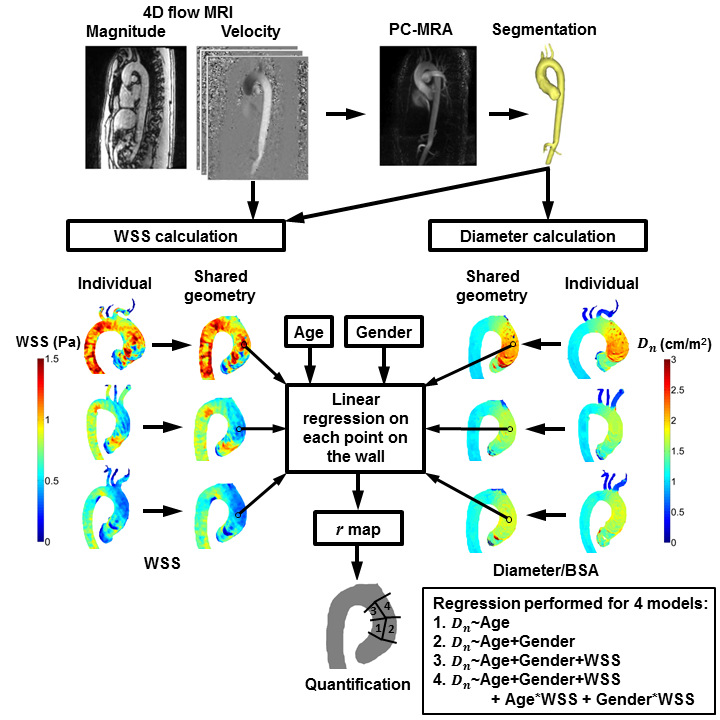
Data was corrected for background phase offsets and velocity aliasing. 3D phase contrast angiograms (PC-MRA) were created by multiplication of the magnitude images with the absolute velocity images, followed by averaging over all timeframes4. PC-MRA were used to create segmentations of the thoracic aorta in Mimics (Materialise, Leuven, Belgium). Peak systole was identified by isolating the time frame where the spatially averaged absolute velocity in the segmentation was maximal. A 3D surface mesh, delineating the aortic wall, was created from the segmentation and smoothed with a Laplacian filter5. Normal vectors were calculated on each point on the wall and used for 1) 3D WSS calculation as previously described6 and 2) 3D diameter calculation by tracking the length of the inward normal upon exiting the opposite aortic wall. Subsequently, both 3D WSS and 3D diameter maps were mapped onto cohort-specific shared geometries7.
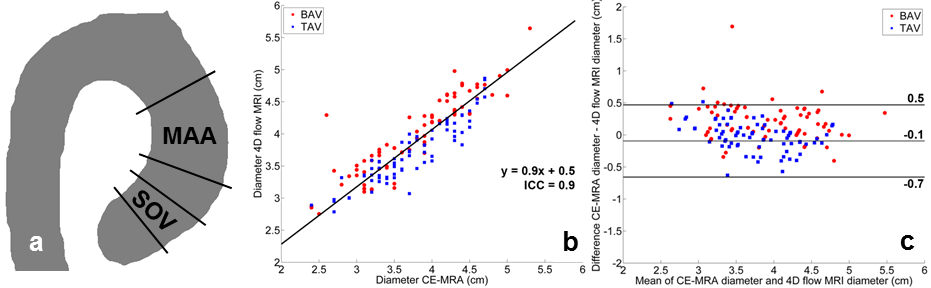
Analysis 1: For verification of the 4D flow MRI-derived diameter values, the median diameter was calculated in the SOV (±0-1cm distal from the valve) and MAA region (±2-5cm distal from the valve, figure 1a) and compared with CE-MRA-derived SOV and MAA diameters. Orthogonal regression and Bland-Altman analysis was performed at both regions.
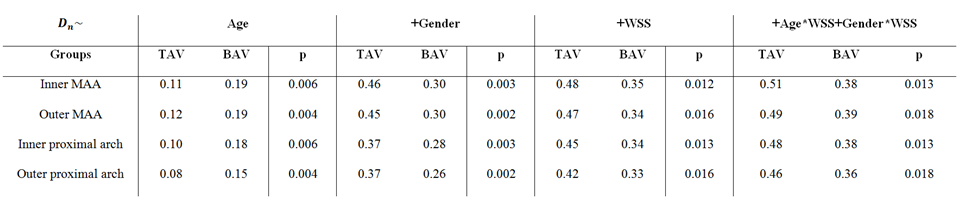
Analysis 2: To perform 3D linear regression, the 3D diameter maps were normalized for BSA (Dn)8. The dependence of aortic dimensions and WSS on age and gender was included in the model9–11. On each point at the wall, the regression coefficient r was calculated to obtain a 3D r map. To investigate if differences in r were significant (P<0.05) between groups, a second linear regression model was created with an added dummy variable for TAV and BAV. For quantification of regional median r and P, the ascending aorta (AAo) was subdivided into four regions: 1) the inner and 2) outer proximal AAo and 3) the inner and 4) outer distal AAo. See figure 2 for a schematic overview of the workflow. All analyses were performed in Matlab (The Mathworks, Natick, MA, USA).
Results
Orthogonal regression (figure 1a) and Bland-Altman (figure 1b) analysis demonstrated good agreement for the MAA diameter for CE-MRA and 4D flow MRI (ICC=0.9, slope=0.9, mean difference=-0.1cm and limits of agreement [LOA]=0.6cm). For the SOV, the agreement was poor (ICC=-0.2, slope=0.7, mean difference=0.9cm and LOA=1cm).
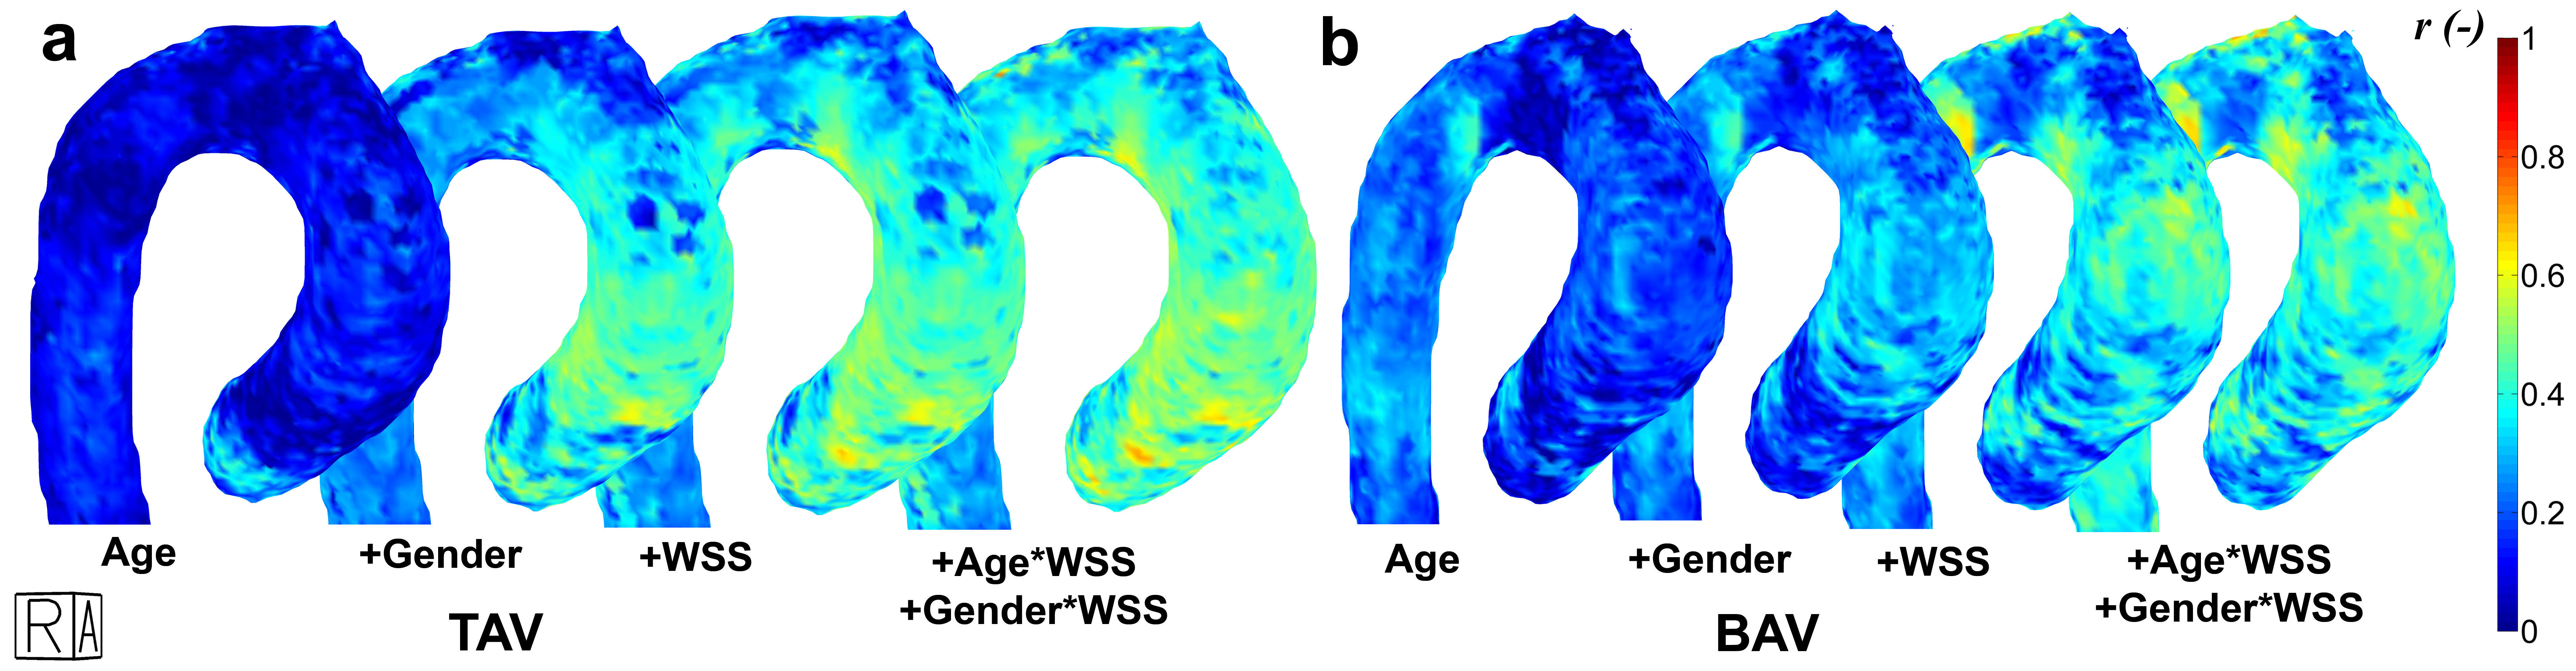
3D r maps are displayed in figure 3. For both groups, r increased with the addition of more variables in the regression equation (table 2). The dependence of diameter on gender was higher for TAV patients, whereas the dependence of diameter on age was higher for BAV patients. With addition of WSS to the model, a small increase in r was found for both groups. For all parameters and all regions, differences between TAV and BAV were significant (table 2).
Discussion
As shown previously, 4D flow MRI-derived diameters showed poor agreement with CE-MRA-derived diameters at the SOV and was thus not considered further9.
Increased r for TAV compared to BAV shows that the current variables included in the model may account for hemodynamically mediated aortopathy more so in TAV compared to BAV. Of note, BAV mediated aortopathy is also suspected to have genetic associations.
3D r did not exceed 0.5. Thus, age, gender and WSS are not the only factors driving remodeling. To acquire higher r, the model can be expanded by smoking status, blood pressure, valve stenosis/insufficiency and genetic factors.
Conclusion
3D r maps were used to investigate relationships between age, gender and 3D WSS with 4D flow MRI-derived 3D aortic diameters. These maps were used to show differences between patients with TAV and BAV in dependence of aortic diameters on age, gender and WSS.Acknowledgements
NIH R01 HL115828 and K25 HL119608 and Dr. Anouk Schrantee of the Academic Medical Center for advice on the statistic analysesReferences
1. Tsamis A, Phillippi JA, Koch RG, Chan PG, Krawiec JT, D’Amore A, Watkins SC, Wagner WR, Vorp DA, Gleason TG. Extracellular matrix fiber microarchitecture is region-specific in bicuspid aortic valve-associated ascending aortopathy. J Thorac Cardiovasc Surg 2016;151:1718–1728.e5.
2. Mahadevia R, Barker AJ, Schnell S, Entezari P, Kansal P, Fedak PW, Malaisrie SC, McCarthy P, Collins J, Carr J, Markl M. Bicuspid aortic cusp fusion morphology alters aortic three-dimensional outflow patterns, wall shear stress, and expression of aortopathy. Circulation 2014;129:673–682.
3. Guzzardi DG, Barker AJ, Ooij P van, Malaisrie SC, Puthumana JJ, Belke DD, Mewhort HE, Svystonyuk DA, Kang S, Verma S, Collins J, Carr J, Bonow RO, Markl M, Thomas JD, McCarthy PM, Fedak PW. Valve-Related Hemodynamics Mediate Human Bicuspid Aortopathy: Insights From Wall Shear Stress Mapping. J Am Coll Cardiol 2015;66:892–900.
4. Bock J, Kreher W, Hennig J, Markl M. Optimized pre-processing of time-resolved 2D and 3D Phase Contrast MRI data. Proc Intl Soc Mag Reson Med 2007;15:3138.
5. Vollmer J, Mencl R, Müller H. Improved Laplacian Smoothing of Noisy Surface Meshes. EUROGRAPHICS 1999;18.
6. Potters W V, Ooij P van, Marquering HA, VanBavel E, Nederveen AJ. Volumetric arterial wall shear stress calculation based on cine phase contrast MRI. J Magn Reson Imaging 2015;Feb; 41:505–516.
7. Ooij P van, Potters W V, Nederveen AJ, Allen BD, Collins J, Carr J, Malaisrie SC, Markl M, Barker AJ. A Methodology to Detect Abnormal Relative Wall Shear Stress on the Full Surface of the Thoracic Aorta Using 4D Flow MRI. Magn Res Med 2015;Mar; 73:1216–1227.
8. Truong U, Fonseca B, Dunning J, Burgett S, Lanning C, Ivy DD, Shandas R, Hunter K, Barker AJ. Wall shear stress measured by phase contrast cardiovascular magnetic resonance in children and adolescents with pulmonary arterial hypertension. J Cardiovasc Magn Reson 2013;15:81.
9. Garcia J, Barker AJ, Murphy I, Jarvis K, Schnell S, Collins JD, Carr JC, Malaisrie SC, Markl M. Four-dimensional flow magnetic resonance imaging-based characterization of aortic morphometry and haemodynamics: impact of age, aortic diameter, and valve morphology. Eur Hear J – Cardiovasc Imaging 2015:jev228.
10. Ooij P van, Garcia J, Potters W V., Malaisrie SC, Collins JD, Carr JC, Markl M, Barker AJ. Age-related changes in aortic 3D blood flow velocities and wall shear stress: Implications for the identification of altered hemodynamics in patients with aortic valve disease. J Magn Reson Imaging 2016;43:1239–1249.
11. Samijo SK, Willigers JM, Barkhuysen R, Kitslaar PJEHM, Reneman RS, Brands PJ, Hoeks APG. Wall shear stress in the human common carotid artery as function of age and gender. Cardiovasc Res 1998;39:515–522.
Figures