0284
Comparing in vivo MR g-ratio mapping methods: accuracy and precision at the group level1Department of Systems Neuroscience, Medical Center Hamburg-Eppendorf, Hamburg, Germany, 2UCL Institute of Neurology, University College London, London, United Kingdom, 3Department of Neurophysics, Max Planck Institute for Human Cognitive and Brain Sciences, Leipzig, Germany
Synopsis
The g-ratio, the ratio between the inner and outer diameter of a myelinated axon, is of great neuroscientific interest because it is a relative measure of axonal myelination and functionally linked to conduction velocity. In vivo g-ratio mapping has been recently suggested using a flexible biophysical model that relates the microscopic g-ratio, only accessible by histology, to MRI biomarkers for the myelin and fiber compartment. This study investigates the question which MRI biomarker is optimal for MR g-ratio mapping concerning precision (determined by scan-rescan reproducibility) and accuracy (assessed by comparability to previous in vivo and the ex vivo results).
Purpose
The g-ratio, the ratio between the inner and outer diameter of a myelinated axon, is of great neuroscientific interest because it is a relative measure of axonal myelination and functionally linked to conduction velocity. The recent developments on a highly flexible biophysical model that relates the microscopic g-ratio, only accessible by ex vivo histology, to MRI biomarkers for myelin volume fraction (MVF) and fiber volume fraction (FVF) shows promising results for in vivo mapping g-ratio (1), here dubbed MR g-ratio. Different MRI biomarkers have been proposed for MR g-ratio mapping, leaving open the question which biomarker is optimal. One approach to find suitable biomarkers is to compare them to a silver-standard method, which, for example, can be an MRI method that has been tested against gold standard ex vivo histology. This approach has been used by Campbell et al. to compare different biomarkers for myelin (2). Here, we built upon the findings of Campbell et al. (2) and tested one newly introduced method to calculate the MR g-ratio and three previously used approaches (3-5) with respect to a) their reproducibility in a scan-rescan design and b) comparability to population-based in vivo MR g-ratio results and ex vivo histological findings.Methods
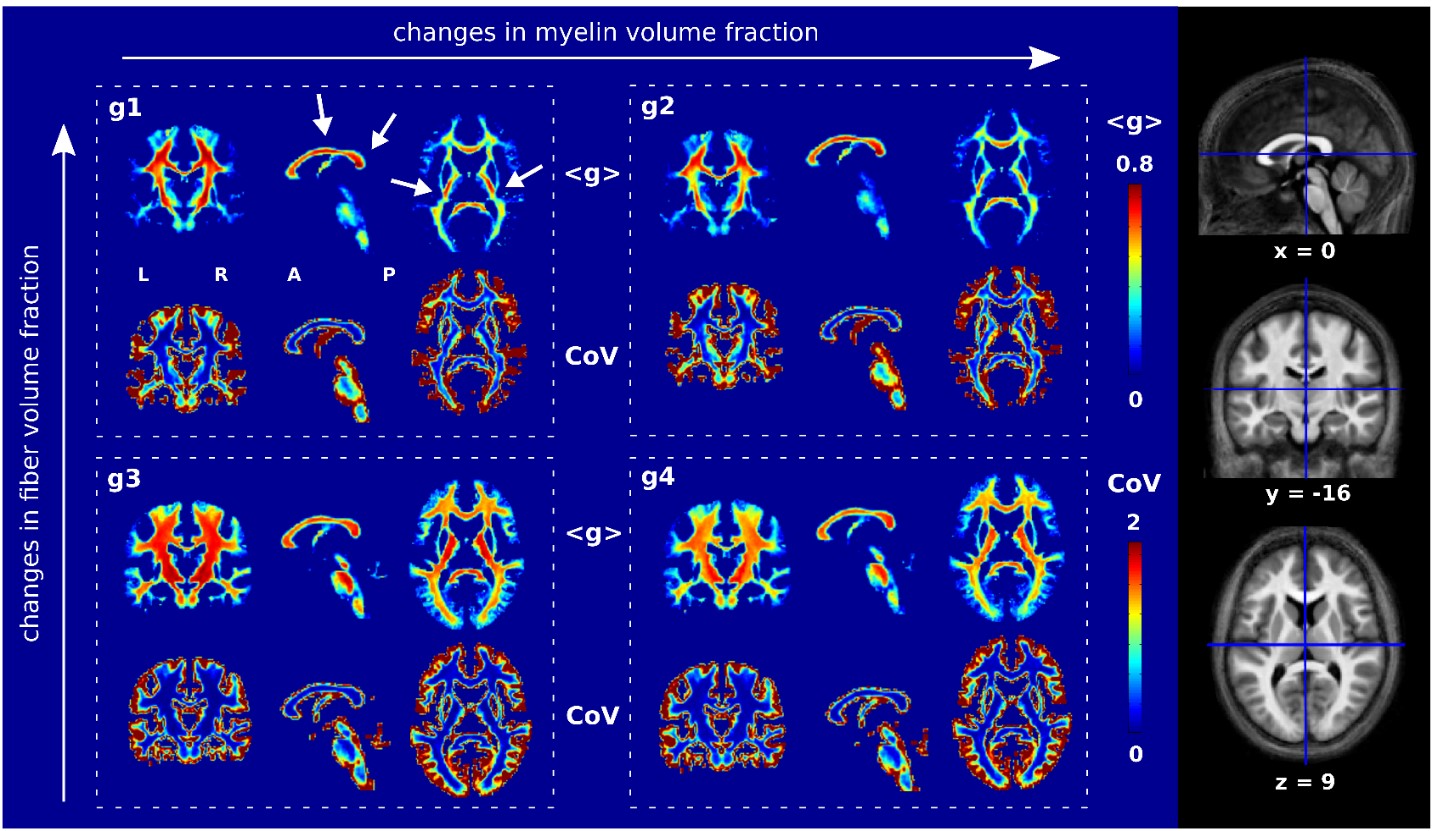
An extensive quantitative MRI (qMRI) protocol acquired the biomarkers for calculating MR g-ratios, multi-parameter mapping (6) and multi-shell diffusion-weighted imaging. The protocol involved two distinct acquisition techniques for imaging MVF: (i) the macromolecular tissue volume (MTV) based on proton density imaging (7) and (ii) magnetization transfer (MT) saturation imaging (8), and two techniques for imaging FVF: (i) neurite orientation dispersion and density imaging (4) (NODDI) and (ii) tract-fiber density (9) (TFD). MRI was performed on a 3T Tim TRIO system (Siemens, Erlangen), data analyses were performed using MATLAB (The MathWorks, Natick, MA, R2014b) and statistical parametric mapping (SPM12, London). Four g-ratio indices were calculated for each subject and session using different combinations of the qMRI biomarkers for MVF and FVF (fig. 1), based on the function:
$$g=\sqrt{1-\frac{MVF} {FVF}}$$
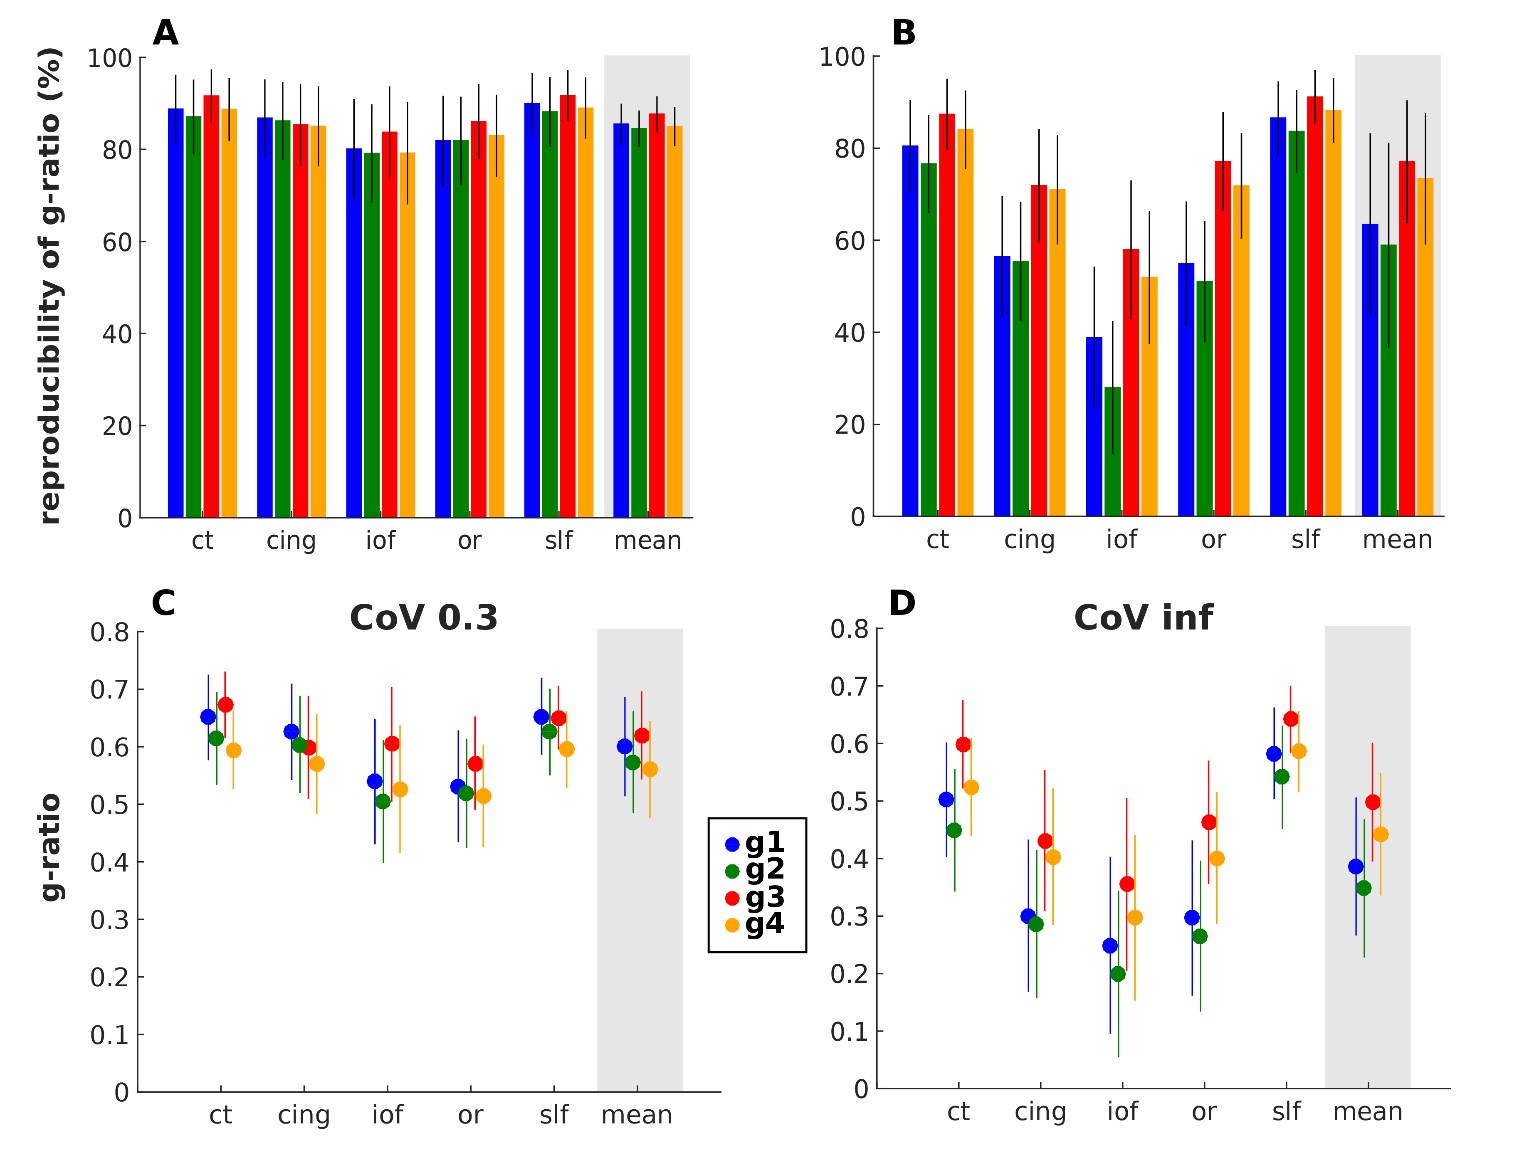
For each MR g-ratio metric, a customized coefficient of variation (CoV) map was created ((<g>)/SD) (fig. 2). To exclude voxels with high partial volume effects, a mask was generated based on the CoV map using the threshold previously proposed (3): 0 < CoV < 0.3. The precision was assessed via the reproducibility of MR g-ratio metrics in a scan-rescan design (6-8 days interval) in 12 healthy volunteers. G-ratios were calculated within specific white matter fiber tracts, defined in the Anatomy toolbox (10). In an additional analysis, the CoV mask was not inserted, i.e. partial volume effects were not restricted.
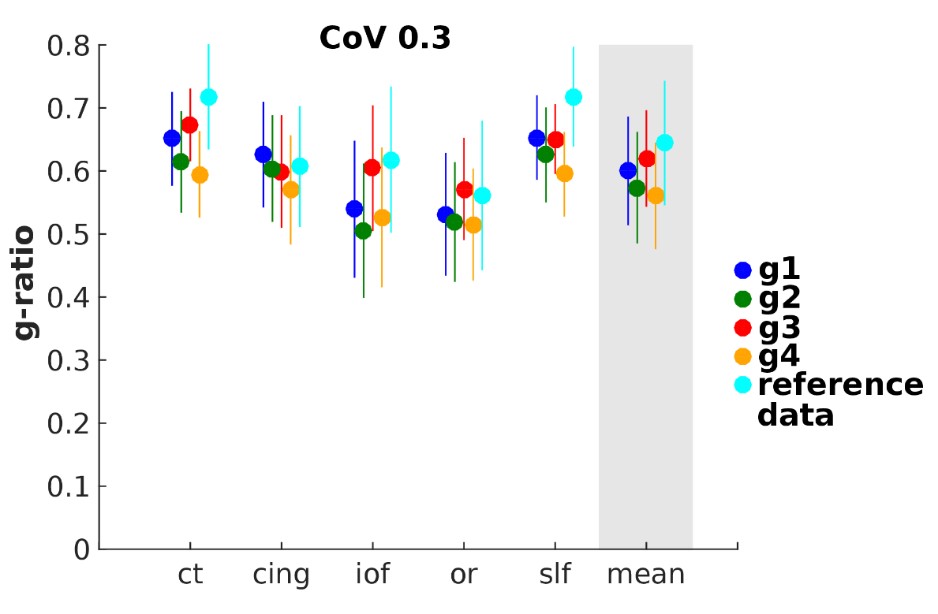
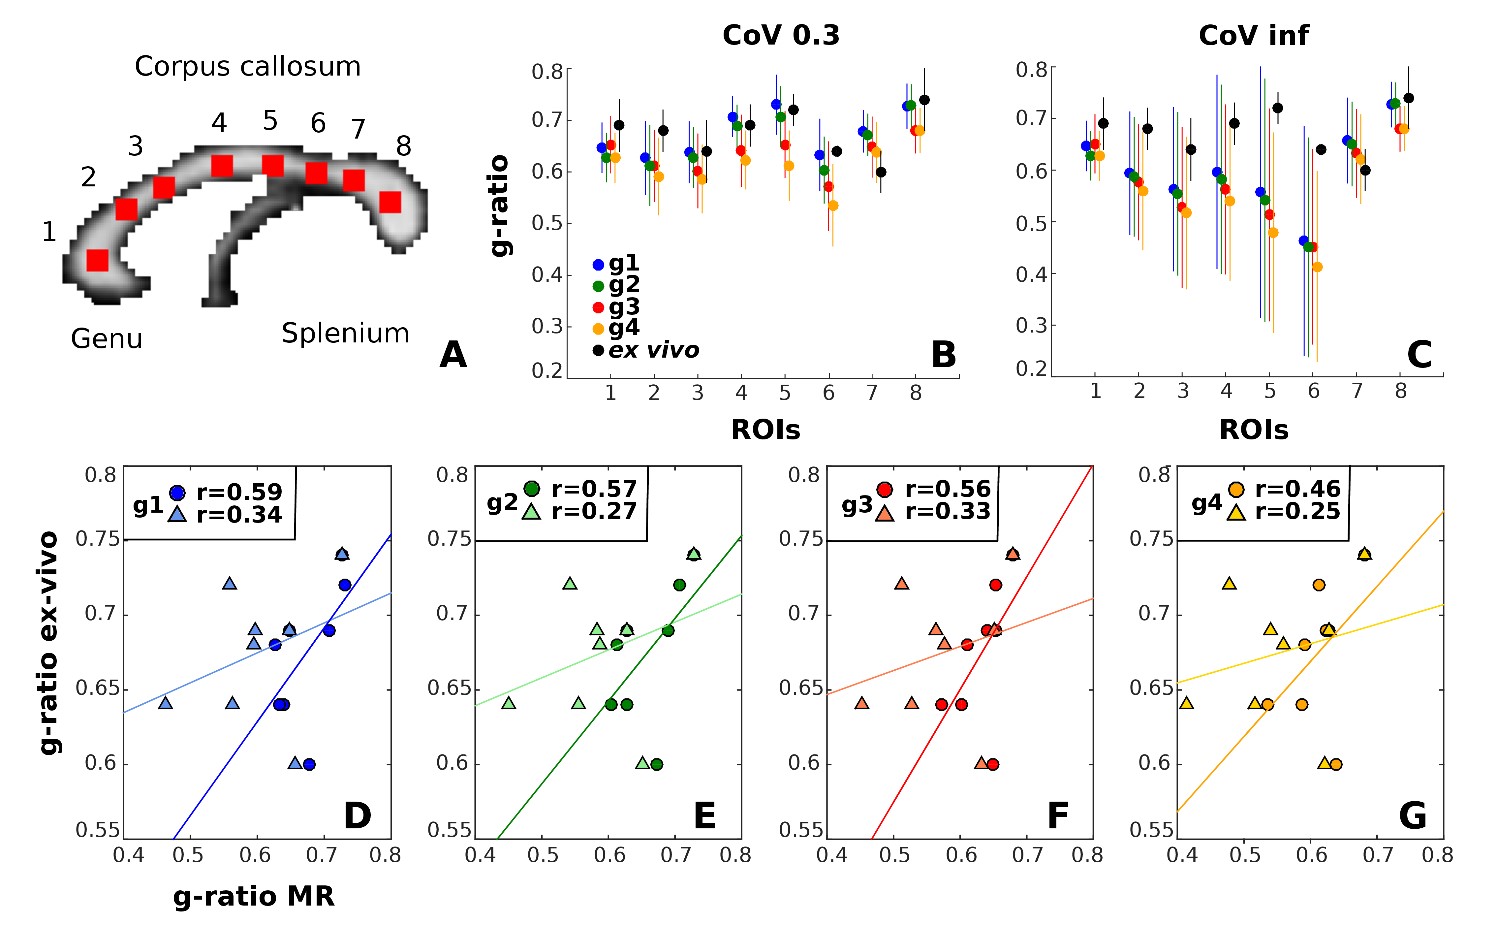
The accuracy was tested by comparison with in vivo MR g-ratio (3) and ex vivo microscopic g-ratio (4). For the latter, group-mean MR g-ratio values were determined in eight regions of interest (ROIs) within the corpus callosum (fig. 5A) for comparison with histological ex vivo macaque monkey data (4). Analogous to the previous analysis, the CoV mask was used to reduce partial volume effects and the same analysis was performed without partial volume effect correction.
Results
A strong consistency was found between the four MR g-ratio metrics concerning: (a) their high reproducibility in a scan-rescan experiment (fig. 3A), indicating similarity of noise propagation between g-ratio measurements, and (b) their qualitative agreement with population-based in vivo MR g-ratio results (fig. 3C, fig. 4) and ex vivo histological findings (fig. 5) if the data were optimally processed, i.e. partial volume effects were reduced. However, if no partial volume effect correction was applied (fig. 3B, D, and fig. 5B), the reproducibility and comparability of the MR g-ratio measurement methods depended strongly on the qMRI for FVF.Discussion
Our data indicated that the choice of the qMRI biomarker as a proxy for myelin and fiber was not the most determining factor in terms of precision and accuracy but rather the correction of partial volume effects. Given that a CoV map used for restricting partial volume effects relies on group data, this form of correction is not applicable in a single-subject scenario, as in a clinical context. For single-subject investigations, i.e. if partial volume effect were not corrected, the NODDI-based g-ratios performed better than TFD-based values.Conclusion
The fact that all four g-ratio metrics show similar values within tracts and consistent variation across tracts regardless of the choice of qMRI biomarkers suggests that MR g-ratio mapping is suitable for assessing microstructural variation, making it a valuable in vivo MRI marker for clinical or neuroscience studies.Acknowledgements
This work has been supported by a University Medical Center Hamburg-Eppendorf FFMPostdoctoral Fellowship to IE and a Marie Sklodowska-CurieIndividual FellowshipMSCA-IF-2015 (EU Horizon 2020) to SM.References
(1) Stikov N, Perry LM, Mezer A, et al. Bound pool fractions complement diffusion measures to describe white matter micro and macrostructure. Neuroimage. 2011;54(2), 1112-1121.
(2) Campbell J, Leppert I, Boudreau M, et al. Mapping the myelin g-ratio: promises and pitfalls. Presented at the Proc. Intl. Soc. Mag. Reson. Med. 24. 2016; abstract:1501. 3 Mohammadi S, Carey D, Dick F, et al. Whole-Brain In-vivo Measurements of the Axonal G-Ratio in a Group of 37 Healthy Volunteers. Front. Neurosci. 2015;9(441).
(4) Stikov N, Campbell JSW, Stroh T, et al. In vivo histology of the myelin g-ratio with magnetic resonance imaging. Neuroimage. 2015;118:397–405.
(5) Duval T, Lévy S, Stikov N, et al. g-Ratio weighted imaging of the human spinal cord in vivo. Neuroimage. In press. Available online 22 September 2016.
(6) Weiskopf N, Suckling J, Williams G, et al. Quantitative multi-parameter mapping of R1, PD(*), MT, and R2(*) at 3T: a multi-center validation. Front. Neurosci. 2013;7(95).
(7) Mezer A, Yeatman JD, Stikov N, et al. Quantifying the local tissue volume and composition in individual brains with magnetic resonance imaging. Nat. Med. 2013;19(12):1667-1672.
(8) Helms G, Dathe H, Kallenberg K, et al. High-resolution maps of magnetization transfer with inherent correction for RF inhomogeneity and T1 relaxation obtained from 3D FLASH MRI. Magn. Reson. Med. 2008;60(6):1396-1407.
(9) Reisert M, Mader I, Umarova R, et al. Fiber density estimation from single q-shell diffusion imaging by tensor divergence. Neuroimage. 2013;77:166–176.
(10) Eickhoff SB, Stephan KE, Mohlberg H, et al. A new SPM toolbox for combining probabilistic cytoarchitectonic maps and functional imaging data. Neuroimage. 2005;25(4):1325–1335.
Figures