0281
Intra- and extra-axonal axial diffusivities in the white matter: which one is faster?1Centre d'Imagerie Biomédicale, Ecole Polytechnique Fédérale de Lausanne, Lausanne, Switzerland
Synopsis
The typical two-compartment model of diffusion in the white matter is associated with two plausible solutions, the choice between which relies on whether intra-axonal or extra-axonal axial diffusivity is faster. Here we use an intracerebroventricular perfusion of gadolinium in the rat brain to suppress the extra-cellular signal. Diffusion measurements before and after perfusion show a mild increase in axial diffusivity post-perfusion, which suggests intra-axonal diffusivity is higher than extra-axonal axial diffusivity. This can help solve the current indetermination in parameter estimation and allow diffusion models to regain their claimed specificity.
Purpose
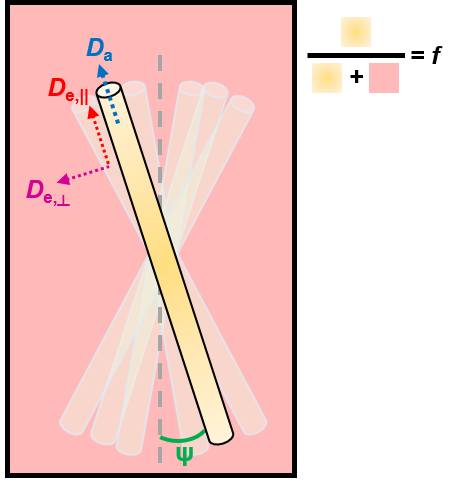
In most white matter diffusion models, the intra-axonal compartment is described as a collection of sticks with axial diffusivity Da and the extra-axonal space as a Gaussian anisotropic compartment with local axial and radial diffusivities De,|| and De,┴, respectively (Fig.1). It has recently been shown that, when estimating parameter values for this model, two biologically plausible solutions arise: one where Da>De,||, and one where Da<De,||.1,2 With current models making unverified assumptions3,4, it seems indispensable to solve this duality using an orthogonal measurement, for diffusion models to regain their claimed specificity. Previous methods suggested either Da>De,||,5 or Da≈De,||.6 Here, we tackle the problem using an intracerebroventricular perfusion of gadolinium (Gd) in the rat brain, to suppress the extra-cellular signal.7Methods
All experiments were approved by the local Service for Veterinary Affairs and performed on a 14T Varian system. Seven Sprague-Dawley rats underwent an initial MRI scanning session (“Pre”) to estimate T1, T2 and diffusion and kurtosis tensors in the genu of the corpus callosum. Two days later, the rats underwent an intracerebroventricular perfusion7 of 0.25M Gadovist (Bayer) followed by a second MRI scanning session (“Post”).
Single-voxel STEAM measurements (voxel: 1x1.5x1.5 mm3) were performed in the genu for T1 (TE=2.8ms, “Pre”: TR=15s, 19 TI values ranging 10 – 10,000 ms, “Post”: TR=7s, 19 TI values ranging 6 – 6,000 ms) and T2 (“Pre”: TR=15s, 18 TE values ranging 2.8 – 150 ms, “Post”: TR=7s, 14 TE values ranging 2.8 – 120 ms) relaxometry.
Diffusion-weighted images were acquired using a semi-adiabatic SE-EPI sequence8 (4 b=0; b=1 and b=2 ms/μm2 with 20 directions each; TE=48ms, TR=2s, 5 sagittal 0.8-mm slices, matrix=128x64, FOV=23x17mm2, 4 shots). The intra-axonal signal was likely affected by Gd-induced susceptibility gradients (GGd). To compensate cross-terms between the latter and sequence gradients, two diffusion datasets were acquired, one with default imaging and diffusion gradient polarities, and another with reversed polarities.
Diffusion and kurtosis tensors were estimated voxel-wise using a constrained weighted linear least-squares algorithm.9 Tensor metrics were averaged over the genu and between default and reversed acquisitions.
Differences in relaxation times and diffusion metrics between pre- and post-Gd were assessed using paired t-tests.
While
the two diffusion acquisitions with opposed gradient polarity limit the contribution
of uncontrolled GGd to the
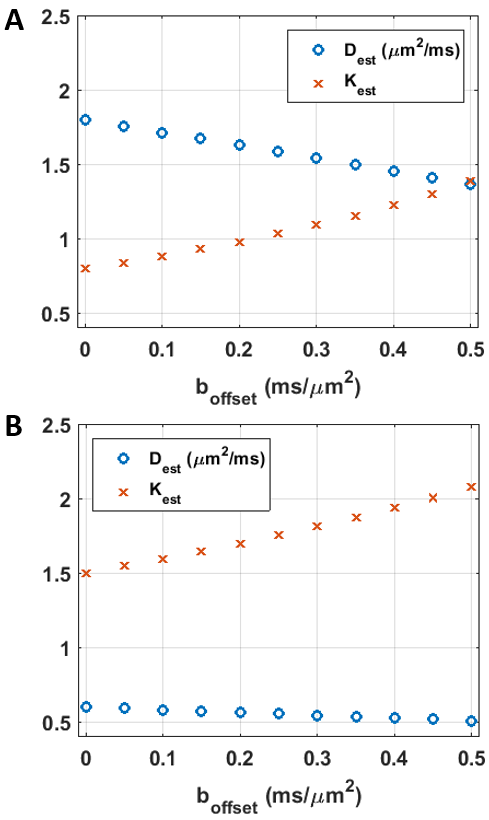
effective b-value, some offset (bGd)
is still expected from the GGd2
term. The impact of this offset, as well as that of effective extra-cellular
space suppression and fiber dispersion were briefly assessed through
simulations based on the two-compartment model (Fig.1).
Results
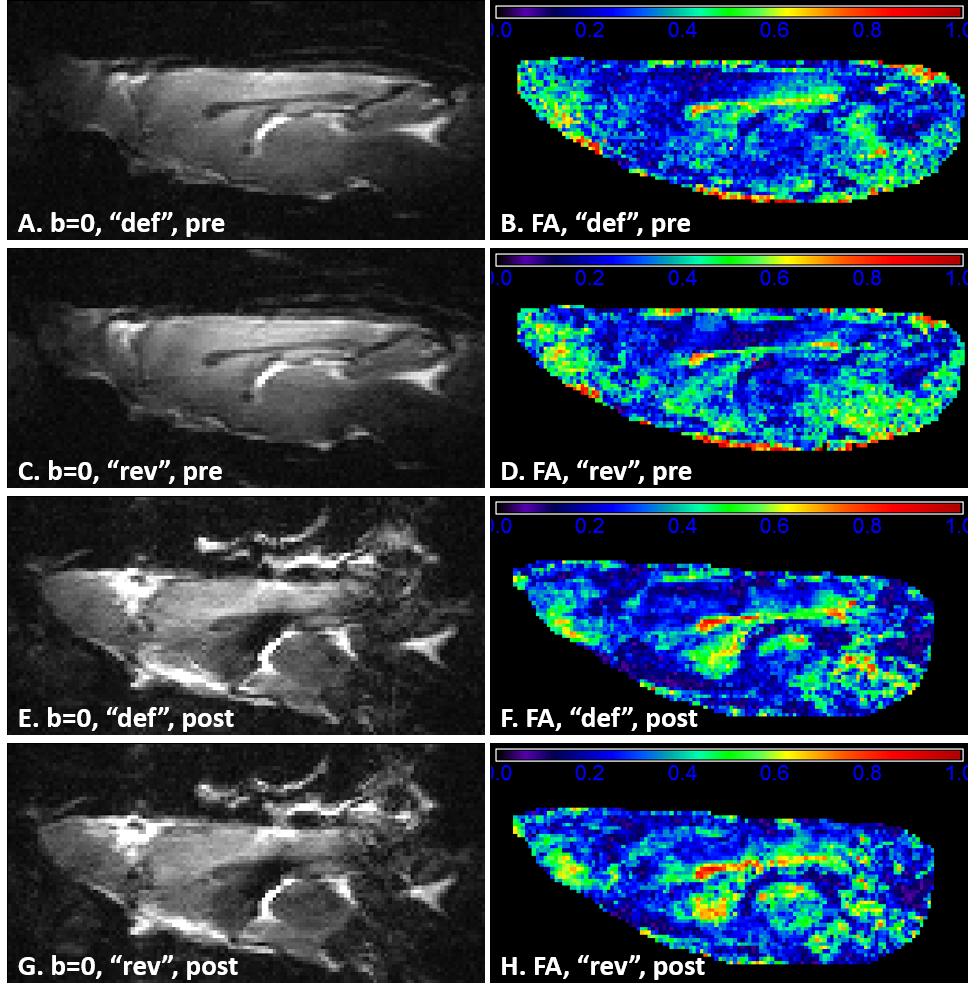
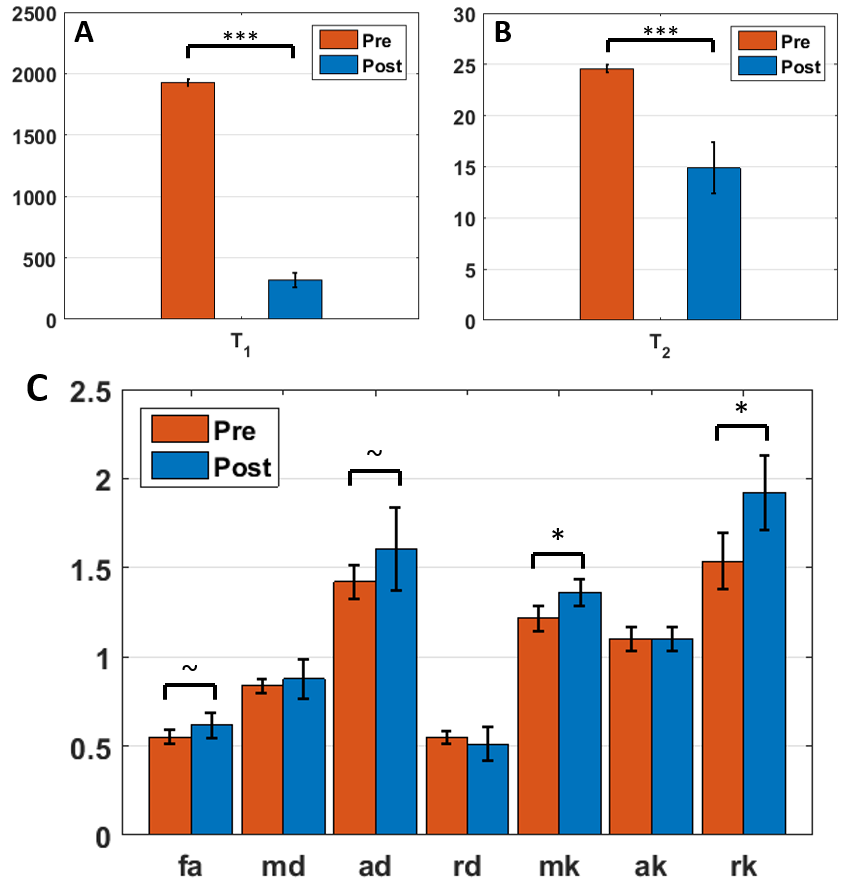
Pre- and post-Gd diffusion images are shown in Fig.2. Post-Gd, T1 and T2 were significantly shortened (p<0.001) (Fig.3). None of the DTI metrics were significantly altered, although a trend in increased FA and increased AD were found (p<0.1) (Fig.3). Mean and radial kurtoses were significantly increased (p<0.05).
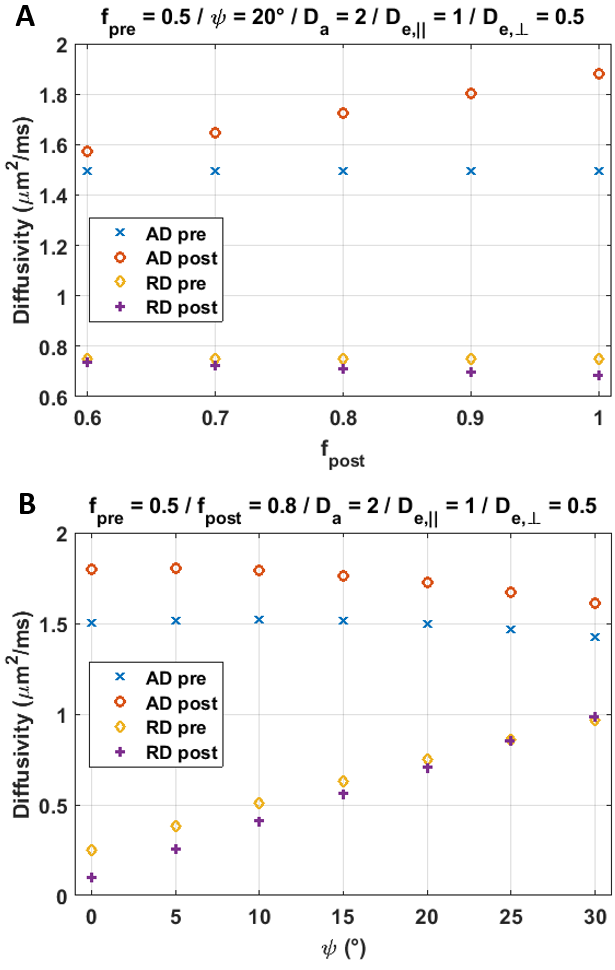
Simulation results are collected in Figs. 4-5. The bGd offset causes an underestimation of diffusivity and an overestimation of kurtosis.
Discussion
Although the increase in AD was not significant, results suggest nonetheless that Da>De,||. Indeed, besides the suppression of the extra-axonal signal, several factors can affect the post-Gd AD and most of them act towards reducing the apparent difference. First, simulations show that a realistic fiber dispersion10,11 of 20–30° should reduce the difference between ADpre and ADpost. Second, the bGd offset would cause an underestimation of ADpost. Finally, the post-Gd data suffer from higher variability, due to variable perfusion efficiency and lower SNR.
The measured changes in RD were minor (Fig.3), as predicted by the simulations (Fig.4).
The kurtosis tensor was estimated mainly to improve the accuracy of the diffusion tensor12. Interestingly though, with reduced contribution from one compartment, the overall kurtosis of the system was expected to decrease, while RK increased significantly. This is likely due to lower SNR in the post-Gd data combined with a Rician noise profile. The overestimation of kurtosis due to bGd could also have impacted the outcome.
Future work will focus on accounting for the differences in SNR between pre- and post-Gd. A larger sample size will reinforce statistical analysis and also allow us to perform correlations between changes in T1 (or T2) and diffusion metrics. Finally, an estimation of both solutions of the NODDIDA model parameters1 in the pre-Gd data could provide better insight into DTI changes in the post-Gd data.
Conclusion
In this experiment, we sought an indirect measurement of compartment diffusivities which would (in)validate diffusion model assumptions. Results suggest that Da>De,|| but further data and analysis are required to confirm the current trend.Acknowledgements
This work was supported by the Centre d'Imagerie Bio-Médicale (CIBM) of the University of Lausanne (UNIL), the Swiss Federal Institute of Technology Lausanne (EPFL), the University of Geneva (UniGe), the Centre Hospitalier Universitaire Vaudois (CHUV), the Hôpitaux Universitaires de Genève (HUG) and the Leenaards and the Jeantet Foundations.References
1. Jelescu IO, Veraart J, Fieremans E and Novikov DS, Degeneracy in model parameter estimation for multi-compartmental diffusion in neuronal tissue. NMR in Biomed 2016;29(1):33-47.
2. Novikov DS, Jelescu IO and Fieremans E, From diffusion signal moments to neurite diffusivities, volume fraction and orientation distribution: An exact solution. Proc. of the ISMRM 2015, p. 469.
3. Fieremans E, Jensen JH and Helpern JA, White matter characterization with diffusional kurtosis imaging. Neuroimage 2011;58(1):177-88.
4. Zhang H, Schneider T, Wheeler-Kingshott CA and Alexander DC, NODDI: practical in vivo neurite orientation dispersion and density imaging of the human brain. Neuroimage 2012;61(4):1000-16.
5. Dhital B, Kellner E, Reisert M and Kiselev VG, Isotropic diffusion weighting provides insight on diffusion compartments in human brain white matter in vivo. Proc. of the ISMRM 2015, p. 2788.
6. Skinner NP, Kurpad SN, Schmit BD et al., Rapid in vivo detection of rat spinal cord injury with double-diffusion-encoded magnetic resonance spectroscopy. Magn Reson Med 2016; doi: 10.1002/mrm.26243.
7. Silva MD, Omae T, Helmer KG et al., Separating changes in the intra- and extracellular water apparent diffusion coefficient following focal cerebral ischemia in the rat brain. Magn Reson Med 2002;45(5):826-37.
8. Van de Looij Y, Kunz N, Hüppi P et al., Diffusion tensor echo planar imaging using surface coil transceiver with a semiadiabatic RF pulse sequence at 14.1T. Magn Reson Med 2011;65(3):732-7.
9. Veraart J, Sijbers J, Sunaert S et al., Weighted linear least squares estimation of diffusion MRI parameters: strengths, limitations and pitfalls. Neuroimage 2013;81:335-46.
10. Leergaard TB, White NS, de Crespigny A, et al., Quantitative histological validation of diffusion MRI fiber orientation distributions in the rat brain. PLoS One 2010;5(1):e8585.
11. Ronen I, Budde M, Ercan E, et al., Microstructural organization of axons in the human corpus callosum quantified by diffusion-weighted magnetic resonance spectroscopy of N-acetylaspartate and post-mortem histology. Brain Struct. Funct. 2014;219(5):1773-85.
12. Veraart J, Poot DH, Van Hecke W et al., More accurate estimation of diffusion tensor parameters using diffusion kurtosis imaging. Magn Reson Med 2011;65(1):138-45.
Figures