0278
Comparison of Double Diffusion Encoding and NODDI1Electrical Engineering, Stanford University, Stanford, CA, United States, 2Radiology, Stanford University, Stanford, CA, United States
Synopsis
In this study, we compare fractional eccentricity (FE) measured by double diffusion encoding (DDE) to NODDI estimates of neurite density and orientation distribution in six normal subjects and one subject with benign T2 hyperintensities. The results of the comparison support the hypothesis that FE is independent of fiber orientation and correlates strongly with intracellular volume fraction.
Introduction
Using fractional anisotropy (FA) to assess neurodegeneration can lead to ambiguity between fiber integrity and orientation distribution, since a majority of white matter voxels are thought to contain multiple fiber orientations1. Double diffusion encoding (DDE)2-8 enables measurement of the shape (eccentricity) of tissue compartments (microscopic anisotropy) independent of the orientation distribution of those compartments within a voxel. Prior work demonstrates that DDE indices of microscopic anisotropy, such as fractional eccentricity (FE), exhibit a narrower distribution in white matter compared to FA, which is thought to reflect their independence of fiber orientation distribution7. In this study, we compare FE measured by DDE8 to Neurite Orientation Distribution and Density Imaging (NODDI)9 estimates of intracellular volume fraction (FICVF) and orientation distribution (ODI) in order to further validate that FE is independent of fiber orientation and correlates strongly with intracellular volume fraction.Methods
Data Acquisition: IRB approved experiments were conducted on six normal subjects and one subject with benign T2 hyperintensities using a 3T whole-body MR system (MR750, GE Healthcare, Madison, Wisconsin; 50 mT/m, 200 mT/m/s gradients) equipped with a 32-channel phased array head coil (Nova Medical). DDE images were obtained with single-SE-EPI with bipolar diffusion gradients on either side of the refocusing pulse. Scan parameters were: TE/TR = 130/10563 ms, 2×2×2mm3 resolution, 77 axial slices, ASSET R = 2, and mixing time Tm = 45 ms. For each diffusion encoding pair: b = 860 s/mm2, δ = 19 ms, Δ = 21 ms, G = 50 mT/m, gradient rise time = 1 ms. A 120 orientation gradient scheme8 was employed for a scan time of 20 min. In addition T1w MPRAGE and NODDI data were acquired for each subject. The NODDI acquisition used a single pulsed diffusion acquisition with 60 diffusion directions at b=1000 s/mm2 and 80 directions at b = 2500 s/mm2.
Data Analysis: Baseline diffusion images were corrected for eddy current distortions and bulk motion using “eddy” and “topup” from the FMRIB Software Library. The single pulsed diffusion data was used to fit intracellular volume fraction (FICVF), isotropic volume fraction (FISO), and orientation dispersion index (ODI) according to the NODDI model9. The DDE images were used to compute FE. White matter tracts were segmented using Automated Fiber Quantification11. The NODDI measures were correlated with FA and FE for all normal volunteers.
Results and Discussion
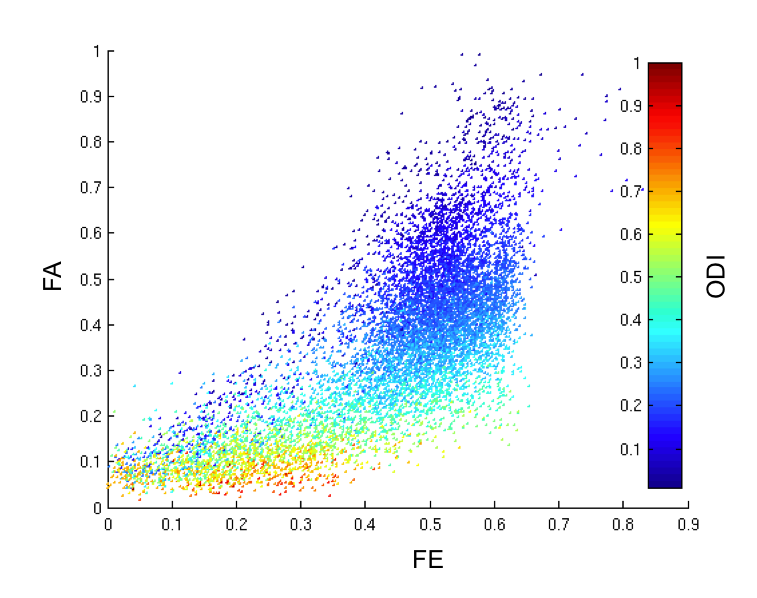
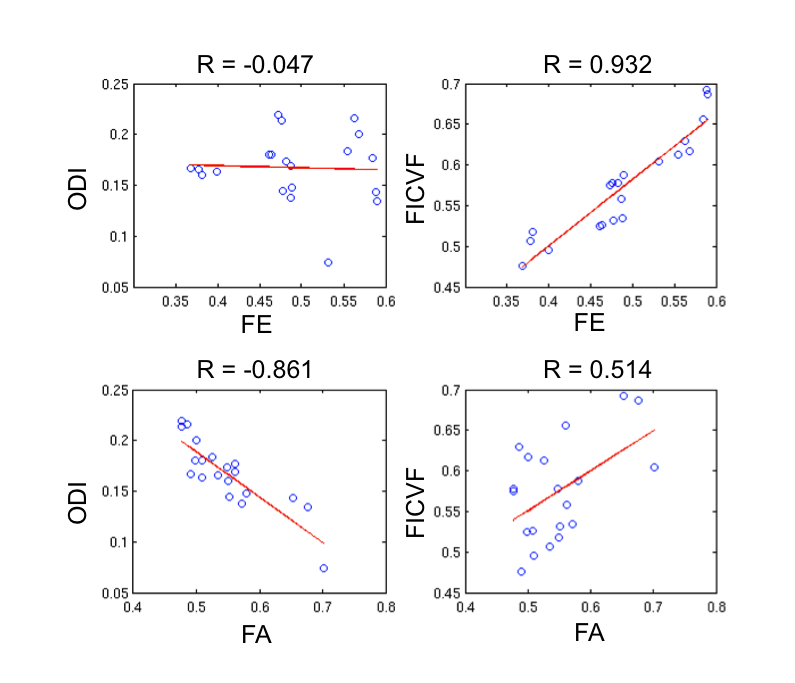
The FE, FA, and ODI are plotted along nine different white matter tracts in the six normal volunteers in Figure 1. Compared to FA, FE shows less variation along white matter tracts and less correlation with ODI. In a voxel-wise correlation of FA and FE across global white matter, there was strong correlation (R=0.8935) between FA and FE for voxels with low orientation dispersion (ODI<0.1). There is moderate correlation (R=0.7018) for voxels with moderate dispersion (0 .1<ODI <0.5), and weak correlation (R=0.5606) for voxels with high dispersion (ODI >.5). In single fiber regions, FA and FE are expected to both measure the net diffusion anisotropy. In crossing fiber regions FA should primarily reflect orientation dispersion while FE should reflect microscopic anisotropy. In a correlation of FE with NODDI parameters across white matter tracts, we found FE to be strongly correlated (R=0.932) with FICVF, but not with ODI (R=-0.047). In contrast, FA is only weakly correlated (R=0.514) to FICVF, but strongly negatively correlated (R=-0.861) with ODI as shown in Figure 3. This supports the hypothesis that variations in FA are primarily driven by the presence of fanning or crossing fibers, while changes in FE more closely reflect differences in intracellular volume fraction. Figure 4 depicts the appearance of T2 hyperintensities on FE, FA and NODDI parameters and demonstrates that the T2 hyperintensities are more easily visualized with FE and FICVF compared to FA.Conclusions
Through comparison with NODDI, DDE FE-maps were confirmed to be independent of orientation dispersion and strongly correlated with intracellular volume fraction. FE was also shown to provide better visualization of T2 hyperintensities compared to FA. These results support the hypothesis that FE provides a more specific measure of fiber integrity compared to FA and therefore may provide significant advantages for assessing neurodegeneration.Acknowledgements
Funding provided by an NSF-GRFP, a Li-Ka Shing-Oxford-Stanford Big Data in Human Health Seed grant, NIH: R01-NS095985, S10-RR026351, P41-EB015891, Stanford Radiology Angel Funds, and GE Healthcare. Thanks for assistance from Matthew Middione and Ek Tsoon Tan with pulse sequence design and Maged Goubran for data processing.References
1 Jeurissen, B., Leemans, A., Tournier, J. D., Jones, D. K., & Sijbers, J. (2013). Investigating the prevalence of complex fiber configurations in white matter tissue with diffusion magnetic resonance imaging. Hum Brain Mapp, 34(11), 2747-2766. doi:10.1002/hbm.22099
2 Mitra, P. P. (1995). Multiple wave-vector extensions of the NMR pulsed-field-gradient spin-echo diffusion measurement. Phys Rev B Condens Matter, 51(21), 15074-15078.
3 Koch, M. A., & Finsterbusch, J. (2008). Compartment size estimation with double wave vector diffusion-weighted imaging. Magn Reson Med, 60(1), 90-101. doi:10.1002/mrm.21514
4 Shemesh, N., & Cohen, Y. (2011). Microscopic and compartment shape anisotropies in gray and white matter revealed by angular bipolar double-PFG MR. Magn Reson Med, 65(5), 1216-1227. doi:10.1002/mrm.22738
5 Ozarslan, E., & Basser, P. J. (2008). Microscopic anisotropy revealed by NMR double pulsed field gradient experiments with arbitrary timing parameters. J Chem Phys, 128(15), 154511. doi:10.1063/1.2905765
6 Lawrenz, M., & Finsterbusch, J. (2011). Detection of microscopic diffusion anisotropy on a whole-body MR system with double wave vector imaging. Magn Reson Med, 66(5), 1405-1415. doi:10.1002/mrm.22934
7 Lawrenz, M., & Finsterbusch, J. (2015). Mapping measures of microscopic anisotropy in human brain white matter in vivo with double-wave-vector diffusion-weighted imaging. Magn Reson Med, 73(2), 773-783. doi:10.1002/mrm.25140
8 Jespersen, S. N., Lundell, H., Sonderby, C. K., & Dyrby, T. B. (2013). Orientationally invariant metrics of apparent compartment eccentricity from double pulsed field gradient diffusion experiments. NMR Biomed, 26(12), 1647-1662. doi:10.1002/nbm.2999
9 Zhang, H., Schneider, T., Wheeler-Kingshott, C. A., & Alexander, D. C. (2012). NODDI: practical in vivo neurite orientation dispersion and density imaging of the human brain. Neuroimage, 61(4), 1000-1016. doi:10.1016/j.neuroimage.2012.03.072
10 Yang, G., Tian, Q., Leuze, C., & McNab, J. Optimizing the Gradient Encoding Scheme of Double Diffusion Encoding MRI for Obtaining Rotationally Invariant Metrics of Microscopic Anisotropy [abstract]. In: Proceedings of the ISMRM Diffusion Workshop: 2016, Sept. 11-16; Lisbon, Portugal, Abstract nr 44.
11 Yeatman, J. D., Dougherty, R. F., Myall, N. J., Wandell, B. A., & Feldman, H. M. (2012). Tract profiles of white matter properties: automating fiber-tract quantification. PLoS One, 7(11), e49790. doi:10.1371/journal.pone.0049790
Figures