0273
Visualization of Carotid Plaque: T1-SPACE vs. Compressed Sensing T1-SPACE1Department of Diagnostic Imaging and Nuclear Medicine, Graduate School of Medicine, Kyoto University, Kyoto, Japan, 2Human Brain Research Center, Graduate School of Medicine, Kyoto University, Kyoto, Japan, 3Siemens Japan K.K., Tokyo, Japan
Synopsis
Compressed sensing (CS) algorithm has been brought into MRI. CS realizes iterative reconstruction of images from incoherently under-sampled data, which leads to shorter acquisition time. A 3D T1-weighted fast spin echo (T1-FSE) scan has been often used for plaque imaging. We compared visualization of carotid plaque and internal carotid artery (ICA) between 3D T1-FSE imaging with SPACE and with a prototype CS SPACE. In the result, CS-T1-SPACE revealed an equivalent visualization compared with T1-SPACE in evaluation of carotid plaque and ICA. CS-T1-SPACE would be useful for the visualization of carotid plaque and ICA.
Introduction
Intra-plaque hemorrhage is a critical factor in the growth of atherosclerotic plaques and its destabilization, which can be detected using a T1-weighted fat-suppressed MRI.1 Therefore, it is important to establish a method for visualizing the carotid plaque.2 A 3D T1-weighted fast spin echo (T1-FSE) scan has been often used for plaque imaging, however, long acquisition time is one of drawbacks of 3D sequence. Recently, compressed sensing (CS) algorithm has been brought into MRI and been applied to SPACE.3 CS realizes iterative reconstruction of images from incoherently under-sampled data using a regularization term 4, which leads to shorter acquisition time. If the visualization of the carotid plaque and internal carotid artery (ICA) is equal or better in CS sequence, CS is more useful for evaluating carotid plaques owing to shorter acquisition time. The purpose of this study is to compare visualization of carotid plaque and ICA between 3D T1-FSE imaging with SPACE and with a prototype CS SPACE.Methods
Subjects
This study was approved by the institutional review board. Seventeen patients (mean age 71, range 35-83 years; 14males and 3 females) were enrolled, who had MRI examinations for evaluating stenosis and the plaque of cervical ICA from June 2016 to October 2016.
Image Acquisition
Scan was conducted using a 3T-MR system (MAGNETOM Skyra, Siemens Healthcare GmbH, Erlangen, Germany) with a 32-channel head coil. The pulse sequence parameters were as follows. T1-weighted SPACE (T1-SPACE): coronal acquisition; TR/TE, 727/11.0 ms; variable flip angle; echo-train length, 32; FOV, 216 × 240 mm; voxel size, 0.75 × 0.75 × 0.75 mm3; GRAPPA, 3×; SPAIR fat suppression; and acquisition time, 7 minutes 9 seconds. CS-T1-SPACE prototype: coronal acquisition; TR/TE, 650/11.0 ms; variable flip angle; echo-train length, 32; FOV, 240 × 240mm, voxel size, 0.75 × 0.75 × 0.75mm3; acceleration factor, 10×; SPAIR fat suppression; and acquisition time, 2minutes 49 seconds.
Image Analysis and Statistical Analysis
The image volumes of T1-SPACE and CS-T1-SPACE were reconstructed in axial image of 1 mm thickness. Visualization of (a) carotid plaque, (b) intravascular lumen of ICA, and (c) sternocleidomastoid muscle was evaluated on the axial plane using ImageJ software ver. 1.50 (http://imagej.nih.gov/ij/). When visualization of T1-SPACE and CS-T1-SPACE are compared, the one with better visualization will have 3 points, and the one with worse visualization will have 1 point. If both have equal visualization, both will have 2 points. We defined better visualization as clearer delineation of (a) carotid plaque and (c) sternocleidomastoid muscle. We also defined better visualization as less artifact, i.e. signal, in the intravascular lumen of (b) ICA. The total scores were compared between T1-SPACE and CS-T1-SPACE using Wilcoxon signed-rank test. A P value less than 0.05 was considered statistically significant.
Results
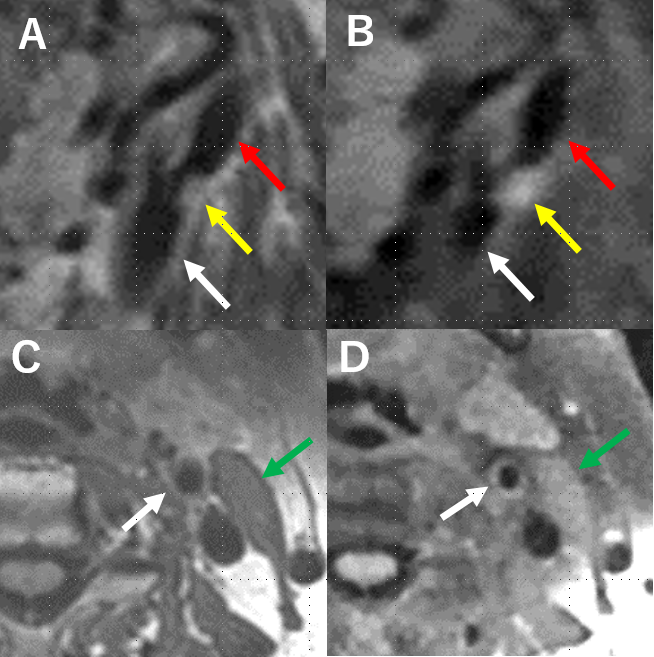
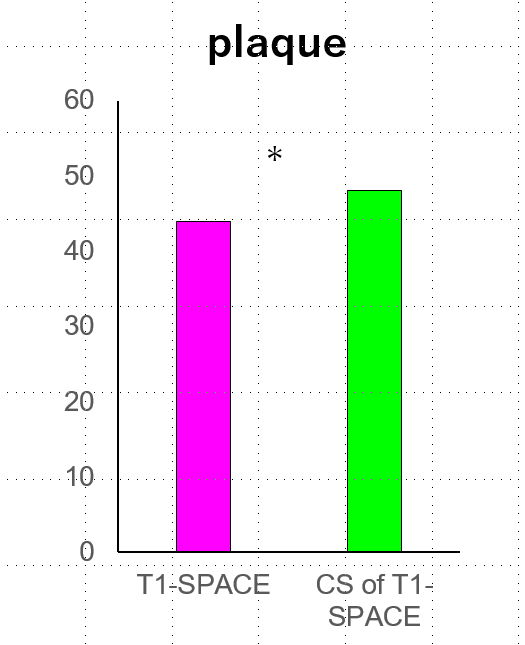
(a) Carotid plaques were found in 23 of 34 ICAs, and no plaque were found in the rest. The total score of CS-T1-SPACE (48 points) was better than that of T1-SPACE (44 points) for evaluating carotid plaques (P=0.5469). (Figure 1, 3)
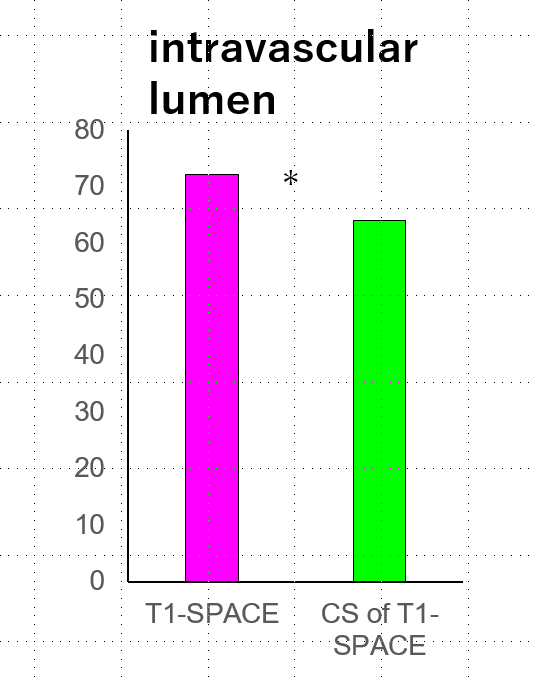
(b) Intravascular lumen of 34 ICAs were evaluated. The total score of T1- SPACE (72 points) was better than CS-T1-SPACE (64 points) for evaluating intravascular lumens of ICAs (P=0.1250). (Figure 1, 4)
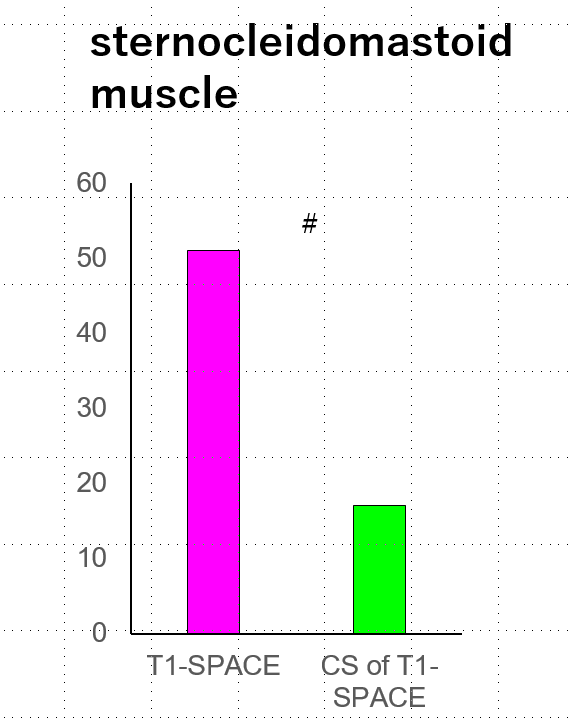
(c) Seventeen left-side sternocleidomastoid muscles were evaluated. The total score of sternocleidomastoid muscles was better at T1-SPACE than CS-T1-SPACE (P<0.0001). (Figure 1, 5)
Consequently, the acceleration factor for CS-T1-SPACE should be chosen more conservative for this application.
Discussion
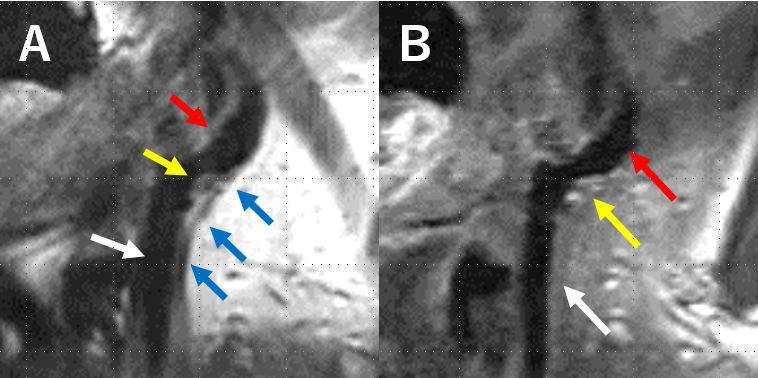
CS-T1-SPACE revealed an equivalent visualization compared with T1-SPACE in evaluation of carotid plaque and vessel lumen of ICA. Acquisition time of CS-T1-SPACE is approximately three times shorter than that of T1-SPACE, which will be beneficial for patients. Physiological movement such as swallowing, arterial pulsation, and breathing induced motion artifacts in plaque imaging on MRI 5, and plaque imaging with shorter acquisition time is expected to be the imaging with less artifact (Figure 2). As the depiction of sternocleidomastoid muscle may influence the quantitative analysis such as plaque/muscle ratio, the acceleration was chosen to high for this application. Blurring is the result in applications with not enough sparsity in the images. Consequently, the sampling factor for CS-T1-SPACE should be chosen higher. Secondly, the contrast was different in the compared images, which is not due to acceleration, but differences in the scan parameters.Conclusion
CS-T1-SPACE revealed an equivalent visualization compared with T1-SPACE in evaluation of carotid plaque and vessel lumen of ICA.Acknowledgements
We are grateful to Dr. Bernd Kuehn and Dr. Esther Raithel for their help.References
1. Altaf N, MacSweeney ST, Gladman J, Auer DP. Carotid intraplaque hemorrhage predicts recurrent symptoms in patients with high-grade carotid stenosis. Stroke. 2007;38(5):1633-5.
2. Narumi S, Sasaki M, Natori T, et al. Carotid plaque characterization using 3D T1-weighted MR imaging with histopathologic validation: a comparison with 2D technique. Am J Neuroradiol. 2015;36(4):751-6.
3. Fritz J, Raithel E, Thawait GK, Gilson W, Papp DF. Six-Fold Acceleration of High-Spatial Resolution 3D SPACE MRI of the Knee Through Incoherent k-Space Undersampling and Iterative Reconstruction-First Experience. Invest Radiol. 2016 Jun;51(6):400-9.
4. Lustig M, Donoho D, Pauly JM. Sparse MRI: the application of compressed sensing for rapid MR imaging. Magn Reson Med 2007; 58(6):1182–1195.
5. Boussel L, Herigault G, de la Vega A, et al. Swallowing, arterial pulsation, and breathing induce motion artifacts in carotid artery MRI. J Magn Reson Imaging. 2006;23(3):413-5.
Figures