0270
Highly sensitive pH mapping during ischemia using Total Fast-exchanging Protons (TFP) imaging1kirby Center / Radiology Department, Kennedy Krieger Institute / Johns Hopkins Univeristy, baltimore, MD, United States, 2Department of Anesthesiology/Critical Care Medicines, Johns Hopkins University School of Medicine, Baltimore, MD, United States, 3Department of Electronic Science, Xiamen University, Xiamen, People's Republic of China, 4Bernard and Irene Schwartz Center for Biomedical Imaging, New York University School of Medicine, New York, NY, United States
Synopsis
Ischemia in a mouse stroke model was assessed by pH mapping using the on-resonance variable-delay multi-pulse (onVDMP) CEST scheme. In the method, an on-resonance binomial pulse train is applied at the water resonance to achieve high labeling efficiency for fast-exchanging protons. Since the CEST signal intensity for the total fast-exchanging protons is far greater than that of amide protons, high detection sensitivity is expected. The final stroke region determined by the method was verified by histologic analysis.
Purpose
The current study aims to develop a sensitive MRI technique to characterize regional variations in pH during acute ischemia. Recently, so-called amide proton transfer weighted (APTw) MRI has shown potential in mapping regions potentially at risk of infarction by detecting the early occurrence of anaerobic metabolism through its effect on pH (1-6). However, the sensitivity of the APTw MRI method in terms of CEST signal intensity is limited due to its low exchange rate (<30 Hz). The amine and hydroxyl groups in proteins and metabolites have exchange rates higher than 1 kHz, and are expected to be far more sensitive sensors in terms of SNR (7, 8). One issue to address with the high exchange rates is low labeling efficiency when using conventional CEST techniques. We applied the on-resonance variable delay multi pulse (onVDMP) scheme (9) to map the pH changes with high signal sensitivity.Methods
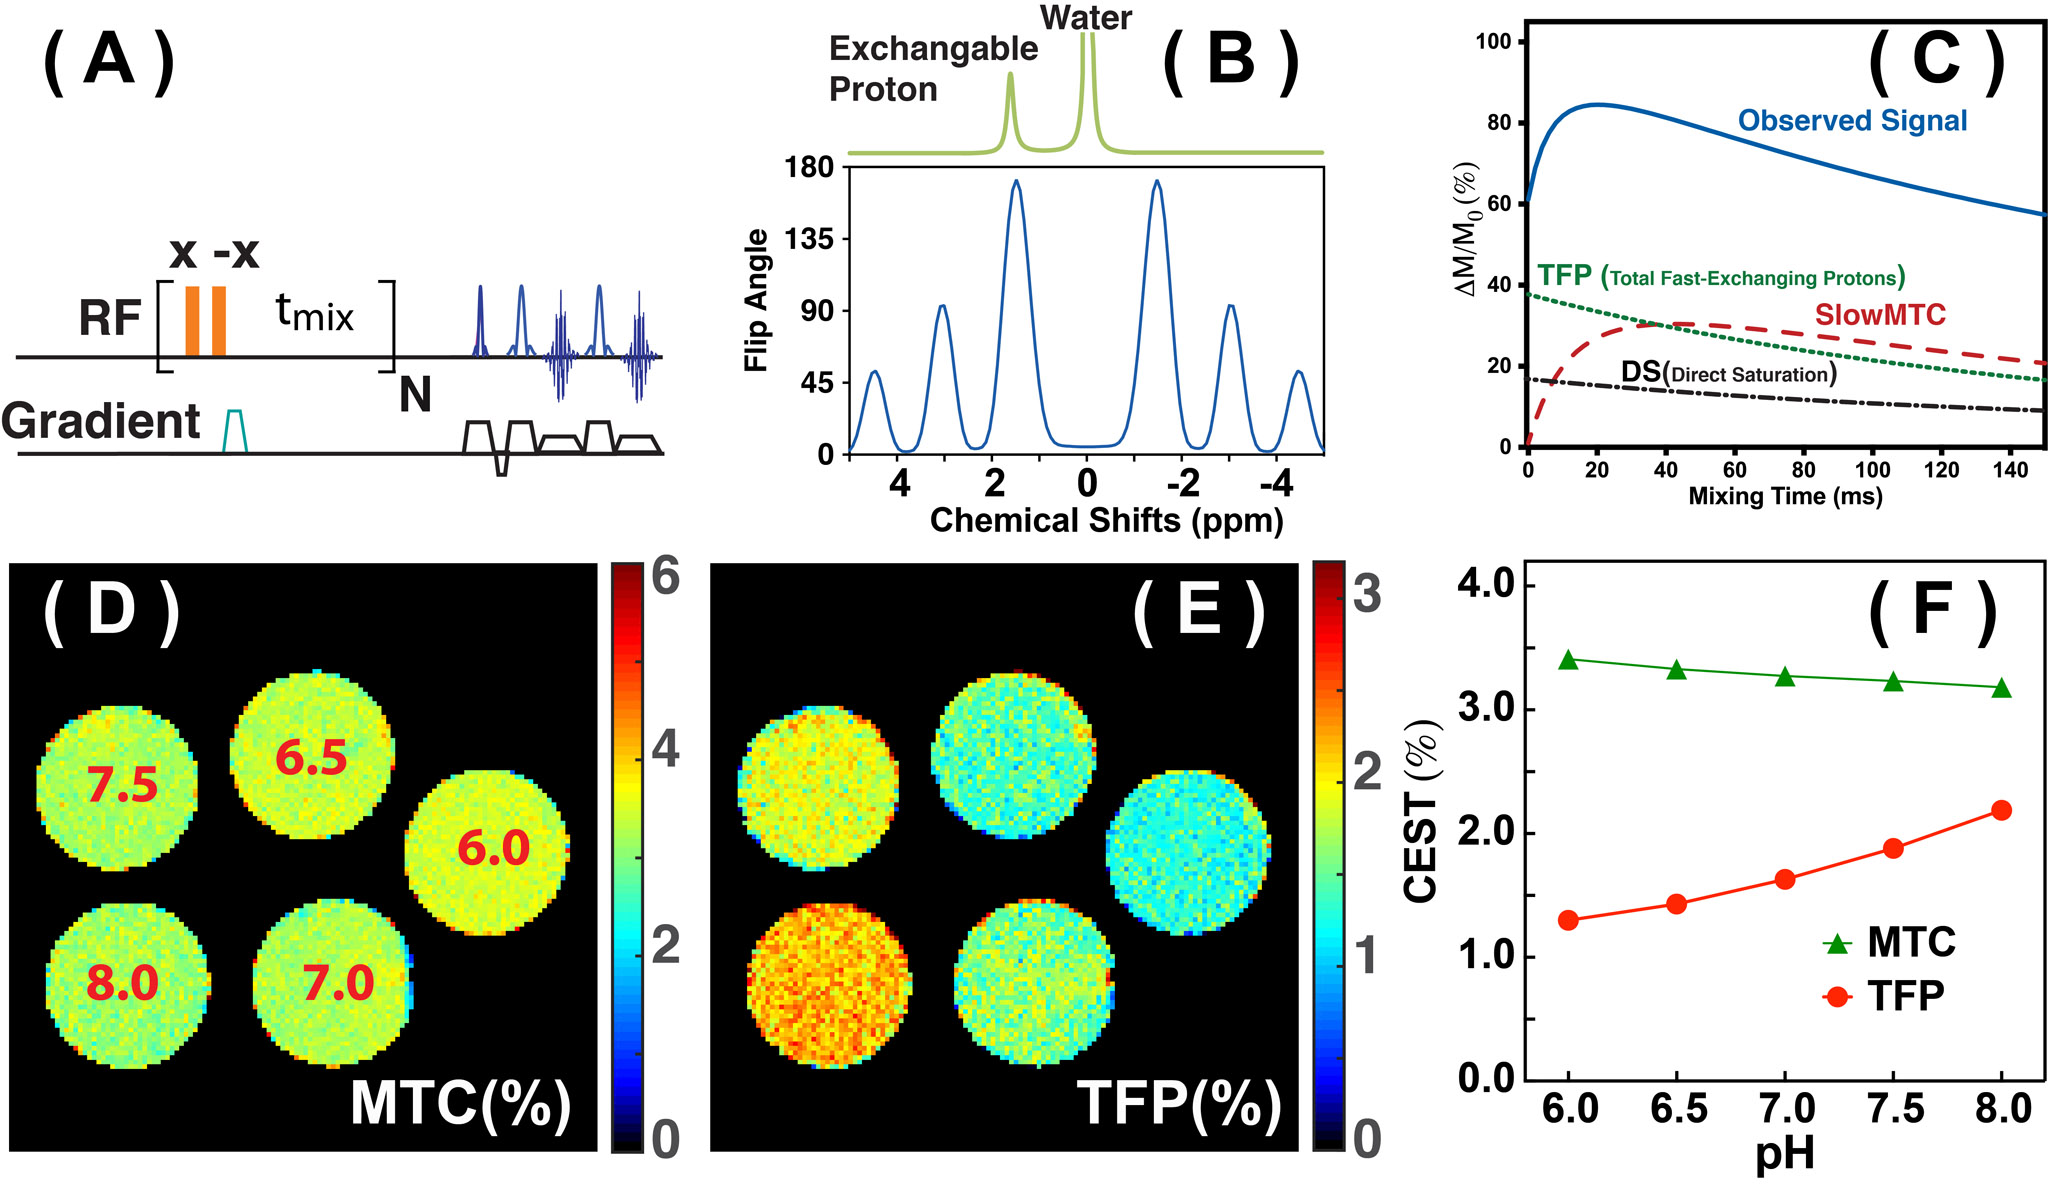
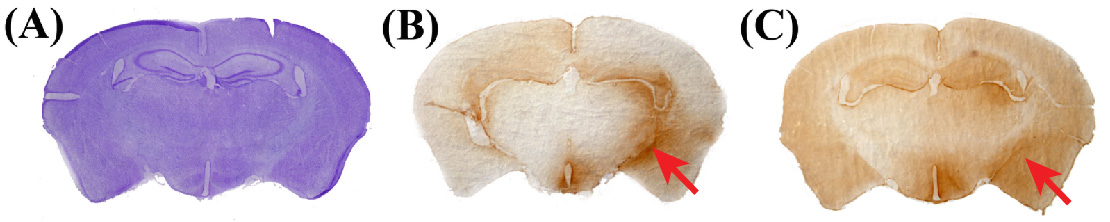
Most ischemic strokes in humans are caused by the rupture of atherosclerotic plaques present in arterial vessels. In order to closely mimic human events, a mouse atherothrombotic model was introduced by a series of intra-arterial injections of collagen through a catheter near the middle cerebral artery (MCA) (N=3) (10). The MRI experiments were performed at three hours post-onset. Immediately after MRI, coronal sections were cut in a cryostat at 50 μm were used for histologic analyses, including heat shock protein (HSP) 72 antibody, cresyl violet (CV), and immunoglobulin G (IgG). The HSP72 stain was used to render peri-infarct regions; the CV stain was used to identify the neuronal structure; and IgG extravasation was used to detect BBB dysfunction. All MRI experiments were performed using a 11.7 T Bruker Biospec system. The on-resonance VDMP sequence consists of a train of high power pulses (N =16) with proper mixing time (tmix) followed by RARE acquisition (Fig. 1A). A simple binomial pulse composed of two rectangular pulses with alternating phase was used (2 ms length, B1 of 41.8 µT). The high saturation power used can achieve improved labeling efficiency for fast-exchanging protons. A perfusion map on whole brain was acquired using the steady pulse imaging and labeling (SPIL) scheme (11). Phantoms with cross-linked 10%w/w BSA of different pH values were used to verify the pH sensitivity of the method.
Results and Discussion
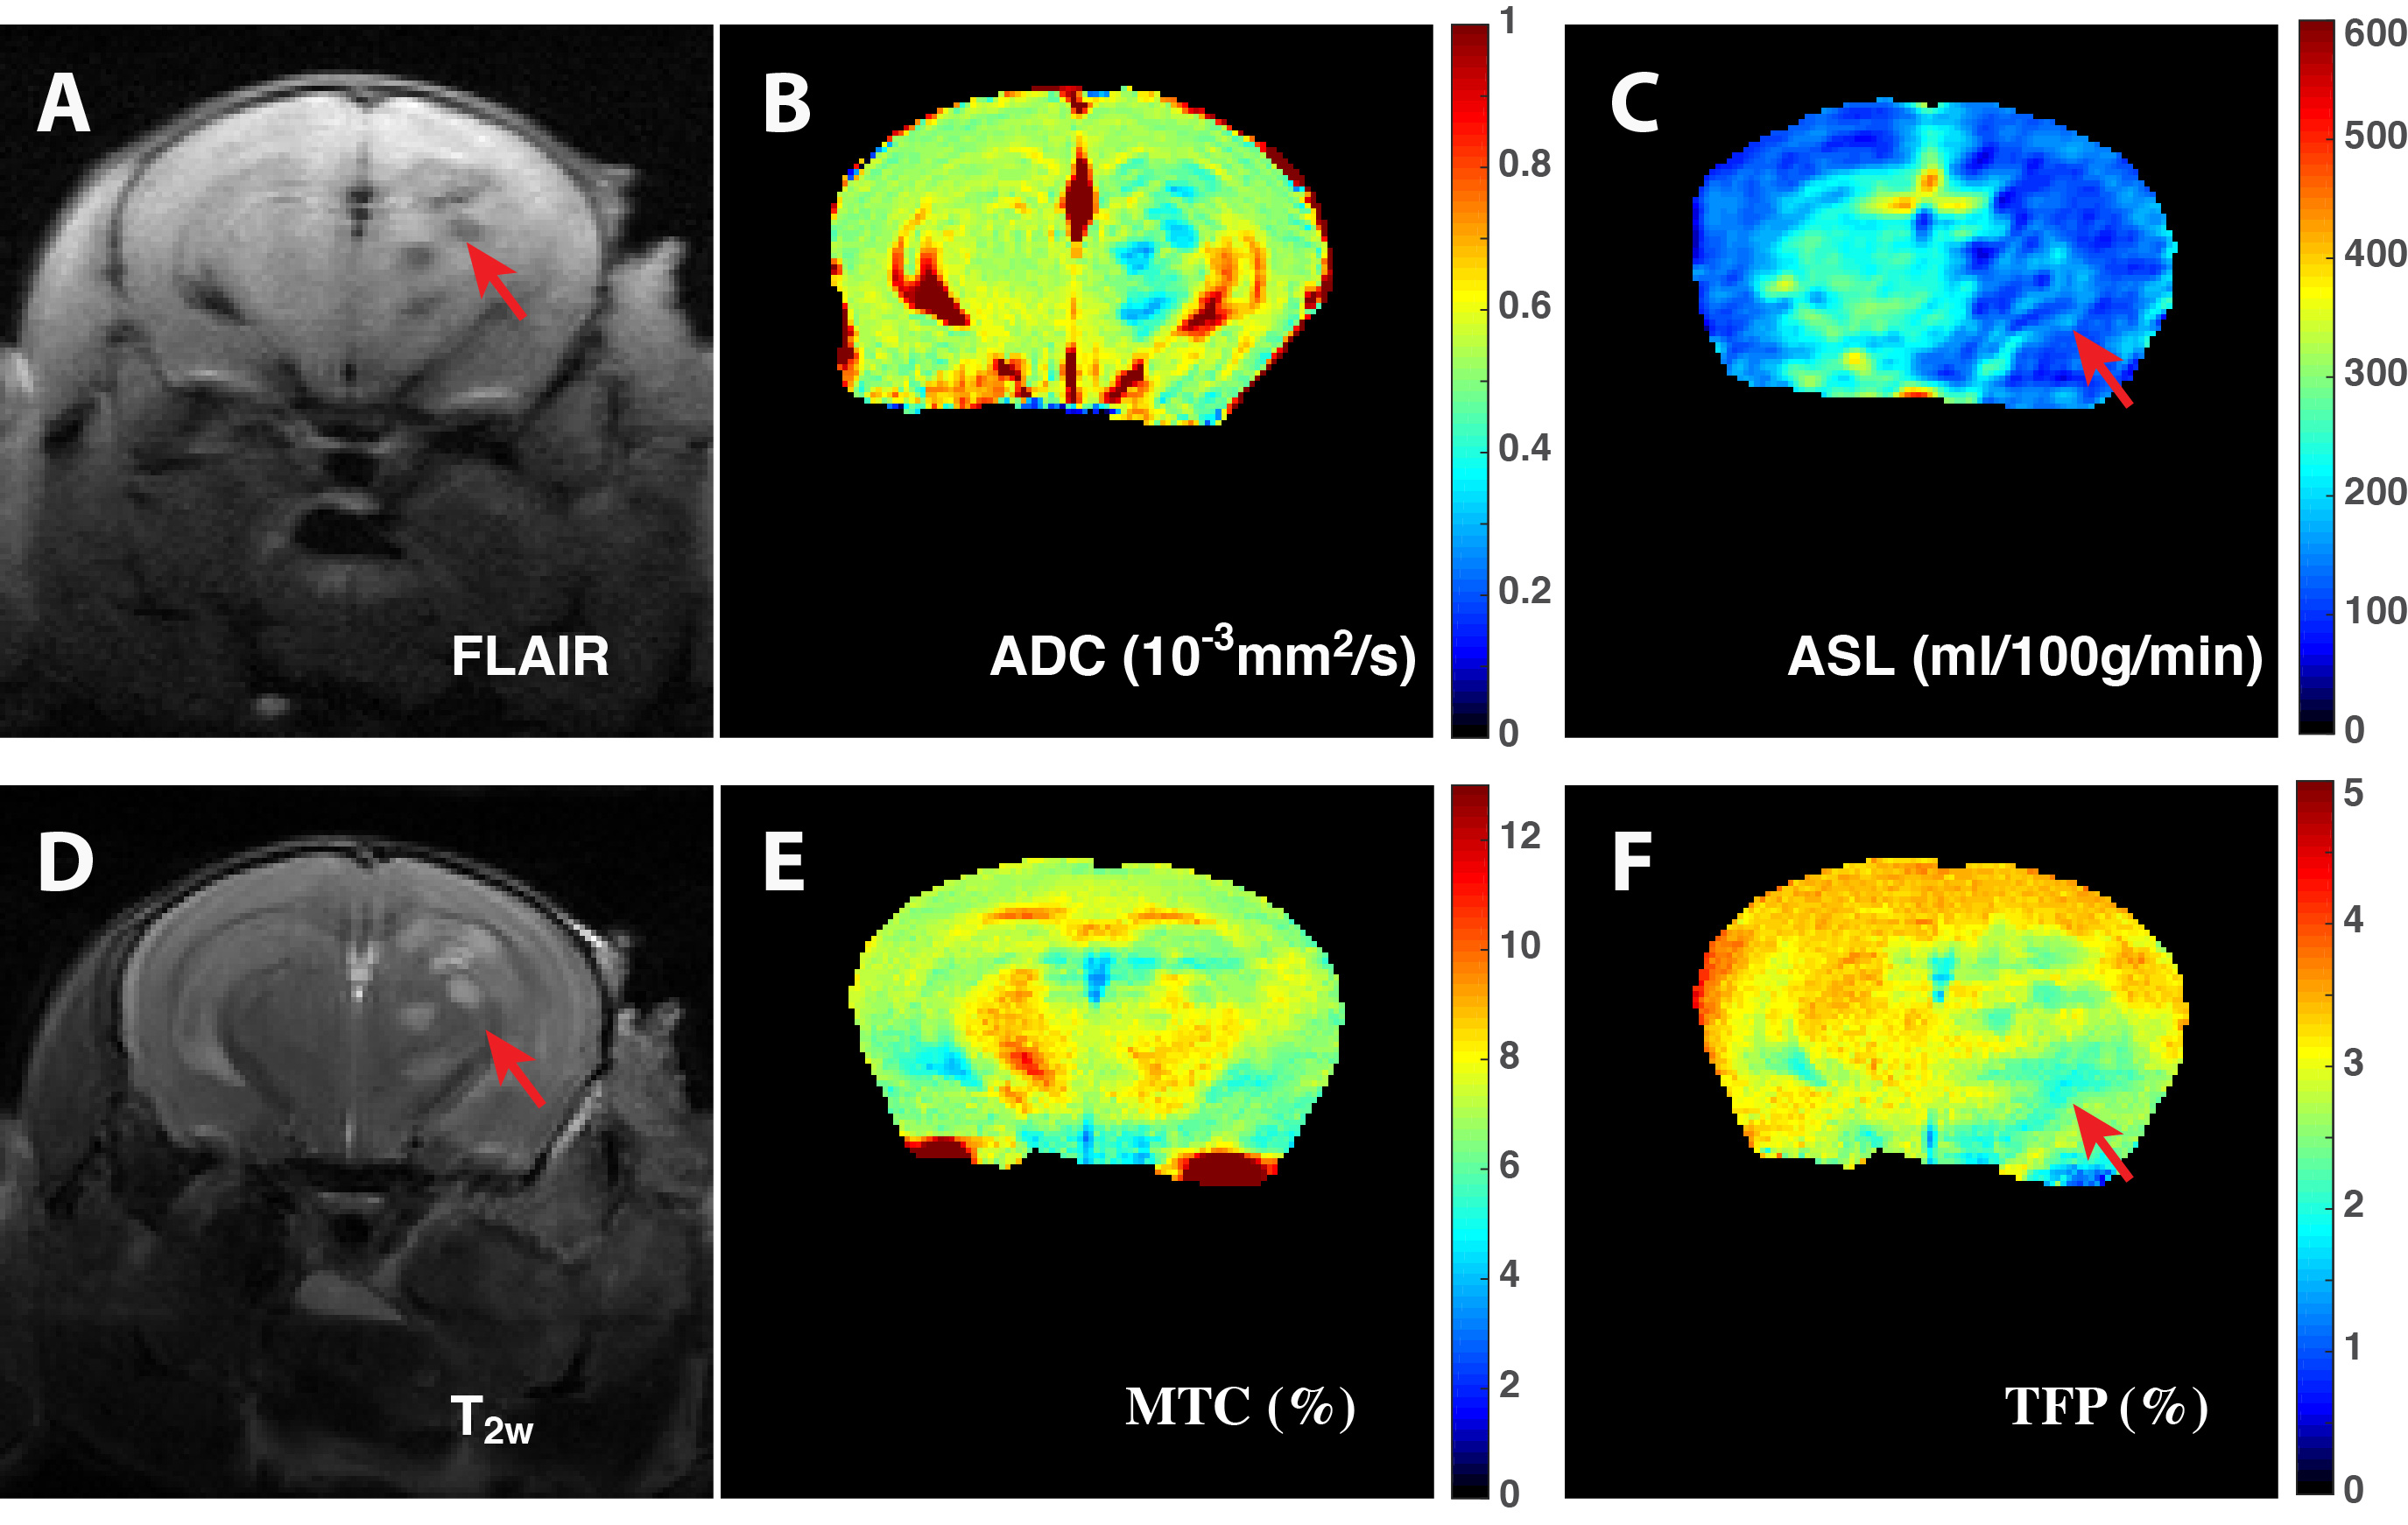
In onVDMP MRI, the water magnetization is barely affected by the binomial pulse, while the fast-exchanging protons (TFP) and magnetization transfer contrast (MTC) pools are labeled (Fig. 1B). The VDMP buildup curves, i.e. water signal reduction with respect to the inter-pulse delay (tmix), were fitted by a three-pool model to separate and quantify MTC and TFP based on their completely different VDMP buildup patterns (Fig. 1C). The MTC and TFP maps on the cross-linked BSA (Fig. 1D, E and F) demonstrate that TFP is highly pH sensitive, while MTC decreases slightly. Typical FLAIR, diffusion, perfusion, T2w, MTC and TFP maps on ischemic mouse brain are presented in Figures 2A-F, respectively. The brain regions with infarction can be clearly identified on FLAIR, T2w and diffusion images. The hypoperfusion regions (Fig. 2C) indicate low blood supply, and the total volume is greater than that of the infarct region delineated by T2w MRI image (Fig. 2B). The thrombus formation in the cerebral vasculature is hard to predict, and blockage of the brain microvascular flow can happen at the contralateral side (Fig. 2C). The MTC map, which mainly reflects the myelin lipid concentration, did not show notable changes (Fig. 2E). However, TFP values of 1.9% were detected in the ipsilateral cortex (Fig. 2F), which are smaller than in the contralateral brain (3%), indicating that the pH value is reduced in the ischemic region. The volume of the hypo-intense TFP region is smaller than the area extracted by perfusion map, while is much bigger than the volume determined by FLAIR, T1w and diffusion images. Therefore, histological analysis (Fig. 3) was used to access the brain damage. The CV stain map (Fig. 3A) is consistent with the MTC map that no clear demyelination was observed, while the areas affected on both HSP72 (Fig. 3B) and IgG (Fig. 3C) analyses resemble that of the TFP map. Similar observations were also found in two other animals studied.Conclusion
This preliminary study shows that the onVDMP technique has the potential for detecting pH changes during ischemia. The histologic analysis suggests that the pH map may provides a more accurate volume of the ischemic damage than the perfusion map, but a larger correlation study has to be performed to confirm this statistically, which is undergoing.Acknowledgements
Funding Support: NIH grants P41 EB015909, NIH R01EB019934 (NIBIB), P50CA103175 (NCI), R01EB015032 (NIBIB), S10RR028955 (NCRR).References
1. Zhou J, Payen JF, Wilson DA, et al. Using the amide proton signals of intracellular proteins and peptides to detect pH effects in MRI. Nat Med. 2003; 9(8):1085-90. doi:10.1038/nm907
2. Sun PZ, Zhou J, Sun W, et al. Detection of the ischemic penumbra using pH-weighted MRI. J Cereb Blood Flow Metab. 2006; 27(6):1129-36. doi:10.1038/sj.jcbfm.9600424
3. Sun PZ, Benner T, Kumar A, et al. Investigation of optimizing and translating pH-sensitive pulsed-chemical exchange saturation transfer (CEST) imaging to a 3T clinical scanner. Magn Reson Med. 2008; 60(4):834-41. doi:10.1002/mrm.21714
4. McVicar N, Li AX, Goncalves DF, et al. Quantitative tissue pH measurement during cerebral ischemia using amine and amide concentration-independent detection (AACID) with MRI. J Cereb Blood Flow Metab. 2014; 34(4):690-8. doi:10.1038/jcbfm.2014.12
5. Harston GW, Tee YK, Blockley N, et al. Identifying the ischaemic penumbra using pH-weighted magnetic resonance imaging. Brain. 2015; 138(Pt 1):36-42. doi:10.1093/brain/awu374
6. Zhou J, van Zijl PC. Defining an Acidosis-Based Ischemic Penumbra from pH-Weighted MRI. Transl Stroke Res. 2011; 3(1):76-83. doi:10.1007/s12975-011-0110-4
7. Jin T, Wang P, Zong X, et al. Magnetic resonance imaging of the Amine–Proton EXchange (APEX) dependent contrast. NeuroImage. 2012; 59(2):1218-27. doi:10.1016/j.neuroimage.2011.08.014
8. Zong X, Wang P, Kim SG, et al. Sensitivity and source of amine-proton exchange and amide-proton transfer magnetic resonance imaging in cerebral ischemia. Magn Reson Med. 2014; 71(1):118-32. doi:10.1002/mrm.24639
9. Xu J, Chan KW, Xu X, et al. On-resonance variable delay multipulse scheme for imaging of fast-exchanging protons and semisolid macromolecules. Magn Reson Med. 2016:10.1002/mrm.26165. doi:10.1002/mrm.26165
10. Schunke KJ, Toung TK, Zhang J, et al. A novel atherothrombotic model of ischemic stroke induced by injection of collagen into the cerebral vasculature. J Neurosci Methods. 2015; 239:65-74. doi:10.1016/j.jneumeth.2014.10.001
11. Xu J, Qin Q, Wu D, et al. Steady pulsed imaging and labeling scheme for noninvasive perfusion imaging. Magn Reson Med. 2016; 75(1):238-48. doi:10.1002/mrm.25641
Figures