0265
Deep-Neural-Network based image diagnosis: comparing various image preprocessing strategies to achieve higher accuracy and understanding of the decision1Applied MRI Research, Department of Molecular Imaging and Theranostics, National Institute of Radiological Sciences, Chiba, Japan, 2Department of Molecular Imaging and Theranostics, National Institute of Radiological Sciences, Chiba, Japan
Synopsis
The purpose of this study was to investigate how image preprocessing might help overcome two problems for deep-neural-network (DNN) based image diagnosis: the need for a large training database to achieve high accuracy and the difficulty humans have in understanding the internal decision process. Five DNNs were trained with a brain image series (preprocessed in five different ways), to judge the age-range of a volunteer. The performance of the DNNs was then compared statistically. The results suggested that image preprocessing may facilitate higher accuracy, and also make it easier to understand how and why a judgement was made.
Introduction
Machine learning and artificial intelligence methods are increasingly becoming a topic of interest in medical diagnostic imaging. The “deep learning” (deep-neural-network: DNN) technique, which can learn autonomously, is a notable example. However, some problems remain to be solved before DNNs can be used as an effective tool in medicine. First, to achieve high accuracy, DNNs require a large number of training images which may not be readily available, and, second, as a side effect of the automation, it is difficult for humans to understand how and why a judgement was made. The second issue is especially important because it inhibits the feedback of new knowledge to other basic/clinical studies for scientific validation and further exploration. The purpose of the present study was to investigate the usefulness of image preprocessing in overcoming these problems.Methods
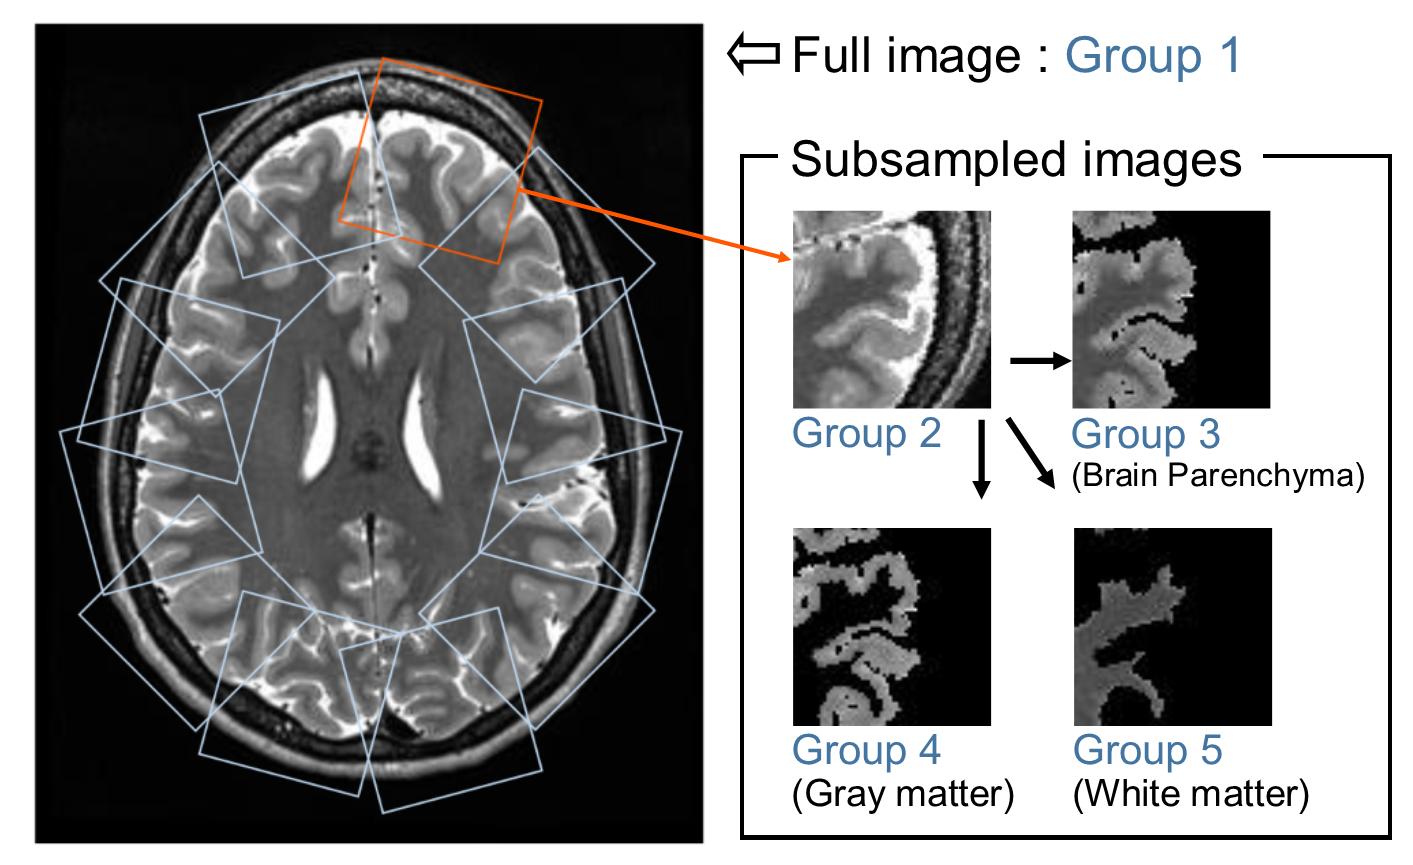
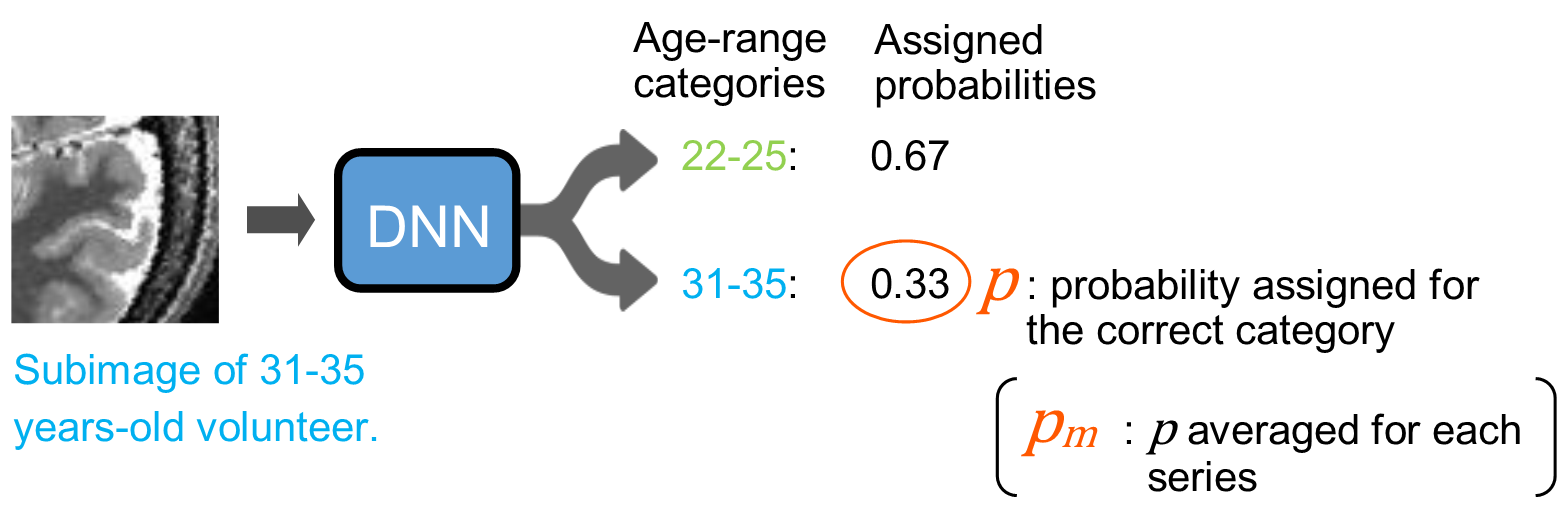
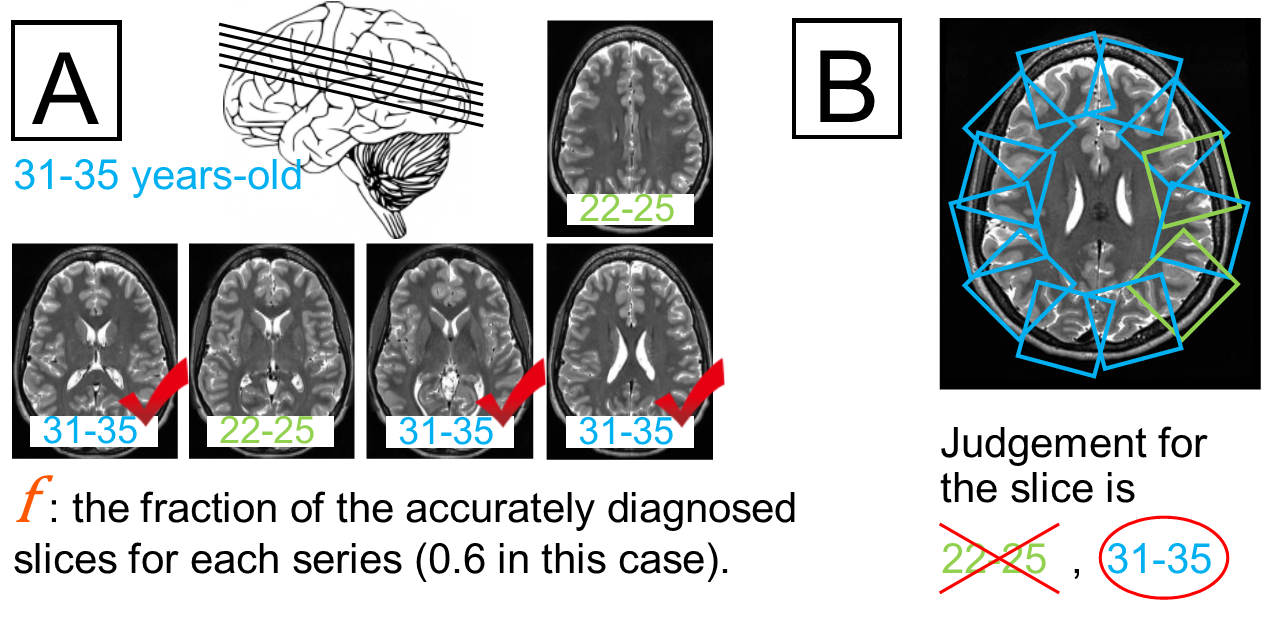
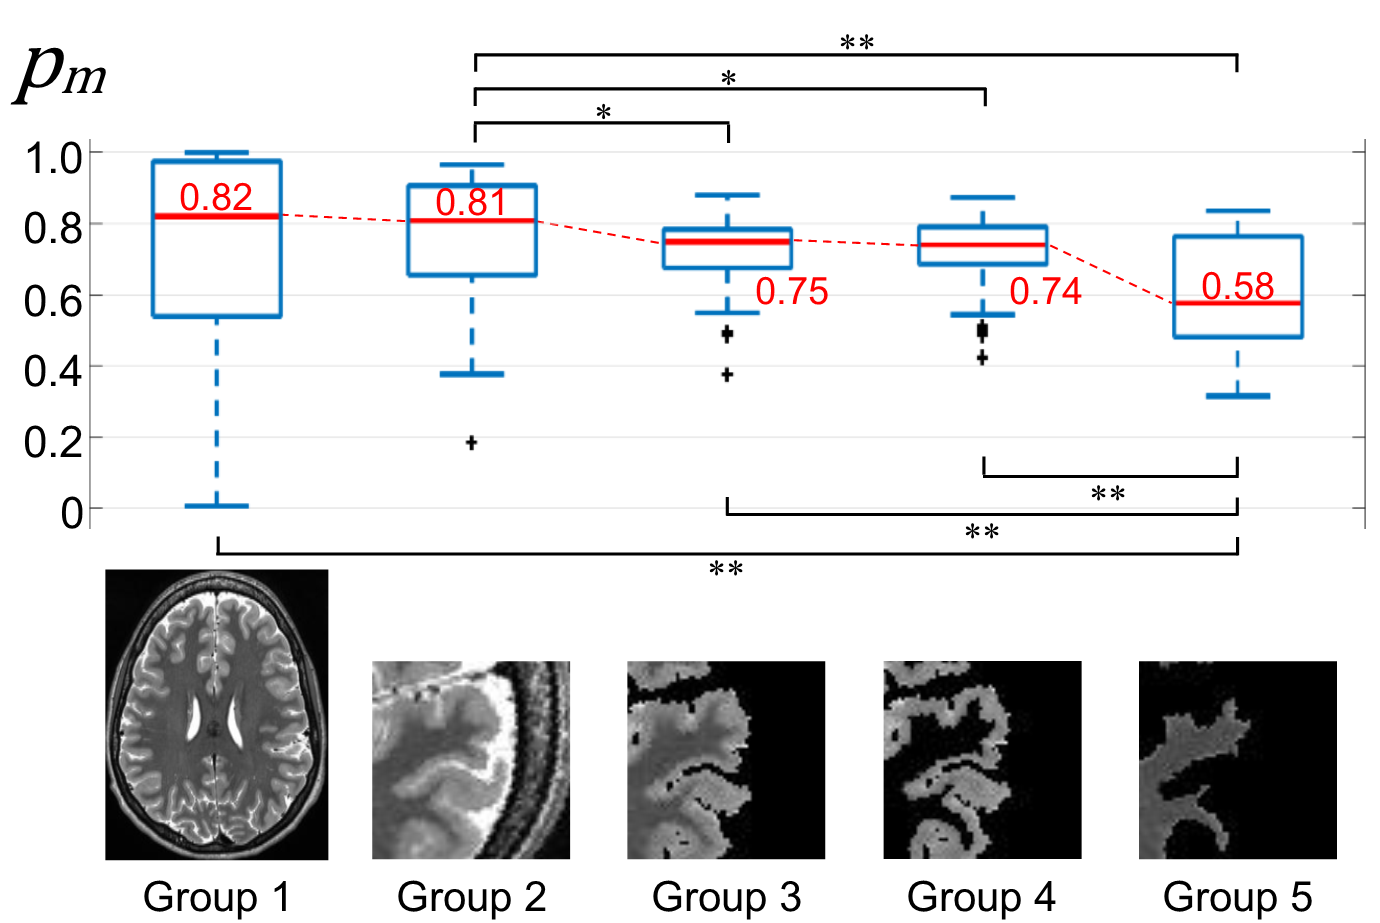
T2-weighted brain image series acquired from 501 healthy volunteers were downloaded from the database of the Human Connectome Project 1. Each series was tagged with the age-range of the volunteer (22-25 or 31-35 years-old). The target of the DNNs was to correctly categorize images to the correct age-range for a volunteer. Each image series was automatically preprocessed in five different ways based on the anatomical segmentation information included with the original data (Fig-1). The slices above the slice with the largest cross-sectional brain area were included in Group 1 without further processing. As Group 2, twelve subimages were sampled from around the periphery of the brain for each slice in Group 1 (Fig-1). Subsequently, the brain parenchyma area, the gray matter area, and the white matter area were isolated to form Groups 3, 4 and 5, respectively (Fig-1). For each group, the images from 413 randomly selected volunteers were used to train a DNN to judge the correct age-range for each image. A previously published training framework 2 and a set of network structure with primary parameter weights 3 was used. Other learning parameters, including the number of iterations, were identical for all five DNNs. The images corresponding to the remaining 88 volunteers were used to test the trained DNNs. First, to assess the overall ability to diagnose the correct age-range for each slice, each subimage from each slice was separately evaluated by the trained DNNs, and a probability that the subimage belongs to the correct age-range, p, was calculated (Fig-2). The fraction of accurately diagnosed slices, f, for each series was then recorded (Fig-3, A). For Groups 2 to 5, the judgement for each slice was determined as the most common judgement amongst the subimages corresponding to that slice (Fig-3, B). Second, to assess the confidence of the judgements for each group, the probabilities p corresponding to each subimage were averaged for each series to produce the number pm (Fig-2). Statistical comparisons between groups were performed using the Mann-Whitney test. P-values under 0.05 were considered significant.Results
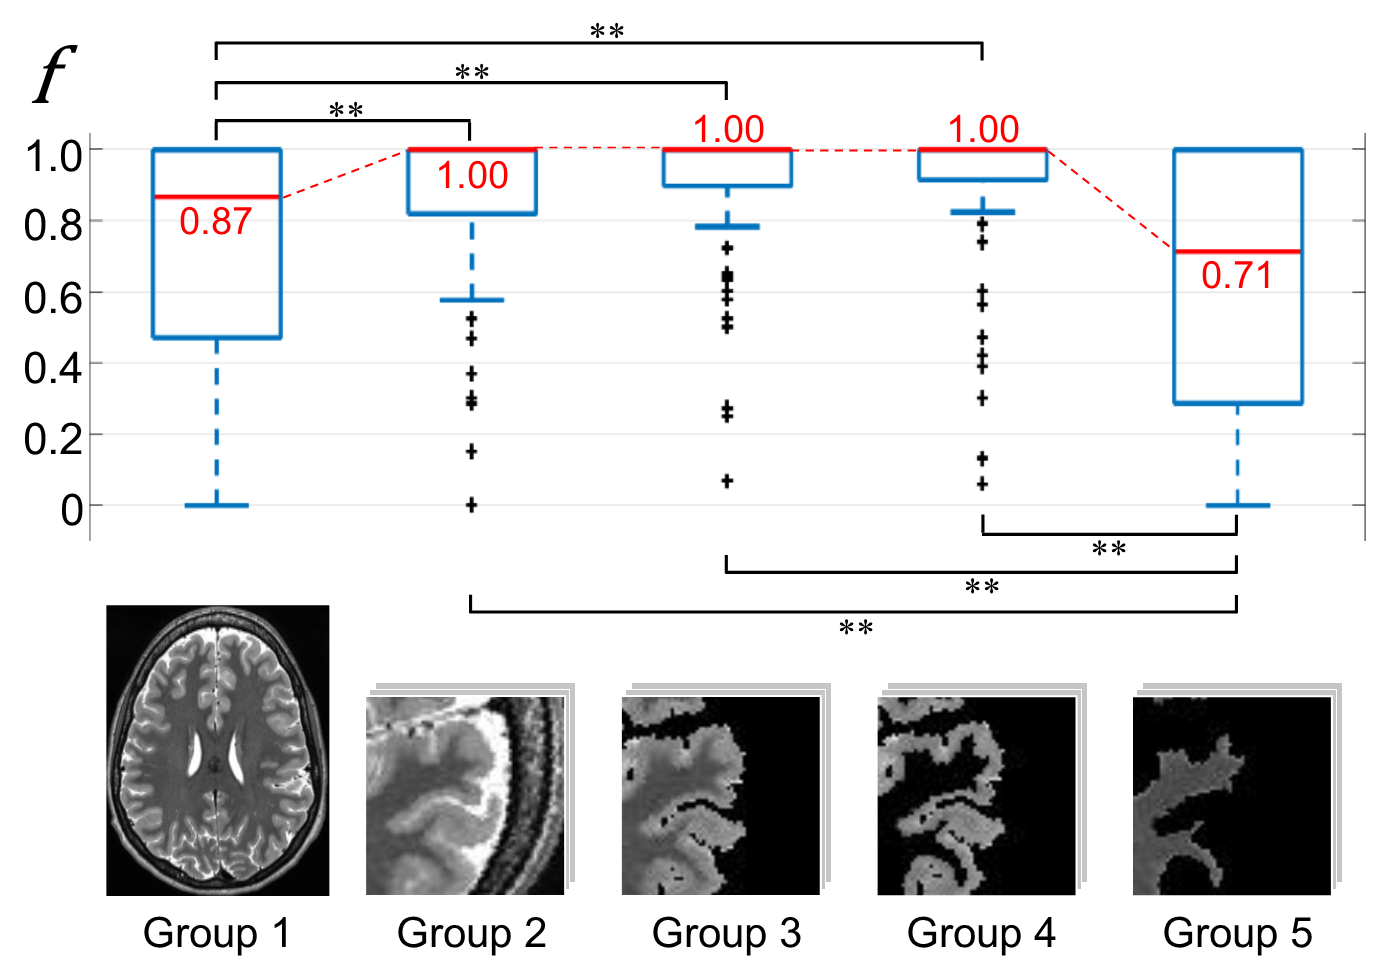
The median of the fraction f was 1.00 for Groups 2, 3, and 4, which were all significantly higher (P<0.01) than those for Group 1 (0.87) and Group 5 (0.71) (Fig-4). In assessing the confidence of the judgements, the median values of pm for Groups 3 and 4 (0.75 and 0.74) were significantly lower than that of Group 2 (0.81), but there was no significant difference between the two (Fig-5). The median value for Group 5 (0.58) was even significantly lower than those of Groups 3 and 4 (Fig-5).Discussion
It is suggested from the results for f (Fig-4) that suitable subsampling of the images and combination of the judgements can facilitate higher accuracy in the final diagnosis. Subsampling may also help to avoid overfitting when the number of training sets is limited because it increases the number of training images. The results for pm (Fig-5) suggest that using images with different preprocessing can help humans to understand how and why the judgement was made by the DNN. In this study, the significant difference in pm between Groups 2 and 3 may suggest that the CSF space was important for accurate diagnosis (ignoring the skull and extra-skull area), and the significant differences between Groups 3 & 4 and Group 5 may suggest that the shape of the sulcus (and gray matter contrast if there is any) was also important. On the other hand, the contrast inside the white matter may be less important because the difference between Groups 3 and 4 was not significant.Conclusion
Preprocessing of images before DNN-based diagnosis may facilitate higher accuracy and also make it easier to understand how and why the judgement was made by the algorithm.Acknowledgements
The authors thank Ms. Hiroko Kamada, Ms. Etsuko Mitsui, Ms. Sakiko Komai, and Mr. Yasuji Kasama for their assistance in performing this study.
Data were provided by the Human Connectome Project, WU-Minn Consortium (Principal Investigators: David Van Essen and Kamil Ugurbil; 1U54MH091657) funded by the 16 NIH Institutes and Centers that support the NIH Blueprint for Neuroscience Research; and by the McDonnell Center for Systems Neuroscience at Washington University.
References
1. Van Essen DC, Ugurbil K, Auerbach E, Barch D, Behrens TE, et al. (2012) The Human Connectome Project: a data acquisition perspective. Neuroimage 62: 2222-2231.
2. Jia Y, Shelhamer E, Donahue J, Karayev S, Long J, et al. (2014) Caffe: Convolutional Architecture for Fast Feature Embedding. arXiv preprint arXiv: 1408.5093.
3. Donahue J (2012) BVLC Reference CaffeNet: http://caffe.berkeleyvision.org/model_zoo.html.
Figures