0263
A New Combined Perfusion and Diffusion MRI Biomarker to Distinguish Pediatric High-Grade Glioma from Pilocytic Astrocytoma1Radiology, Medical College of Wisconsin, Milwaukee, WI, United States, 2Neurosurgery, Medical College of Wisconsin, Milwaukee, WI, United States
Synopsis
Pediatric high-grade glioma (HGG) and pilocytic-astrocyoma/optic-pathway gliomas (PA+OPG) are each very vascular tumors but vary substantially in their treatment, clinical course and long term prognosis. In this study we demonstrate that measurements that work in adults to distinguish tumor grades (eg RCBV) cannot distinguish between pediatric HGG and PA+OPG, but a new MRI biomarker, the ratio of standardized RCBV (sRCBV) to mean diffusivity (MD) can cleanly making this distinction. This finding has significant implications for treatment management in the pediatric brain tumor population.
Purpose
To evaluate the efficacy of perfusion and diffusion MRI metrics to distinguish low-grade from high-grade pediatric brain tumors with further distinction from the vascular pilocytic astrocytoma and optic pathway gliomas. Several perfusion parameters, including relative cerebral blood volume (rCBV), derived from DSC-MRI, as well as mean diffusivity (MD) and fractional anisotropy (FA), derived from diffusion tensor imaging (DTI) were evaluated. Though a similar determination has been made for adult brain tumors, pediatric brain tumors differ significantly from adult lesions in their histological features, clinical presentation and biological composition. Therefore, testing the utility of these imaging parameters for grading pediatric brain tumors is essential.Methods
This IRB-approved study was performed in patients aged newborn to 18 years of age with newly diagnosed untreated brain lesions. A total of 38 patients were studied (22 females and 16 males). Surgically-resected and non-resected tumors were classified according to WHO tumor grades I, II (low-grade gliomas (LGG)) and III, IV (high-grade gliomas (HGG)). The pilocytic astrocytomas and optic pathway gliomas were grouped separately (PA+OPG) as they are deemed less aggressive brain tumors but have a presentation on imaging that often mimics HGG. All MRI examinations were performed on a 1.5T (n=29) or 3.0T (n=9) MRI scanner. MRI data typically included both pre and post-contrast SPGR (TR/TE=7.4/3.14ms), FLAIR (TR/TE=8000/116ms), DTI (TR/TE=4000/100ms, slice=3-5mm, FOV=220x220, matrix=128x128), and DSC-MRI (GRE-EPI:TR/TE=1800/25ms, slice=4-5mm, FOV=240x240, matrix=128x128) A 0.1 mmol/kg Gd dosage was used for post-contrast SPGR, which also served as a preload dose for the DSC-MRI acquisition to diminish contrast agent leakage effects1, 2. An additional 0.1 mmol/kg Gd was injected during DSC-MRI data collection.
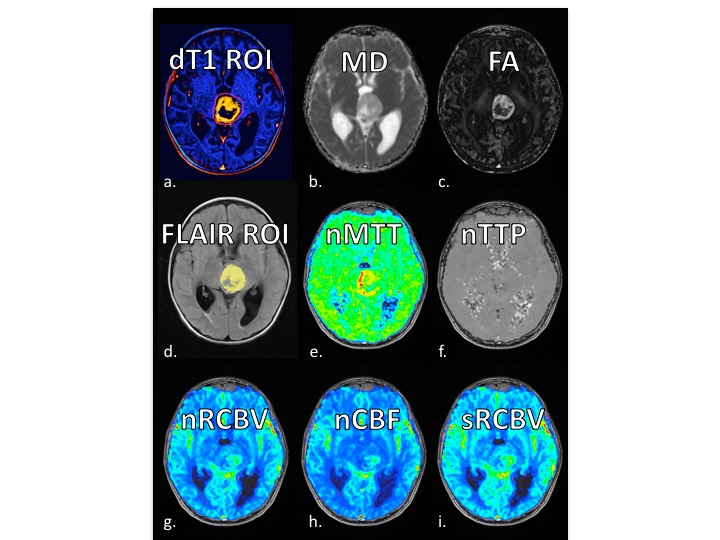
All intra-study images were co-registered to the highest resolution series using six degrees of freedom and a mutual-information cost function. Tumor ROIs were determined from standardized difference maps (dT1)3, FLAIR images excluding peritumoral edema or best available anatomic image, with all contours approved by experienced neuroradiologist (TK). Diffusion parameter maps included DTI-derived mean diffusivity (MD) and fractional anisotropy (FA). Perfusion parameter maps, created with IB NeuroTM (Imaging Biometrics, Elm Grove, WI), included normalized and standardized, leakage-corrected rCBV (nRCBV, sRCBV) as well as normalized relative cerebral blood flow (nRCBF), mean transit time (nMTT), and time to peak (nTTP). Ratios of mean values (sRCBV/MD, nRCBV/MD and nRCBV/MD) were also determined. Mean values were extracted from tumor ROIs and the ability of each parameter to distinguish tumor grades was assessed using the Mann Whitney t-test with alpha=0.05 as the level of significance. ROC analysis was also performed to identify a threshold, that gave the best sensitivity and specificity, to distinguish the HG, LG and PA+OPG categories.
Results
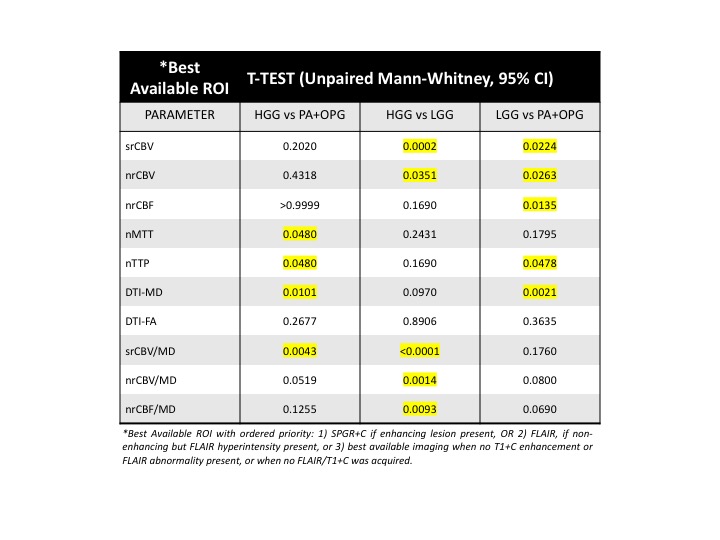
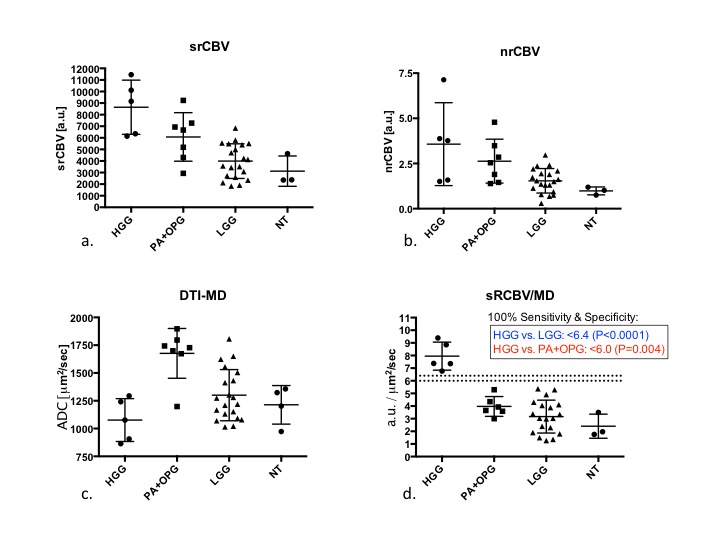
Example images, tumor ROIs, and parameter maps from one patient are shown in Figure 1. The Mann Whitney results for each parameter to distinguish the different grades (HGG versus PA+OPG, HGG vs LGG, LGG from PA+OPG) are listed in Figure 2. Of note, the srCBV is effective for distinguishing HGG vs. LGG (P=0.0002) and LGG vs. PA+OPG (P=0.0224) but not so for HGG vs. PA+OPGs (P>0.05). In contrast, the MD can be used to distinguish HGG vs. PA+OPGs (P=0.0101) and LGG vs. PA+OPGs (P= 0.0224), but cannot distinguish the HGG vs. LGG tumors with confidence (P>0.05). Yet in combination, the srCBV/MD ratio can differentiate HGG vs. PA+OPG and LGG. Scatter plots showing these trends with grade are given in Figure 3. The ROC analysis indicates that a srCBV/MD threshold of 6.036 provides a sensitivity and specificity of 100%, and an AUC of 1.0 to distinguish HGG vs. PA+OPG with a P-value=0.0043. Likewise, for a threshold of 6.365, HGG can be accurately distinguished from LGG, with a sensitivity and specificity of 100%, AUC of 1.00, with a P<0.0001.Discussion
The results of this study demonstrate that while rCBV can distinguish pediatric LGG from HGG, it cannot distinguish between HGG and PA+OPGs. This lack of distinction is problematic since PA+OPGs are considered less aggressive lesions even though they often exhibit high vascularity. Newly discovered in this study is the ability of the ratio, sRCBV/MD, to clearly distinguish HGG from PA+OPGs. Given that the current standard for the diagnosis of PA often requires obtaining a tissue biopsy, a reliable noninvasive marker such as sRCBV/MD to confirm diagnosis, can profoundly change treatment management for these patients with the potential to reducing the need and associated risks of surgery.Conclusion
This is the first report of a new imaging biomarker, sRCBV/MD, that can be used to distinguish pediatric HGG from PA+OPG tumors. This distinction has highly significant implications for the treatment management of pediatric brain tumor patients.Acknowledgements
NIH/NCI R01 CA082500; NIH/NCI U01 176110; American Cancer SocietyReferences
1. Schmainda, K.M., S.D. Rand, A.M. Joseph, et al., Characterization of a first-pass gradient-echo spin-echo method to predict brain tumor grade and angiogenesis. AJNR Am J Neuroradiol, 2004. 25(9): p. 1524-32. 2. Hu, L.S., L.C. Baxter, D.S. Pinnaduwage, et al., Optimized preload leakage-correction methods to improve the diagnostic accuracy of dynamic susceptibility-weighted contrast-enhanced perfusion MR imaging in posttreatment gliomas. AJNR Am J Neuroradiol, 2010. 31(1): p. 40-8. 3. Bedekar, D., T. Jensen, S. Rand, M.G. Malkin, J. Connelly, and K.M. Schmainda. Delta T1 Method: An automatic postl-contrast RO1 selection technique for brain tumors. in Proc. Intl. Soc. Mag. Reson. Med., 18th Annual Meeting. 2010. Stockholm, Sweden.Figures