0262
Perfusion-supervoxels for DCE-MRI based tumor subregion assessment1Institute of Biomedical Engineering, University of Oxford, Oxford, United Kingdom, 2Department of Oncology, University of Oxford, Oxford, United Kingdom, 3Division of Imaging Sciences and Biomedical Engineering, King's College London, London, United Kingdom
Synopsis
Tumors exhibit chaotic and leaky vasculature, which leads to variations in perfusion, and regions of edema, hypoxia and necrosis. We develop a method to extract perfusion-supervoxels, regions of locally similar perfusion, and use these regions with k-means clustering to define tumor subregions that are robust to noise and outliers. This method offers a number of advantages over both mean tumor parameters and voxelwise clustering.
Purpose
Angiogenesis, the formation of new blood vessels, is important for tumor progression. Tumors exhibit chaotic, leaky vasculature yielding variations in perfusion, which can be assessed with dynamic contrast-enhanced (DCE-)MRI. The vascularity also forms regions of edema, hypoxia and necrosis. Because of this, subregional analysis is key to tumor assessment.
Clustering, based on quantitative imaging parameters is commonly used to define tumor subregions1,2; but depends on the distribution of image-derived features within the tumor, leading to regions that vary on a case by case basis. A cohort of cases can be jointly clustered to define representative region labels3; however, combining the voxels leads to clustering of a very large number of data points based on potentially noisy, motion-affected or partially volumed parameter maps, which affects subregion definition.
We propose a method to extract locally meaningful, contiguous, perfusion subregions from DCE-MRI scans to enable efficient, robust region comparisons across a cohort. We extend Simple Linear Iterative Clustering (SLIC)4 to perfusion scans, and cluster the derived supervoxels into representative tumor subregions. This method is evaluated using DCE-MRI scans taken daily of tumor growth, and is compared to both voxel clustering and mean tumor parameters.
Methods
MRI was performed at 4.7T on 10 female CBA mice with subcutaneously implanted CaNT tumors over 8 days to monitor tumor growth. DCE-MRI was performed using 60 repeats of a cardio-respiratory gated RF and gradient spoiled 3D gradient echo scan every 10-15s. Scan parameters: TR 1.4ms, TE 0.64ms, FA 5o and voxel size 0.42x0.42x0.42 mm3. Gd3+ was automatically infused into the lateral tail vein. Scans for which tail vein cannulation failed were excluded from analysis leaving 69 (of 80 possible) scans. T1 was determined prior to DCE-MRI from a variable flip angle (VFA) scan with 16 FAs ranging from 1o to 7o.
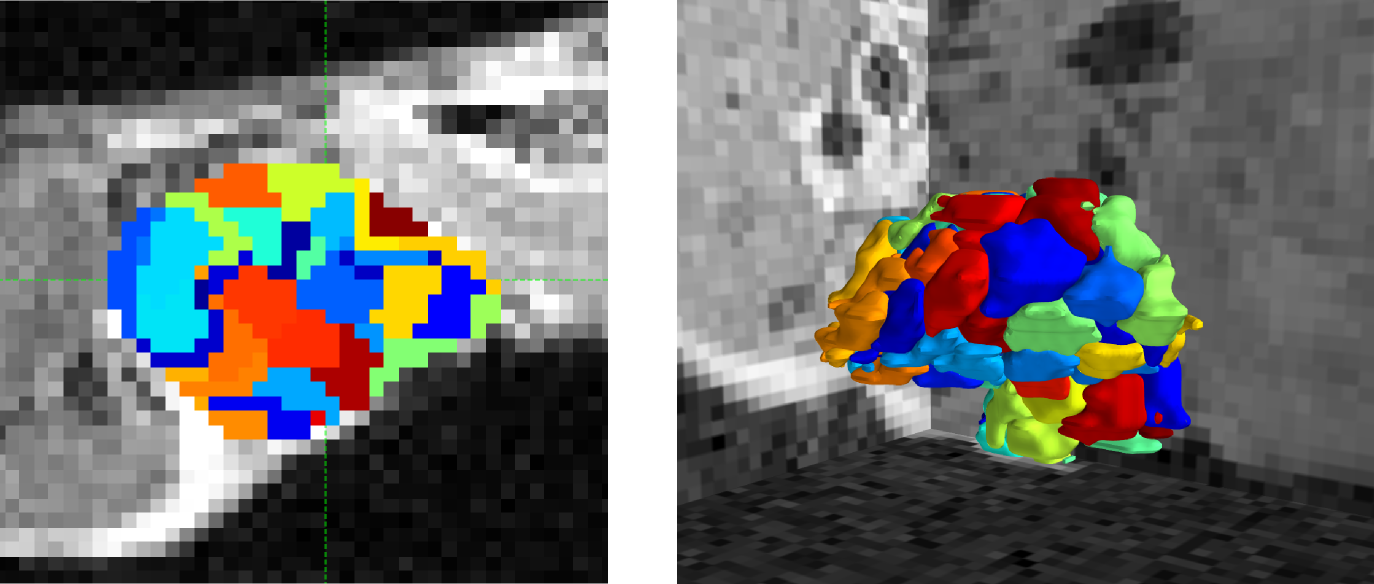
We apply SLIC to 4D DCE-MRI scans using principal component decomposition of perfusion for supervoxelisation5,6. Each tumor was decomposed into 100 spatially contiguous supervoxel subregions with locally-similar perfusion, Figure 1.
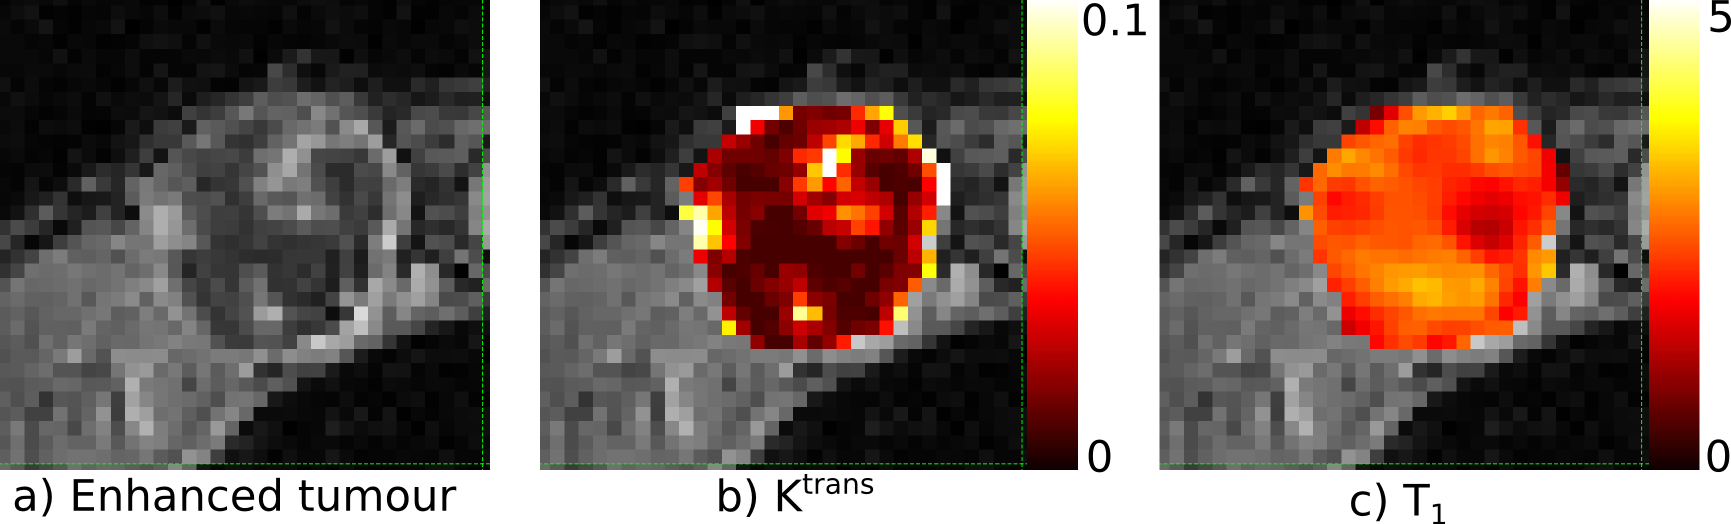
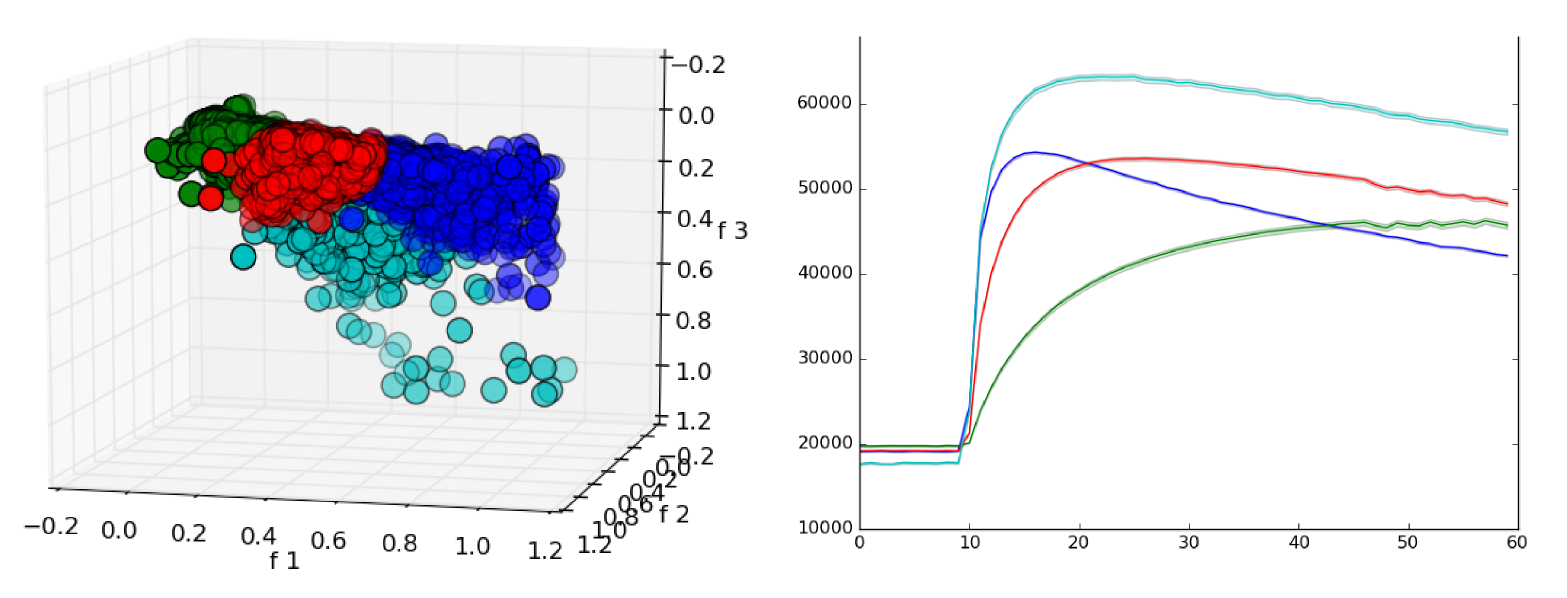
The Tofts model was fitted to the DCE-MRI contrast enhancement curves to calculate Ktrans and kep (Figure 2). The supervoxels from all cases were clustered (K-means) into four classes using Ktrans, kep and T1 as features, forming larger regions. The choice of four regions was based on previous studies7. For comparison, K-means was also used to cluster voxels based on the same parameters. We defined voxel contiguity8 as the proportion of neighbors with a different label ($$$l_j$$$) to each voxel of interest: $$D_i = \frac{\mathrm{26neigh \, with \, }l_j \neq l_i}{26}$$ The score for the whole tumor is: $$$D = \frac{1}{N} \sum_{i=1}^N D_i$$$ where $$$N$$$ is the total number of voxels in the tumor. $$$D$$$ ranges between 0 (completely contiguous) and 1 (no contiguity).
Results
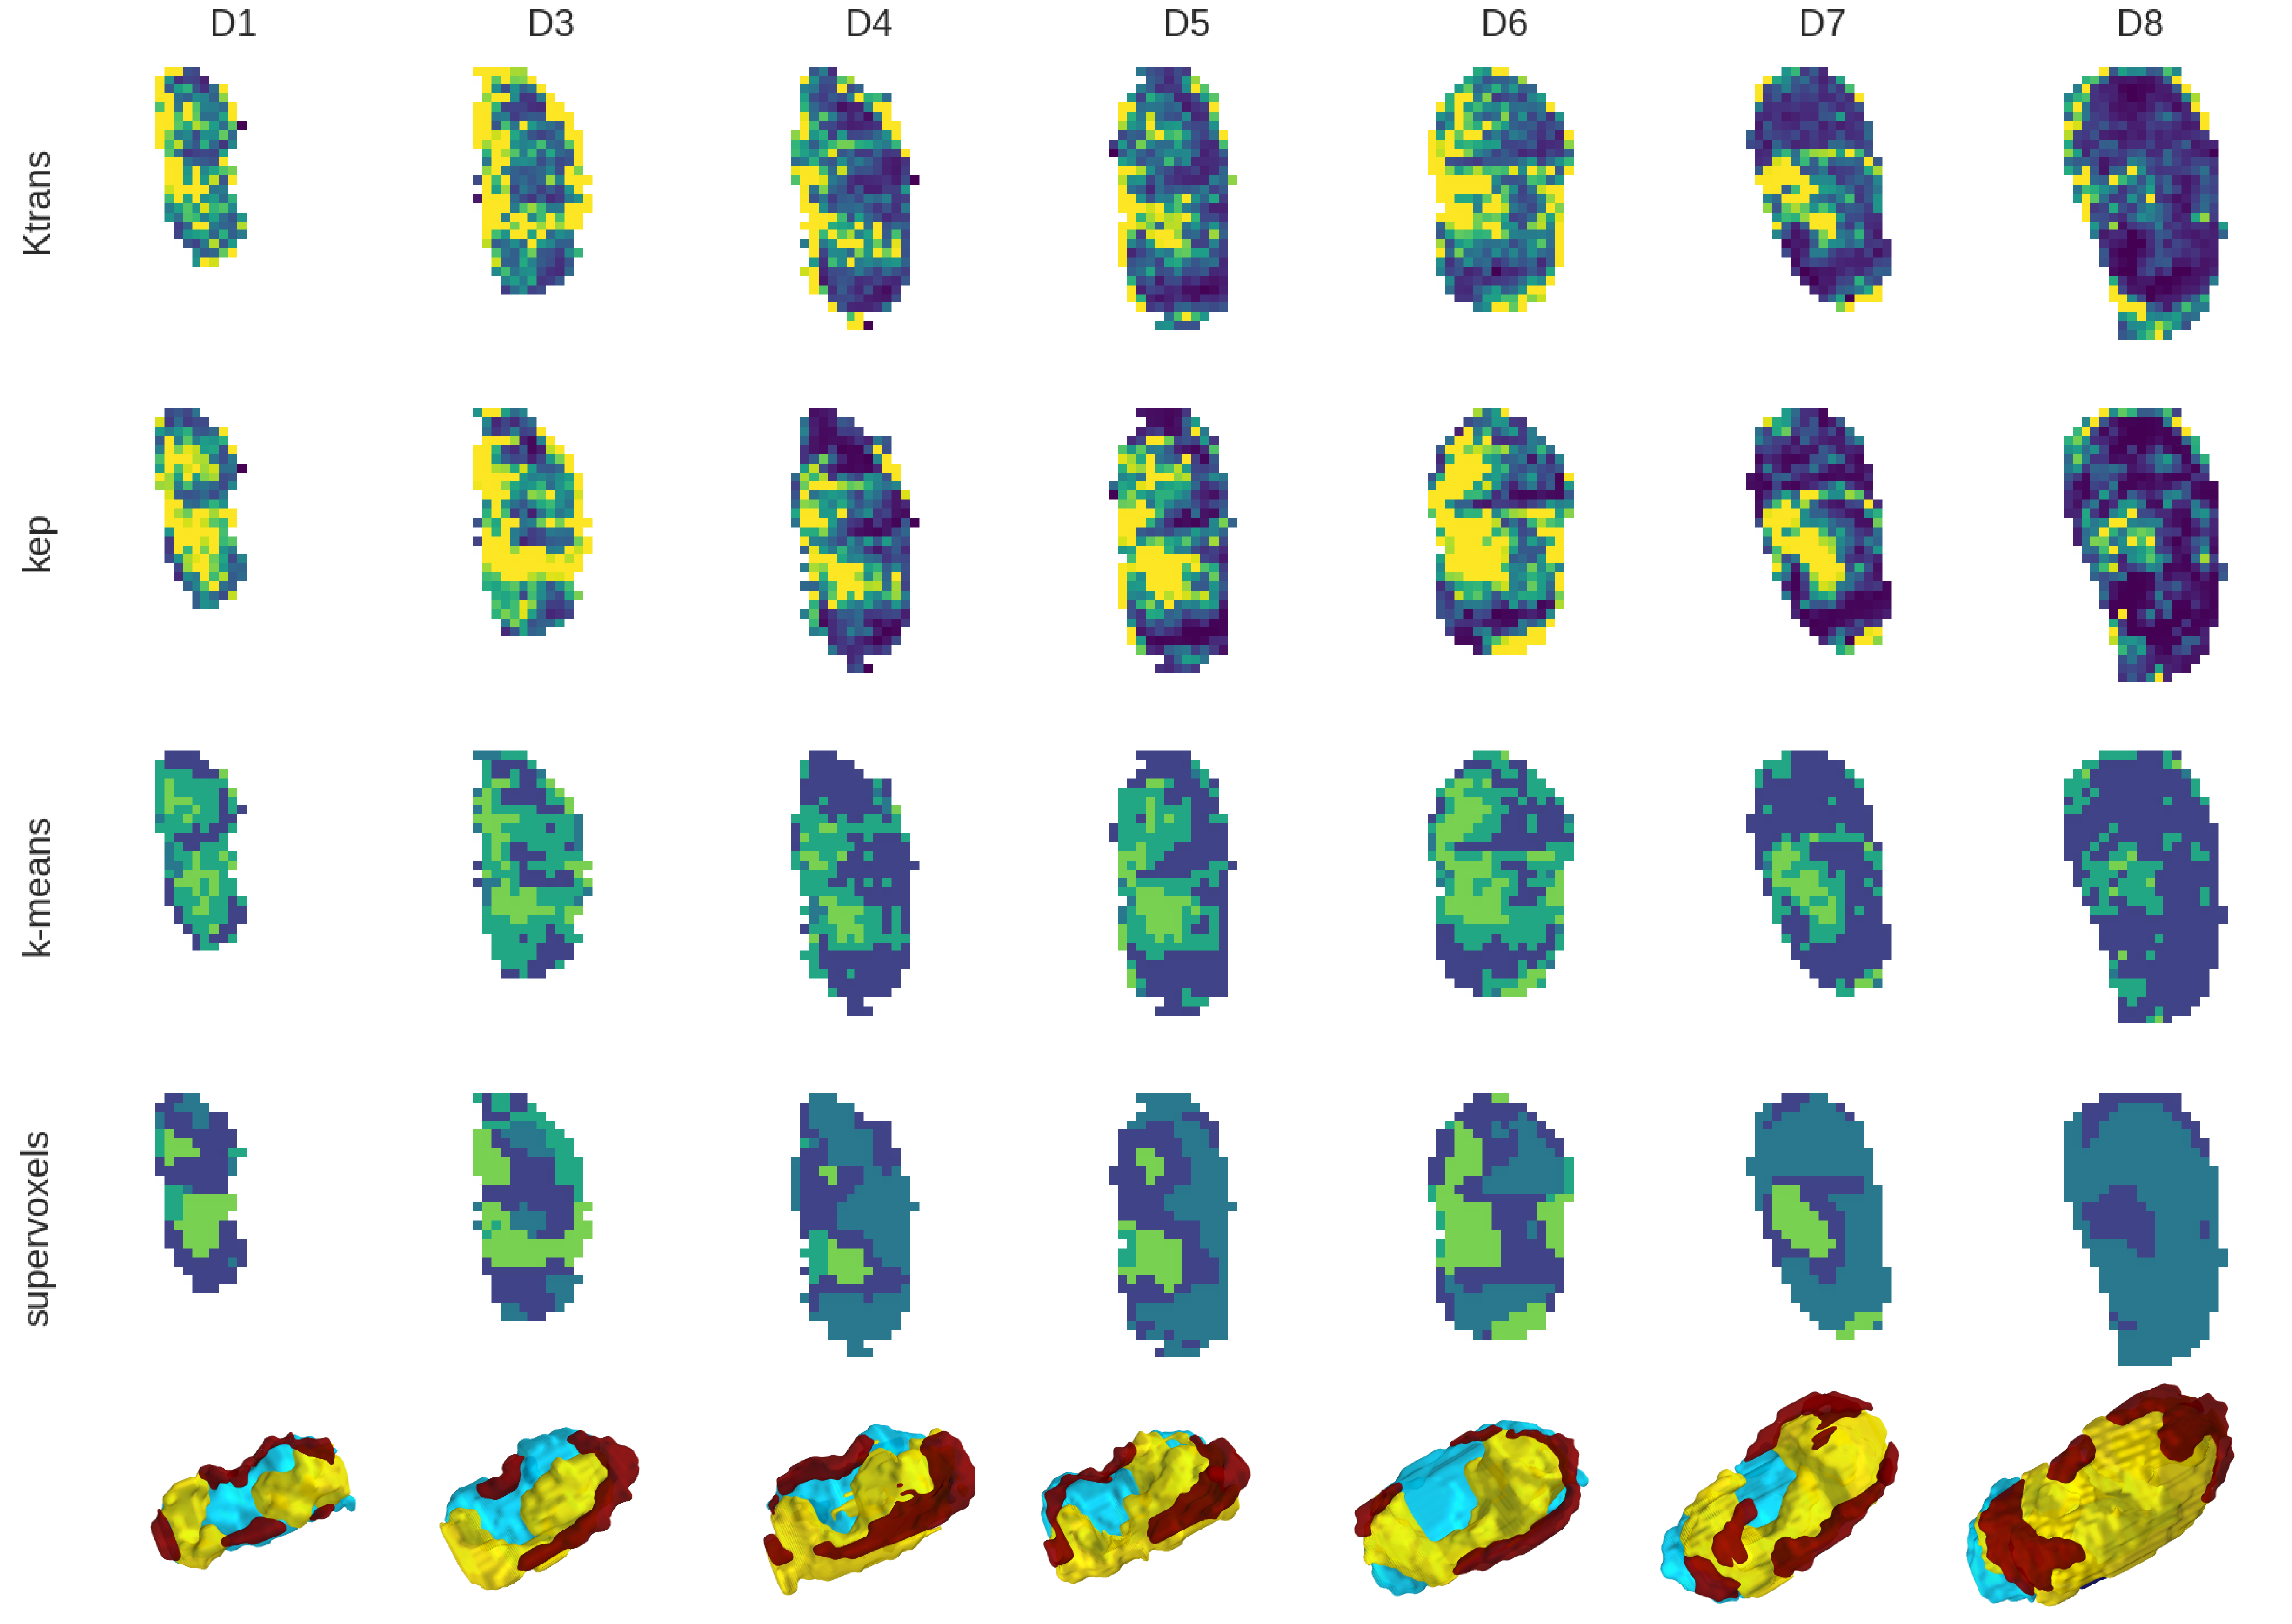
Supervoxel clusters are shown in Figure 3. K-means clustering of perfusion-supervoxels creates less noisy, more contiguous regions — with mean (dis)contiguity scores of 0.25 and 0.40, for supervoxel and voxel clustering, respectively. The regions show consistency with tumor growth across multiple scans and days (Figure 4). Regional contiguity improves 3D visualization.
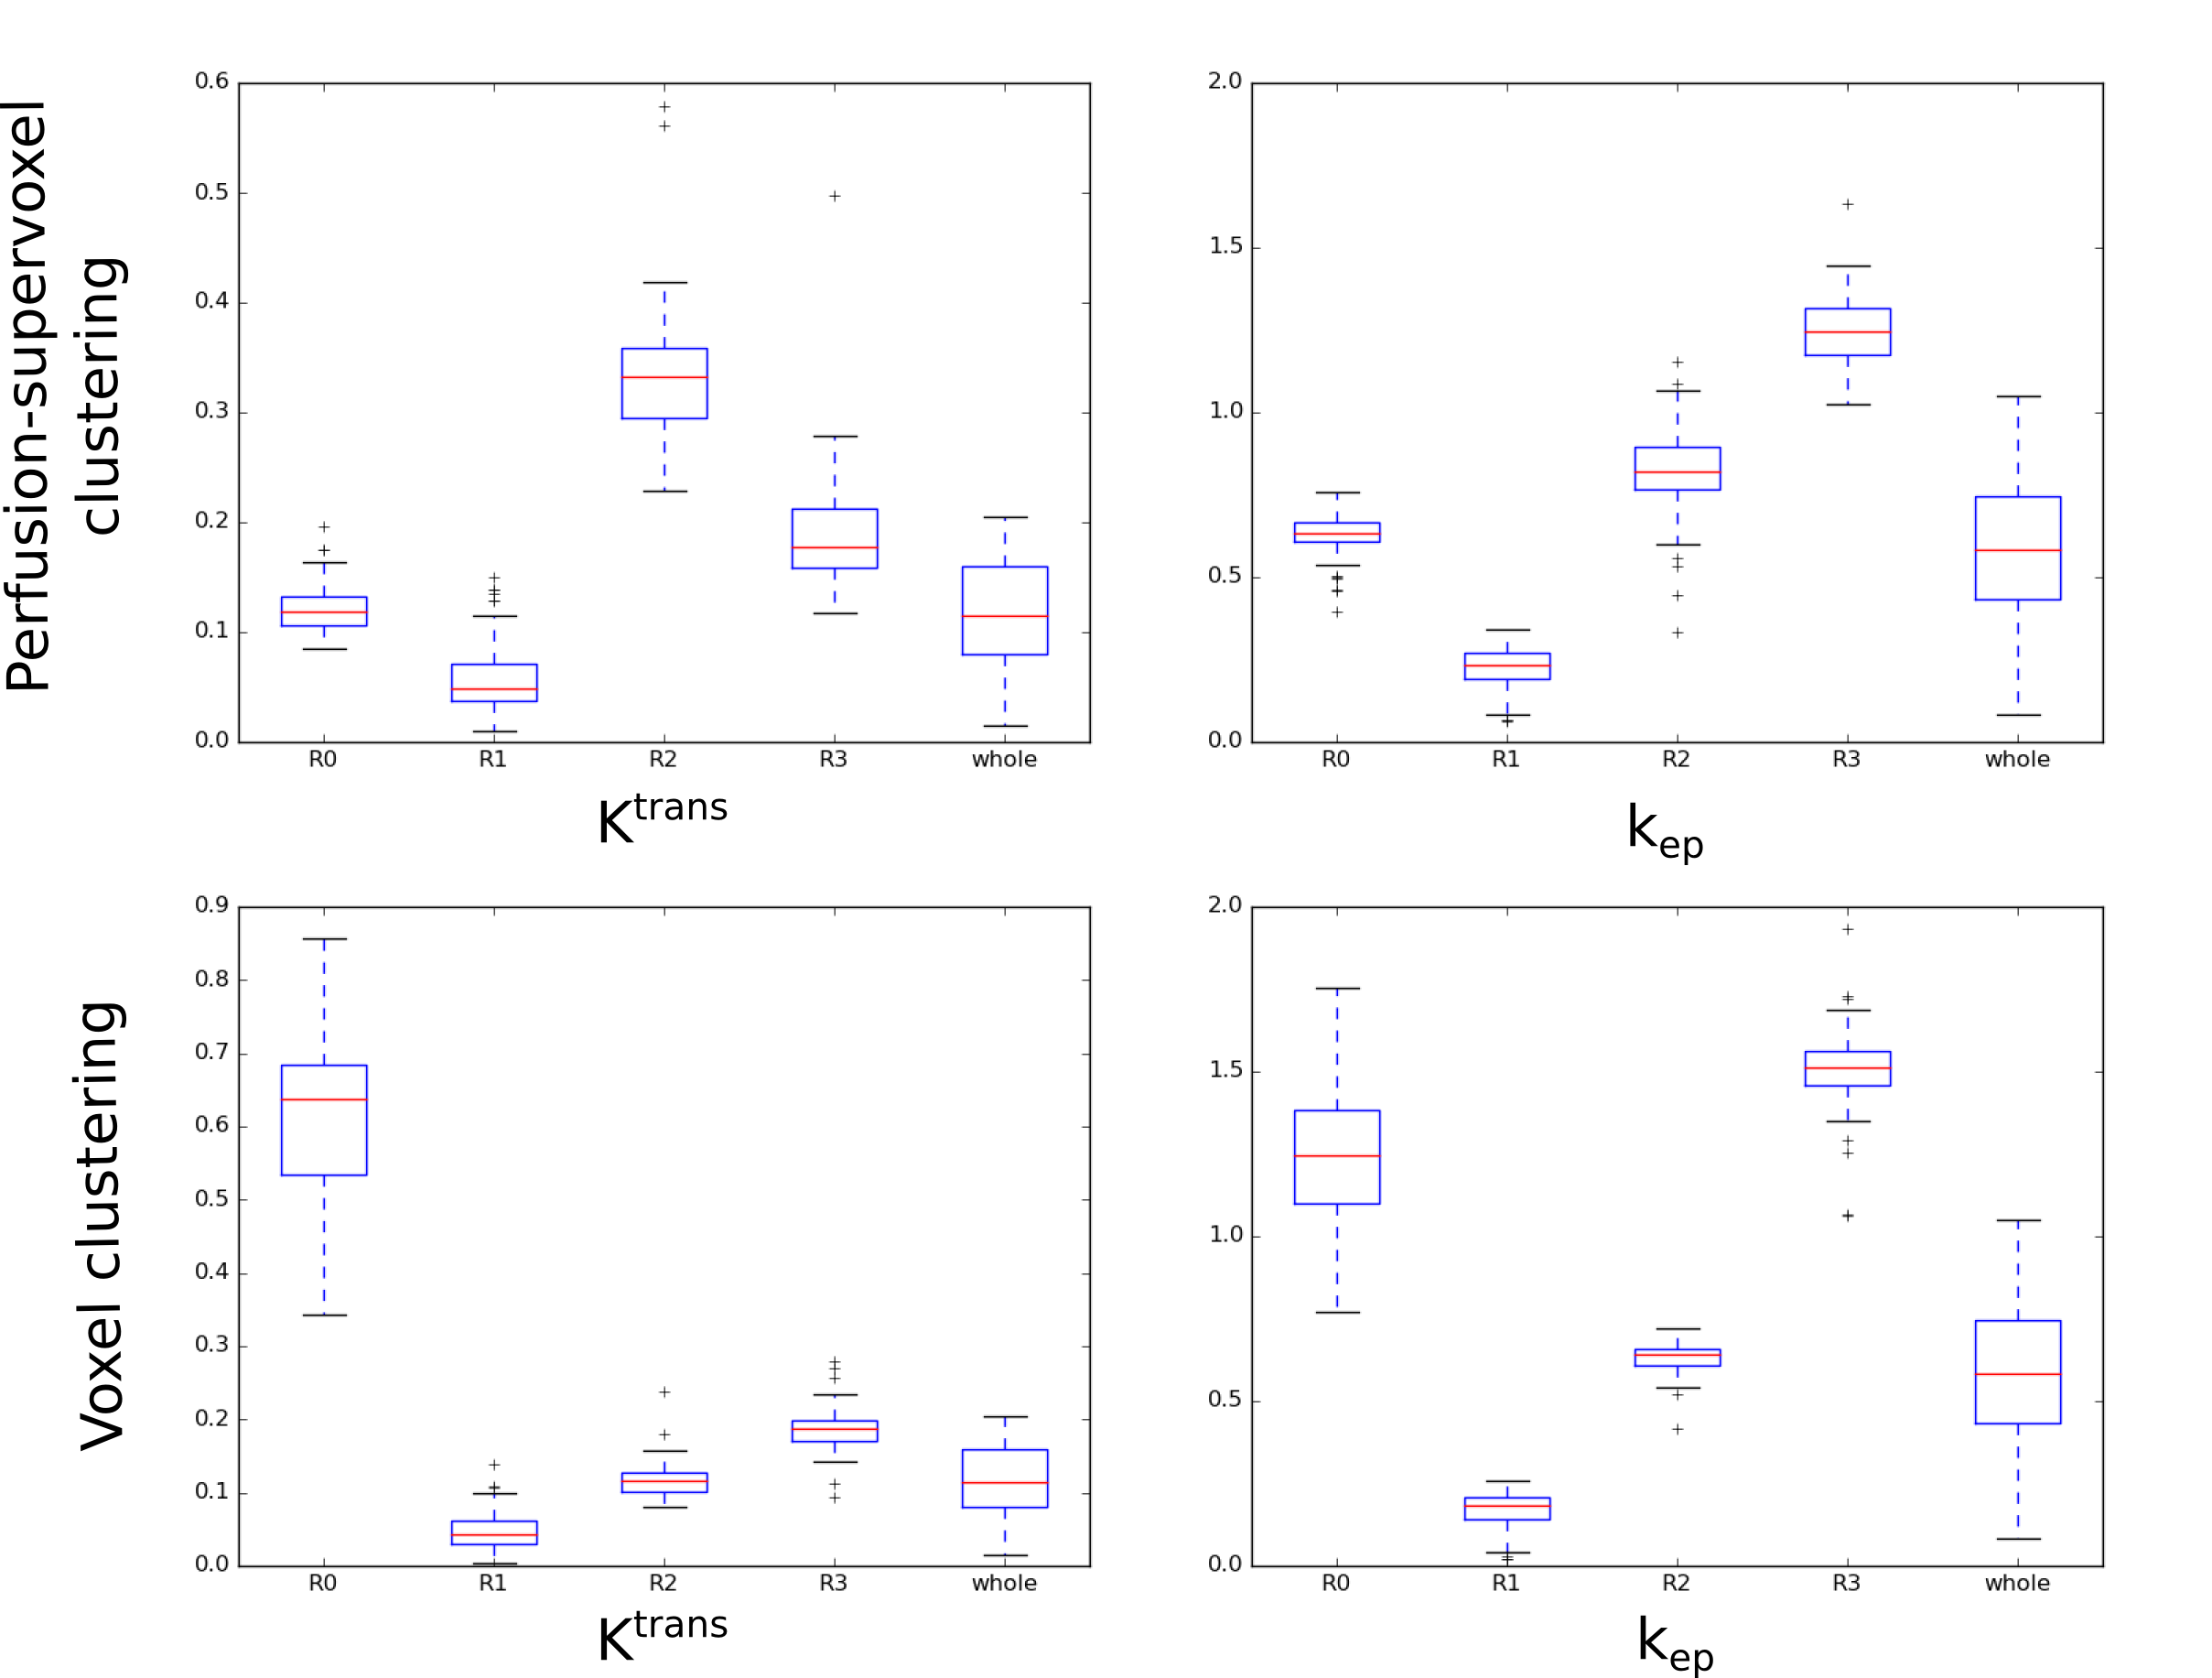
The four region labels offer an improved metric for tumor perfusion relative to using the frequently used mean tumor parameter. Figure 5 shows variation of each of the four regions for Ktrans and kep across the dataset compared to whole tumor parameters. Mean parameters for each region were similar across cases. Ktrans and kep are significantly different between the four subregion groups — using one-way ANOVA with post-hoc Tukey HSD analysis to reject the null hypothesis (p=0.01). Interestingly, while some regions show a link between parameters (both low kep and Ktrans or high kep and Ktrans), other regions show parameter decoupling (high kep, low Ktrans).
K-means voxel clustering is comparatively susceptible to outliers. Figure 5 shows regional parameter values when using voxel based clustering: whilst there were significant quantitative differences between each region, there was correlation between Ktrans and kep in each region, unlike when using the supervoxel method. R0 appears to exhibit the consequences of outliers biasing the clustering.
Discussion and Conclusion
Supervoxel-based analysis methods have a number of advantages over voxel-based analysis for the subregional assessment of tumors. These include: 1) providing spatial regularization to reduce noisy voxel outliers, and 2) reducing the representation of each tumor into contiguous supervoxels that allows efficient comparison across the large datasets of cases.
In this work we show that using perfusion-supervoxels before clustering provides an improved tumor region definition when analyzing a cohort of cases. In future, we will use these subregions to assess the spatial relationship between subregions within the tumor.
Acknowledgements
This research is supported by the CRUK/EPSRC Cancer Imaging Centre at Oxford. Support is also provided by Cancer Research UK (CRUK grants C5255/A12678, C2522/A10339), the Engineering and Physical Sciences Research Council (EPSRC grant C2522/A10339) and the Medical Research Council Unit Grant for the Oxford Institute for Radiation Oncology.References
1. O’ Connor J, Rose C, Waterton J et al. Imaging introtumour heterogeneity: role in therapy response, resistance, and clinical outcome. Clin Cancer Res. 2014; 21(2):249-257.
2. Castellani U, Cristiani M, Daducci A et al. DCE-MRI data analysis for cancer area classification. Methods Inf Med. 2009. 48(3):248-253.
3. Henning E, Azuma C, Sotak C et al. Multispectral quantification of tissue types in a RIF-1 tumor model with histological validation. Magn Reson Med. 2007. 57(3):501-512.
4. Achanta R, Shaji A, Smith K et al. SLIC Superpixels Compared to State-of-the-Art Superpixel Methods. IEEE Trans Pattern Anal Mach Intell. 2012. 34(11):2274-2281.
5. Irving B, Cifor A, Papiez B et al. Automated Colorectal Tumour Segmentation in DCE-MRI using Supervoxel Neighbourhood Contrast Characteristics. MICCAI. 2014. 8673:609-616.
6. Irving B, Franklin J, Papiez, B et al. Pieces-of-parts for supervoxel segmentation with global context: Application to DCE-MRI tumour delineation. Med Image Anal. 2016. 32:69-73.
7. Menze B, Jakab A, Bauer S et al. The multimodal brain tumor image segmentation benchmark (BRATS). IEEE Trans Med Imag. 2015. 34 (10):1993-2024.
8. Theiler J and Gisel G. A contiguity-enhanced k-means clustering algorithm for unsupervised multispectral image segmentation. SPIE. 1997. 3159:108-118.
Figures